1254
IEEE TRANSACTIONS ON POWER SYSTEMS, VOL. 25, NO. 3, AUGUST 2010
Node-Depth Encoding and Multiobjective Evolutionary Algorithm Applied to Large-Scale Distribution System Reconfiguration A. C. Santos, A. C. B. Delbem, J. B. A. London, Jr., Member, IEEE, and N. G. Bretas
Abstract—The power loss reduction in distribution systems (DSs) is a nonlinear and multiobjective problem. Service restoration in DSs is even computationally hard since it additionally requires a solution in real-time. Both DS problems are computationally complex. For large-scale networks, the usual problem formulation has thousands of constraint equations. The node-depth encoding (NDE) enables a modeling of DSs problems that eliminates several constraint equations from the usual formulation, making the problem solution simpler. On the other hand, a multiobjective evolutionary algorithm (EA) based on subpopulation tables adequately models several objectives and constraints, enabling a better exploration of the search space. The combination of the multiobjective EA with NDE (MEAN) results in the proposed approach for solving DSs problems for large-scale networks. Simulation results have shown the MEAN is able to find adequate restoration plans for a real DS with 3860 buses and 632 switches in a running time of 0.68 s. Moreover, the MEAN has shown a sublinear running time in function of the system size. Tests with networks ranging from 632 to 5166 switches indicate that the MEAN can find network configurations corresponding to a power loss reduction of 27.64% for very large networks requiring relatively low running time. Index Terms—Data structure, evolutionary algorithms, graph representation, large-scale network, node-depth encoding, system reconfiguration.
Maximum number of individuals generated. New individual. MEAN
Multiobjective EA with node-depth encoding.
NC
Normally closed.
NDE
Node-depth encoding.
NO
Normally open.
PAO
Preserve ancestor operator. Subpopulation .
PLR
Power loss reduction.
RT
Running time.
SLFA
Sweep load-flow algorithm. Size of
.
SR
Service restoration.
TSO
Terminal-substation order.
I. INTRODUCTION NOMENCLATURE ADS
Adequate data structure.
CAO
Change ancestor operator.
DS
Distribution system.
DSR
Distribution system reconfiguration.
EA
Evolutionary algorithm.
GCR
Graph chain representation.
A. Motivation
D
Manuscript received March 19, 2009; revised September 24, 2009. First published March 29, 2010; current version published July 21, 2010. This work was supported by CNPq. Paper no. TPWRS-00208-2009. A. C. Santos is with the Federal Institute of Education, Science and Technology of Tocantins (IFTO), Palmas 77021-090, Brazil (e-mail: augusto@ifto. edu.br). A. C. B. Delbem is with the Institute of Mathematical and Computer Sciences, University of Sao Paulo, Sao Carlos-SP, Brazil (e-mail:
[email protected]). J. B. A. London, Jr. and N. G. Bretas are with the Sao Carlos Engineering School, University of Sao Paulo, Sao Carlos-SP, Brazil (e-mail:
[email protected];
[email protected]). Color versions of one or more of the figures in this paper are available online at http://ieeexplore.ieee.org. Digital Object Identifier 10.1109/TPWRS.2010.2041475
ISTRIBUTION system problems, such as power loss reduction (PLR), service restoration (SR), and planning, usually involve network reconfiguration procedures. As a consequence, they can be considered distribution system reconfiguration (DSR) problems, which are usually formulated as multiobjective and multiconstrained optimization problems. The design of an optimal network configuration is a combinatorial optimization problem that may require the investigation of several switching status vectors to find a new adequate configuration. Usually, there are few (many) possible configurations that attend all the constraints, feasible solutions, for a network modeled using a small (large) number of switches. In this sense, the modeling of a network using a larger number of switches is more plausible. Nevertheless, a network model with a large number of switches has been avoided in the literature, since finding a feasible solution for such model is computationally intense. An approach to solve DSR problems that overcomes such a hurdle is proposed in this paper. The approach can obtain feasible solutions for networks modeled with thousands of buses and switches with relatively soft computing.
0885-8950/$26.00 © 2010 IEEE
SANTOS et al.: NODE-DEPTH ENCODING AND MULTIOBJECTIVE EVOLUTIONARY ALGORITHM
B. Literature Review This paper frames itself in the rich body of DSR approaches. Merlin and Back [1] developed the first approach to address DSR problems. They perceived an opportunity to reduce technical losses by altering feeder topological structure changing the status of normally closed (NC) and normally open (NO) switches. After this work, different approaches, such as heuristic algorithms [2]–[6], expert systems [7], and dedicated data base [8], [9], have been suggested to solve this complex problem. However, these approaches have produced solutions that may not even be suboptimal [10]. Some researchers have employed methods based upon mathematical programming approaches. They formulate the DSR problems as an optimization problem suitable for solution by one of the standard techniques, as for example, linear programming. The main disadvantage of these approaches is the CPU running time (RT) [11]. Several evolutionary algorithms (EAs) have been developed to deal with DSR problems [12]–[16]. Although the obtained results have been encouraging, the majority of EAs still demand high RT when applied to large-scale distribution systems (DSs). In [17], it was shown that the tree encoding (data structure) used is a critical factor for the performance of EAs applied to such large DSs. Other critical aspects of EAs are the genetic operators that are implemented. Generally these operators do not generate radial configurations [18]. In order to improve the performance obtained by EAs in DSR problems, a tree encoding based on graph chains, called graph chains representation (GCR), and its corresponding genetic operators were developed in [17]. These operators produce only radial configurations. Although the requirement of a radial configuration is common for DSR problems, it makes the network modeling more difficult to efficiently reconfigure DSs. Recently a new tree encoding, named node-depth encoding (NDE), was proposed [19], [20]. The NDE has presented better performance than the GCR to network design since: 1) the NDE’s operators are relatively easier to implement and adapt to different problems than the GCR’s operators; , while the GCR needs 2) the NDE requires memory size , where is the number of graph vertices; 3) the NDE’s operators require average RT , while the GCR RT is . Differently from the approach in [17], which creates specialized operators, the approach from [18] develops a codification for PLR problem that enables the use of the natural genetic recombination to always generate radial configurations from other radial configurations. However, the efficiency of this approach for large-scale networks was not analyzed in [18]. The proposed codification is a list of network branches stored in an array. The recombination operator is based on a Prim algorithm, originally developed for the minimal spanning tree problem [21]. We highlight that the best implementation for the Prim algorithm is , where is the number of branches (graph edges). The most efficient implementation of a recombination operator for network reconfiguration from a list of branches (the edge set encoding [22]) is . In relation to memory space, an edge-set encoding is [22].
1255
Noting that RT is a relevant aspect for approaches leading to large-scale DSs, the relatively low time complexity of the makes them promising for DSR NDE’s operators problems. C. Contributions The main contribution of this paper is a new formulation to DSR problems that enables the development of fast algorithms for the construction of adequate solutions to a large-scale DS. First the paper presents the new formulation, which models DSR problems through the NDE and its genetic operators. Then, it proposes a new EA based on that formulation for DSR problems. The EA using the NDE-based formulation can explore the search space more efficiently, producing better solutions due to the following NDE properties. 1) The NDE and its operators produce exclusively feasible configurations, that is, radial networks able to supply energy for the whole system.1 2) The NDE can generate significantly more feasible configurations (potential solutions) in relation to other codifications in the same RT since its average time complexity is . 3) The NDE-based formulation also enables a more efficient forward-backward sweep load-flow algorithm (SLFA) for DSs. Typically this kind of load flow applied to radial networks requires a routine to sort network buses into the terminal-substation order (TSO) before calculating the bus voltages [23]–[26]. Fortunately, each configuration represented by the NDE has the buses naturally arranged in the TSO. Thus, the SLFA can be significantly improved by the NDE-based formulation. Another special feature of the proposed approach is the strategy to deal with multiple objectives and constraints. In general, current approaches based on EAs employ a composite objective function that weights the multiple objectives and penalizes the violation of constraints. This strategy suffers from various disadvantages [27], which can be overcome through an EA based on subpopulation tables [17]. As in [17], each subpopulation of the EA here proposed stores the found solutions that better attend an objective or a constraint of a DSR problem. The EA with subpopulation tables can more easily leave the local toward global optima. Moreover, the use of a subpopulation table for each constraint enables a better exploration of a search space since it guarantees the investigation of solutions near the frontiers of the space as well as intermediate solutions. As a consequence, the MEAN more easily leaves local optima, avoiding premature convergence and moving towards the global optima. Recently, a new multiobjective evolutionary algorithm based on weighted sum and weighted Tchebycheff metrics was proposed [28]. This EA, in a similar way as the MEAN, uses a procedure based on information from aggregation function (weighted sum), and from an estimate of the distances from each solution to the ideal value 1The term the whole system means all connected parts of the system. Occasionally, there is no switch to connect an out-of-service zone to the remaining network.
1256
IEEE TRANSACTIONS ON POWER SYSTEMS, VOL. 25, NO. 3, AUGUST 2010
for each objective (weighted Tchebycheff) to drive the search. Results presented in [28] show that such procedure provides a better exploration of the search space, especially for combinatorial problems with two or more objective functions, moreover, that approach is computationally more efficient. The 1)–3) NDE properties and the subpopulation table strategy characterize the multiobjective EA using the NDE (MEAN) proposed in this paper. To evaluate the search capacity of the MEAN for large-scale networks, tests will be performed using a real DS with 3860 buses and 632 switches, 509 of which are NC sectionalizing switches and 123 are NO tie-switches. The MEAN is also applied to three other larger networks (including one with 30 880 buses and 5166 switches—4072 NC and 1094 NO). The three largest networks were built so as to assess the behavior of the MEAN in function of the network size. Moreover, additional experiments show the RT required by function, where is the number the MEAN is bounded by a of network buses. Consequently, the MEAN as a tool to treat DSR problems may work well even for networks larger than those used in this paper. The MEAN capacity to improve the quality of solutions is also demonstrated by applying the MEAN to two DSs from the literature and comparing the results with the ones obtained by other approaches [17], [29]–[32]. D. Paper Organization The paper is organized as follows: Section II proposes a mathematical formulation for DSR problems; Section III introduces the NDE; Section IV explains the NDE’s operators; Section V describes the MEAN; Section VI presents the MEAN performance for PLR and SR problems involving large-scale DSs; Section VII highlights relevant aspects of the proposed approach; Appendix A proposes a procedure to perform, in a constant RT (independent of the number of switches), the calculation of the number of switching operations to change from a starting system configuration to a general configuration ; finally, Appendix B presents the MEAN pseudocode. II. MODELING OF THE DSR PROBLEMS A mathematical formulation of DSR problems is presented in this section. Although this formulation can also be used for expansion planning, this paper focuses on PLR and SR problems. The PLR problem consists basically in determining a radial system configuration that minimizes the network power losses without violating the network operational constraints. The SR problem involves the minimization of the number of switching operations and out-of-service loads without violating the network operational constraints. A general formulation of DSR problems is described in [17], which also presents a second formulation assuming an adequate data structure (ADS) to represent each system configuration in the computer. It is important to highlight that problem formulations independent from data structure (from an ADS) can be seen in [10], [18], and [33]. Using an ADS that stores the buses in the TSO and has genetic operators that produce exclusively feasible configurations,
it is possible to write a general formulation of DSR problem as follows:
load flow calculated using an ADS is constructed by ADS operators
(1)
where • is a graph forest corresponding to a system configuration, where each tree of that forest corresponds to a feeder connected to a substation or to out-of-service areas; is the objective function; • represents inequalities describing the network oper• ational constraints; is a diagonal matrix of weights pondering the network • in (1) is the -norm2 of operational constraints, and a vector. contains, in general, one or more of the folFunction lowing components: : number of out-of-service loads in a radial network • topology (forest ); : system power losses for ; • : number of switching operations required to ob• tain a given configuration from a starting configuration . in DSR problems The network operational constraints usually include3: • An upper bound of current magnitude for each line curon line . The highest ratio rent magnitude is called network loading of configuration ; • The maximum current injection magnitude provided by a substation, where means a bus in a substation. The is called substation loading highest ratio of configuration ; be • A lower bound for node voltage magnitude. Let the node voltage magnitude at network bus , and the system base voltage; the lowest ratio is called voltage ratio of configuration . , The vector of nodal complex voltages is given by where is the nodal admittance matrix , where is the incident matrix of , and is the diagonal admittance matrix), and is a vector containing the load complex currents or the injected complex currents (constant) at the buses at the substations . The diagonal matrix is as follows: if otherwise if otherwise if otherwise where the weights
, and
are positive values.
L -norm of a vector z of size n is given by jz j . this paper the operational constraints I (F ) are calculated only for energized areas. 2The 3In
SANTOS et al.: NODE-DEPTH ENCODING AND MULTIOBJECTIVE EVOLUTIONARY ALGORITHM
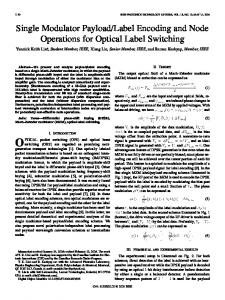
In [17], the GCR was used as an ADS. Instead, the NDE is used in the formulation proposed in this paper. Since NDE’s operators generate only feasible configurations, a specific routine to verify and correct unfeasible configurations is not necessary. This is the first reason for the reduction in the RT due to the use of the NDE and its operators for the treatment of DSR problems. The second reason is the generation of exclusively feasible configurations in relatively low average . Once a feasible configuration is guaranteed, the objective function and the network operational constraints can be analyzed solving a radial load-flow. Analyses of DSR problems usually employ the constant-current model and a single-phase forward-backward SLFA previously sorting the buses in the TSO [10]. With the buses in the TSO, the SLFA calculates the current flows, from terminal buses to the substation, and then the voltages, from substation to the terminal buses. The NDE has the buses naturally arranged in the TSO, which enables a more efficient load-flow calculation that rapidly evaluates each new configuration produced for large-scale DSs, as shown in [34]. This is the third reason for the reduction in the RT obtained with the use of the NDE and its operators for DSR problems. It is important to highlight that the SLFA of MEAN requires, in general, at most three iterations (backward-forward sweeps) to converge. However, test results have shown that the use of only one iteration is sufficient for PLR and SR purposes [35]. Finally, in order to preserve the low time complexity of the MEAN, the calculation of the number of switching operations to from the starting configuration obtain a configuration must be efficiently performed. Appendix A proposes a procedure to execute that calculation always requiring the same RT (independently of the number of switches). III. NODE-DEPTH ENCODING The NDE is a graph tree4 encoding. A graph is a pair , where is a finite set of elements called is a finite set of elements called edges. A DS nodes and can be represented by graphs, as shown in the sequel. A DS can be seen as a set of feeders. Each feeder is composed of one or more sectors.5 The graph in Fig. 1 is a forest with three trees. This graph can be used to represent a DS with three feeders, where nodes are sectors and edges are the sectionalizing switches. The solid lines represent the NC sectionalizing switches and the dashed lines are NO tie-switches. Nodes 1, 2, and 3 in the graph are the root nodes of trees 1, 2, and 3, respectively. These nodes correspond to sectors 1, 2, and 3, which are, respectively, in substations 1, 2, and 3. , where is The NDE uses an array to store all pairs a node and its depth.6 The tree can be represented by an array . The order the pairs are disposed on the array of pairs can be obtained by a depth search algorithm [36], starting from 4A
graph tree is a connected and acyclic subgraph of a graph. sector corresponds to a group of buses and lines without sectionalizing and tie-switches. 6The depth of a node is the length of the unique path from the root of the tree to the node. 5A
1257
Fig. 1. DS with three feeders modeled by a graph with three trees.
Fig. 2. NDE arrays for the trees in Fig. 1.
the root node of the tree. This processing can be executed offline. Fig. 2 presents the NDE arrays for the three trees in Fig. 1. The whole forest is encoded as the union of the NDE arrays of all trees in the forest. In this way, a forest representation can be implemented as an array of pointers, each one pointing to the NDE of a tree. IV. NDE OPERATORS In this section, two NDE’s operators—preserve ancestor operator (PAO) and change ancestor operator (CAO)—are introof a graph duced. Both operators generate a spanning forest7 when they are applied to another spanning forest of . The application of the operators is equivalent to the transferto another tree in the forest. ence of a subtree of a tree The application of PAO maintains the root of the pruned subwhen this subtree is grafted on . On the other tree from hand, CAO changes the root of the transferred subtree. As a result, PAO can produce simple and small changes in the forest, and CAO can generate large and complex alterations. The PAO has two nodes as argument (previously determined): prune node , which indicates the root of the subtree to be transferred; and adjacent node , which is a node in a tree different and also adjacent to in (Fig. 3). The nodes adfrom jacent to can be stored in an adjacent list8 [37]. The CAO requires three nodes as argument: prune node , adjacent node , and the new root node of the subtree. Both operators are now explained, assuming that all the required nodes have been previously determined. References [19], [20], and [38]–[40] detail efficient procedures to choose the arguments of PAO and CAO, as well as to localize, rapidly, any 7A
spanning forest is a set of trees containing all nodes of a graph. the possible connections of each node are included in the adjacent list, i.e., connections that refer to tie-switches as well as sectionalizing switches. Thus, the adjacent list does not change from one configuration to another. 8All
1258
Fig. 3. arrays.
Fig. 4.
IEEE TRANSACTIONS ON POWER SYSTEMS, VOL. 25, NO. 3, AUGUST 2010
T
T
(feeder 1 from Fig. 1), T
Fig. 6.
T
Fig. 7.
T
and its NDE.
(feeder 3 from Fig. 1), and their NDE
and the NDE.
and its NDE.
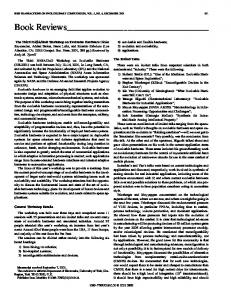
Fig. 8. Subtrees rooted at the nodes of the path from r to p. Fig. 5.
T
and its NDE.
node in the NDE-based forest data structure (without traversing the structure). A. Preserve Ancestor Operator Fig. 1 shows a graph with three trees. In order to illustrate the main steps of PAO, trees and in Fig. 1 (corresponding and , respectively. to feeders 1 and 3) are taken as Fig. 3 shows these trees and their NDE arrays, assuming and . The NDE indices of nodes and are also indicated in Fig. 3. The PAO can then be described by the following steps. – of indices in . Since Step 1) Determine range we know , we only need to find , which is the NDE index of the last node in the subtree rooted at node . Range ( – ) is composed of and the , such that and consecutives in array (dashed lines in Fig. 3), where and are the depths of nodes and , respectively. into a temStep 2) Copy the data in range – from (see Fig. 4). The depth of each porary array node of the range – is updated as follows: . with the nodes of Step 3) Construct an array minus the nodes of (see Fig. 5). Step 4) Create an array with nodes from and , at position of (see Fig. 6). inserting to the new array Step 5) Copy the pointers from array , replacing the pointers to and by the pointers to and , respectively.
Fig. 9. NDE for pruned subtree. Depths are relative to node 17 as an adjacent node.
B. Change Ancestor Operator The CAO is similar to the PAO. The difference between them is in Step 1 (see Section IV-A). For the CAO, Step 1 finds range ( – ), instead of range ( – ) determined for the PAO, where is the NDE index of the last node in the subtree rooted at node (dashed lines in Fig. 7). Before copying the correct range to , the nodes in the range must be resorted. The main steps of the CAO are illustrated by using trees and from Fig. 3. Fig. 7 shows and its NDE, assuming and . to (i.e., Consider the nodes in the path from , where and ) as roots of subtrees. The subtrees rooted at , without the (see Fig. 8), are copied and stored in subtrees rooted at (see Fig. 9) composing a reordered a temporary array is then used to construct (see Fig. 10). range. More details about operators PAO and CAO can be found in [20]. V. MULTIOBJECTIVE EA WITH NDE Evolutionary algorithms are stochastic search algorithms based on principles of natural selection and recombination.
SANTOS et al.: NODE-DEPTH ENCODING AND MULTIOBJECTIVE EVOLUTIONARY ALGORITHM
1259
TABLE I EXAMPLE OF SUBPOPULATION TABLES FOR THE PLR PROBLEM. EACH SUBPOPULATION STORES THE FIVE BEST INDIVIDUALS FOUND
Fig. 10. Tree T
and its NDE.
They have been used to solve difficult problems with objective functions that are multimodal, non-well-behaved continuous or nondifferentiable functions. These algorithms maintain and manipulate a set (called population) of candidate solutions (called individuals) [41]. The individuals are evaluated according to a fitness function (based on the particular criteria that apply to solutions of the problem in hand). Better solutions have a higher probability of being selected to reproduce, generating a new population. The process of constructing a population from another is called generation. After several generations, very fit individuals dominate the current population, increasing the average quality of the generated solutions. An EA does not guarantee a global optimal solution [42]. However, as the literature shows, this technique often finds useful solutions to relatively complex problems. EAs have also shown superior performance to work with multiobjective problems [27]. The MEAN uses a simple and computationally efficient strategy to deal with several objectives. The basic idea is to subdivide a population into subpopulation tables related to different objectives. In addition, one subpopulation table stores individuals assessed by aggregation function [see (2) in Section VI-A]. The MEAN possesses subpopulation tables for the best found individuals with respect to (see Section II): 1) power losses; 2) number of switching operations; 3) network loading; 4) substation loading; 5) voltage ratio; and 6) aggregation function. is included in subpopulaA new generated individual if this table is not full or if is better than the tion table worst solution in , then replacing it. This selection process is performed by procedure ALTER POP() of the pseudocode of the MEAN; see Appendix B. Note that the same individual may be included in more than one subpopulation table as illustrated in Table I. The MEAN requires the following input parameters: is the size of indicating how many individuals can a) be stored in subpopulation table ; b) is the maximum number of individuals generated by the MEAN. It is also used as the stopping criterion; , penalizing the constraints in the aggregation c) Weights, function (see Section II). The selection for reproduction (for application of PAO or . CAO) starts by randomly choosing a subpopulation table is also randomly selected from .A Next, an individual is generated by applying either PAO or CAO new solution
Fig. 11. Best individual found at each iteration according to PLR using operators PAO, CAO, and their interchange.
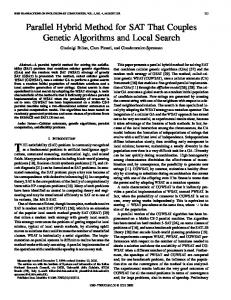
to . This process continues until the total number of individ. uals generated by the MEAN has reached The MEAN choice whether to use CAO or PAO to perform the reproduction is based on a variable adaptation rate. The algorithm starts using the same probability for the application of . Suppose PAO has both operators been chosen. If the generated individual entered at least one increases to 0.51. As a consesubpopulation table, then falls to 0.49. This dynamic adjustment clearly quence, improves the performance of MEAN, as shown in Fig. 11 from Section VI-A. Appendix B synthesizes the steps of the MEAN through Algorithm I. VI. TEST RESULTS This section evaluates the MEAN performance for reconfiguration of large-scale DSs. The experiments aim to show two main properties of the MEAN: 1) The ability to find adequate solutions requiring low RT for large-scale DSs. In this case, the MEAN is used to elaborate SR plans (see Section VI-B); 2) The capacity for improving the quality of solutions for two DSs from the literature and for large-scale DSs. In this case, the MEAN is applied to the PLR problem (see Section VI-C).
1260
IEEE TRANSACTIONS ON POWER SYSTEMS, VOL. 25, NO. 3, AUGUST 2010
First, Section VI-A explains the setup of the MEAN parameters used for the performed experiments. A. MEAN Setup The MEAN parameters , and ’s were chosen using the bisection method [43] for the MEAN applied to Sao Carlos city DS (see Section VI-B) for SR of large out-of-service areas (entire feeders). The bisection method provided the for following parameter values: and for , and if otherwise if otherwise if otherwise
Fig. 12. Best individual from P found by the MEAN at each iteration.
The MEAN is very robust in relation to variations of weights . These values should be high enough to penalize unfeasible solutions, thus, weights varying from 10 to 100 are in general adequate. The aggregation function is described as follows:
(2) where the power losses are in kW, the number of switching is an integer value, , and operations are defined in Section II. We remark that all reconfigurations generated by the MEAN energize all of the out-of-service loads, thus (see Section II) for any configuration . Hereby the following nomenclature is used to identify the subpopulation tables: – individuals with the lowest power losses; – individuals with the lowest voltage ratios; – individuals with the lowest network loadings; – individuals with the lowest substation loadings; – individuals with the lowest values of the aggregation function; – individuals with the lowest power losses and with pairs of switching operations after fault isolation, (the PLR is an indirect way of reducing the voltage ratio, the network loading, and the substation loading). The tests were performed using a microcomputer with a 2.1 GHz processor with 4 Gb of RAM, Linux Operating System–Ubuntu 8.04 version, and gcc as the C language compiler. Finally, a first test using the Sao Carlos DS was provided to evaluate the advantage of using a dynamic adjustment of the ratio of the application of PAO and CAO operators (see Section V). For such a test, no fault was considered. Fig. 11 shows the algorithm convergence, plotting the best individual at each iteration for three cases: 1) the exobtained from clusive use of PAO; 2) the application of only CAO, and 3) the interchange of PAO and CAO using the dynamic adjustment.
Fig. 13. Best individual from P found by the MEAN at each iteration.
B. Service Restoration The MEAN performance for SR is evaluated using the fairly large DS of Sao Carlos city in Brazil with 3860 buses, 532 sectors, 509 NC sectionalizing switches, 123 NO tie-switches, three substations, and 23 feeders. A fault in sector 504 at the largest feeder (with 231 buses and 33 NC sectionalizing switches) interrupts the service for the whole feeder. Then 15 000 evaluations are performed by the MEAN requiring approximately 681 ms. Fig. 12 shows the algorithm convergence, plotting the best individual from (subpopulation table related to power losses) at each iteration. Fig. 13 shows the convergence of the best individual from (subpopulation table related to the aggregation function ) at each iteration. Additionally for that test case, Table II synthesizes the results obtained in the following way: the MEAN was executed 100 trials, then the averages and the standard deviations of values were calculated for objectives and constraints using the best after each run of the MEAN. Moreover, found solution in it is important to highlight that the term Starting Solution (see Table II) is the first feasible configuration obtained after fault isolation. For the fault in sector 504, three switches are required to be open to isolate the fault and two are needed to be closed
SANTOS et al.: NODE-DEPTH ENCODING AND MULTIOBJECTIVE EVOLUTIONARY ALGORITHM
1261
TABLE II AVERAGES AND STANDARD DEVIATIONS FROM 100 TRIALS USING THE BEST SOLUTION FOUND IN P AFTER EACH RUN OF THE MEAN
TABLE IV VALUES OF OBJECTIVES AND CONSTRAINTS OF THE CONFIGURATION BEFORE THE FAULT IN SECTOR 504 AND THE STARTING SOLUTION
TABLE III AVERAGE VALUES OF OBJECTIVES AND CONSTRAINTS OF THE BEST FOUND SOLUTION FROM EACH SUBPOPULATION TABLE
TABLE V AVERAGES AND STANDARD DEVIATIONS FROM 100 TRIALS OF THE MEAN WITH FOR THE SMALLER SYSTEM IN [17] AND [38]
G
= 1500
Table III is the most adequate one, since it is the solution with the smallest number of switching operations that satisfies all and violate the constraints. Observe the solutions from network loading. In this way, the system operator can ponder relevant operational aspects in order to choose a solution that best fit practical requirements. C. Power Loss Reduction
to restore two out-of-service areas. Thus, the Starting Solution requires five switching operations. Table III shows the values of the objectives and constraints of the best found solution from each subpopulation table over 100 trials for the fault at Sector 504 (the best, average, and worst solutions). The best average for each constraint or objective is highlighted using bold fonts. Table IV highlights the DS characteristics according to: 1) the configuration before the fault at sector 504; and 2) the Starting Solution. As the number of manually controlled switches used in DSs is usually larger than the number of automatic control switches, an adequate configuration for SR must have a low number of in switching operations. In this sense, the solution from
The analysis for the PLR problem is organized in this section into two parts: the comparison to other approaches applied to DSs available in the literature, and the performance of the MEAN for large-scale DSs. In this section, it will be addressed (subpopulation table related to power the best solutions from losses). 1) Comparison With Other Approaches: Two DSs from the literature have been utilized in tests for PLR. The first one is composed of 93 buses, 25 sectors, 31 switches (17 NC and 14 NO), and eight feeders [17], [44]. The Starting Solution, as well as the average and standard deviation of the best solutions found by the MEAN, are presented in Table V. As the standard deviation is zero, the MEAN finds the same solution in all trials, which is the global optimum solution according to [44]. The second DS consists of 83 buses, 96 switches (83 NC and 13 NO), and 11 feeders. It corresponds to the DS of Taiwan Power Company and has been utilized in several researches [29]–[32] as a test system. The Starting Solution, as well as the average and standard deviation of the best solutions found by the MEAN, are presented in Table VI. Other works present 469.88 kW as the minimal amount of power losses found with 18 switching operations. The same solution has been found by the MEAN in several of the trials. The largest difference in the results found by the approaches [29]–[32] is the RT. While the MEAN has found the solution in 0.015 s (using a Pentium IV 2.1 GHz), the other methods have
1262
IEEE TRANSACTIONS ON POWER SYSTEMS, VOL. 25, NO. 3, AUGUST 2010
TABLE VI AVERAGES AND STANDARD DEVIATIONS FROM 100 TRIALS OF THE MEAN FOR THE TAIWAN POWER COMPANY DS WITH
G
= 1500
f(n) = 0:009013519pn
Fig. 14. RT of the MEAN for large-scale networks of different sizes and the . superior bounding
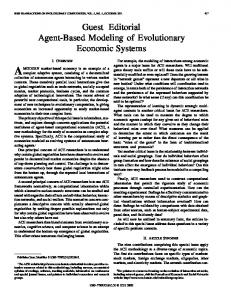
required from 36.15 s (with a Pentium II 0.27 GHz) to 303.66 s (with a Pentium IV 1.3 GHz) [29]–[32]. D. Results With DSs of Several Sizes To analyze how the MEAN behaves with the increase in the network size, the real Sao Carlos city DS (herein called System 1) was used to compose other DSs with size varying from two to eight times the original DS. System 2 is composed of two Systems 1 interconnected by 13 NO new additional switches. System 3 is composed of four Systems 1 interconnected by 49 NO new additional switches. Finally, System 4 is composed of eight Systems 1 interconnected by 110 NO new additional switches (the data of the four DSs are available in [45]). These DSs have the following general characteristics: System 1: 3860 buses, 532 sectors, 632 switches (509 NC and 123 NO switches), three substations, and 23 feeders; System 2: 7720 buses, 1064 sectors, 1277 switches (1018 NC and 259 NO switches), six substations, and 46 feeders; System 3: 15 440 buses, 2128 sectors, 2577 switches (2036 NC and 541 NO switches), 12 substations, and 92 feeders; System 4: 30 880 buses, 4256 sectors, 5166 switches (4072 NC and 1094 NO switches), 24 substations, and 184 feeders. Fig. 14 shows the RT required to generate 10 000 new configurations for Systems 1, 2, 3, and 4. The RT required by the MEAN for those systems is bounded by a function, where is the number of network buses and is a positive constant.
TABLE VII PLR AND RT FROM 100 TRIALS OF THE MEAN USING DIFFERENT NUMBER OF EVALUATIONS FOR THE FOUR LARGE-SCALE DSS
The RT behavior based on a function indicates that the MEAN can quickly find adequate configurations for DSR problems in networks with much more than 30 880 buses and 5166 switches. Table VII shows the values of PLR and RT of 100 trials for Systems 1, 2, 3, and 4 when the MEAN is required to evaluate different numbers of configurations: 10 000, 100 000, 400 000, 800 000, and 1 000 000. For 10 000 evaluations, the PLR decreased in function of the system size as the number of possible configurations for larger systems scales exponentially. For the largest networks, there are so many feasible configurations that it becomes difficult to find the best one performing only 10 000 evaluations, and the MEAN achieves a PLR of only 6.71% (average of 100 trials) for the largest network. From 100 000 to 1 000 000 evaluations, the PLR significantly increases, reaching, with 1 000 000 evaluations, 27.64% of PLR in average for the largest network, meaning that systems with a higher number of switches have a larger number of possible feasible configurations. In other words, the systems with a higher number of switches can have better configurations than the ones with few switches. Finding more adequate configurations for very large networks is hard, since the space of feasible configurations is huge. Thus, the modeling of a network considering all the buses and switches of a real DS provides a search space that can have better configurations than when using simplified models. Although it is hard to find the most adequate configurations in this space, the MEAN has shown to be able to find those configurations, even for very large DSs. VII. CONCLUSION This paper presented a multiobjective evolutionary algorithm using the node-depth encoding (MEAN) to solve DSR problems for large-scale networks (with thousands of buses and switches). To date, the available computer methods to solve DSR problems can properly work with systems having at most some hundreds
SANTOS et al.: NODE-DEPTH ENCODING AND MULTIOBJECTIVE EVOLUTIONARY ALGORITHM
of buses and switches. Moreover, the MEAN can deal with several objectives (e.g., power losses and number of switching operations) and constraints (regarding feasibility of configurations and operational limits). Simulation results have shown that the MEAN is able to find adequate SR plans for a real DS with 3860 buses and 632 switches in a RT of 0.681 s. These simulations were carried out using a real DS without any simplification (representing all the buses, switches, lines, and loads). The MEAN was tested for two DSs from the literature for performance-comparison purposes in terms of PLR. For both DSs, the MEAN found the best known solutions from the literature requiring lower RT; in fact, it was hundreds of times faster than the approaches from [29]–[32]. In addition, the MEAN RT increases sublinearly with the netfunction work size. More precisely, the RT is bounded by a (where is the number of network bus and is a positive constant). This result indicates that the MEAN can quickly find adequate solutions to even much larger networks (with more than 5166 switches). Moreover, the MEAN shows that it is possible to achieve a very large PLR of almost 30% for large-scale networks (with thousands of switches). On the other hand, for smaller networks (hundreds of switches), the PLR is close to 15% even performing an intensive exploration of the search space (1 000 000 evaluations). This result indicates that systems with a larger number of switches may have more adequate configurations, although reaching them is computationally hard. The MEAN makes this problem softer. APPENDIX A SWITCHING OPERATIONS In order to isolate the sectors in fault and reconnect the healthy sectors in the out-of-service area to any feeder, some switching operations are required. From this first configuration on, PAO and CAO will produce always two switching operations by configuration, i.e., when one switch is open, another switch must be closed. To determine the switching operations number to produce one new configuration, consider the switching status in three con, changed figurations: configuration of the Starting Solution configuration , and final configuration . In this way, considering that configuration was generated from configuration by changing the status of switches and , we have three possibilities to compute the switching operation number for configuration from configuration : 1) Both switch status that changed in , in relation to , are different in and ). In this case, will be (the switching operation number for configuration from configuration ) plus 2; 2) Both switch status that changed in , in relation to , are equal in and ), then: ; 3) The changed status of one switch in , in relation to , is the same in , and the other changed status is different ( and or and ), then: . from conAlgorithm I shows a pseudo-code to determine figuration .
1263
Algorithm I. Pseudo-code to calculate switching operations number SWITCHING() UNTIL
FOR IF
, DO:
and
//case 1
switching number y:= switching number and
IF
;
//case 2
switching number y:= switching number and
IF
switching number
;
//case 3 switching number ;
END APPENDIX B PSEUDOCODE OF THE MEAN Algorithm II. Pseudocode of the MEAN ALGORITHM MEAN // start the generation counter ; // generate initial subpopulations original spanning tree INITIAL POP
based on the ;
// evaluate the individuals of the initial subpopulations ;
EVALUATE
)
// test for termination criterion (a generation WHILE stop criterion is not reached DO // stochastically select a subpopulation STOCHASTICALLY-SELECT(pop); // stochastically select an individual subpopulation STOCHASTICALLY-SELECT
in the ;
// decide by PAO or CAO OP := DECIDE OPERATOR(PAO, CAO); // apply OP to produce a new individual OP
from
;
// evaluate the new individual EVALUATE
;
// deterministically select the survivors from ALTER POP // increase the generation counter ; END
;
and
1264
IEEE TRANSACTIONS ON POWER SYSTEMS, VOL. 25, NO. 3, AUGUST 2010
REFERENCES [1] A. Merlin and G. Back, “Search for minimum-loss operational spanning tree configuration for an urban power distribution system,” in Proc. 5th Power System Conf. (PSCC), Cambridge, U.K., 1975, pp. 1–18. [2] K. Aoki et al., “Outage state optimal load allocation by automatic sectionalizing switches operation in distribution systems,” IEEE Trans. Power Del., vol. 2, no. 4, pp. 1177–1185, Oct. 1987. [3] K. Aoki et al., “Voltage drop constrained restoration of supply by switch operation in distribution systems,” IEEE Trans. Power Del., vol. 3, no. 3, pp. 1267–1274, Jul. 1988. [4] K. Aoki et al., “A new algorithm for service restoration in distribution systems,” IEEE Trans. Power Del., vol. 4, no. 3, pp. 1832–1839, Jul. 1989. [5] A. L. Morelato and A. Monticelli, “Heuristic search approach to distribution system restoration,” IEEE Trans. Power Del., vol. 4, no. 4, pp. 2235–2241, Oct. 1989. [6] J. S. Wu, K. L. Tomsovic, and C. S. Chen, “A heuristic search approach to feeder switching operations for overload, faults, unbalanced flow and maintenance,” IEEE Trans. Power Del., vol. 6, no. 4, pp. 1579–1585, Oct. 1991. [7] C. C. Liu et al., “An expert system operational aid for restoration and loss reduction of distribution systems,” IEEE Trans. Power Syst., vol. 3, no. 2, pp. 619–626, May 1988. [8] C. E. Lin et al., “A distribution system outage dispatch by data base method with real-time revision,” IEEE Trans. Power Del., vol. 4, no. 1, pp. 515–523, Jan. 1989. [9] C. Y. Teo, “A computer aided system to automate the restoration of electrical power supply,” Elect. Power Syst. Res., vol. 24, no. 2, pp. 119–125, 1992. [10] S. Toune et al., “Comparative study of modern heuristic algorithms of service restoration in distribution systems,” IEEE Trans. Power Del., vol. 17, no. 1, pp. 173–181, Jan. 2002. [11] T. Nagata, H. Sasaki, and M. Kitagawa, “A method of determining target configuration for power systems restoration by means of mix integer programming approach,” Trans. IEE Jpn., vol. 114-B, no. 2, pp. 179–185, 1994. [12] K. Nara, A. Shiose, M. Kitagawa, and T. Ishihara, “Implementation of genetic algorithm for distribution systems loss minimum reconfiguration,” IEEE Trans. Power Syst., vol. 7, no. 3, pp. 1044–1051, Aug. 1992. [13] Y. Fukuyama, H.-D. Chiang, and K. N. Miu, “Parallel genetic algorithm for service restoration in electric power distribution systems,” Elect. Power Energy Syst., vol. 18, pp. 111–119, 1996. [14] A. Augugliaro, L. Dusonchet, and E. R. Sanseverino, “Multiobjective service restoration in distribution networks using an evolutionary approach and fuzzy sets,” Elect. Power Energy Syst., vol. 22, pp. 103–110, 2000. [15] J. Z. Zhu, “Optimal reconfiguration of electrical distribution network using the refined genetic algorithm,” Elect. Power Syst. Res., vol. 2, pp. 37–42, 2002. [16] Y. Y. Hong and S. Y. Ho, “Determination of network configuration considering multiobjective in distribution systems using genetic algorithms,” IEEE Trans. Power Syst., vol. 20, no. 2, pp. 1062–1069, May 2005. [17] A. C. B. Delbem, A. C. P. L. F. Carvalho, and N. G. Bretas, “Main chain representation for evolutionary algorithms applied to distribution system reconfiguration,” IEEE Trans. Power Syst., vol. 20, no. 1, pp. 425–436, Feb. 2005. [18] E. M. Carreno;, R. Romero, and A. Padilha-Feltrin, “An efficient codification to solve distribution network reconfiguration for loss reduction problem,” IEEE Trans. Power Syst., vol. 23, no. 4, pp. 1542–1551, Nov. 2008. [19] A. C. B. Delbem and A. C. P. L. F. Carvalho, “A forest representation for evolutionary algorithms applied to network design,” in Proc. Genetic and Evolutionary Computation Conf.—GECCO, 2003. [20] A. C. B. Delbem, A. C. P. L. F. Carvalho, C. A. Policastro, A. K. O. Pinto, K. Honda, and A. C. Garcia, “Node-depth encoding for evolutionary algorithms applied to network design,” in Proc. 6th Genetic and Evolutionary Computation Conf.—GECCO, 2004, pp. 678–687, Part I. [21] T. H. Cormen, C. E. Leiserson, R. L. Rivest, and C. Stein, Introduction to Algorithms. Cambridge, MA: MIT Press and McGraw-Hill, 2001. [22] G. R. Raidl and B. A. Julstrom, “Edge sets: An effective evolutionary coding of spanning trees,” IEEE Trans. Evol. Comput., vol. 7, no. 3, pp. 225–239, Jun. 2003.
[23] D. Shirmohammadi, H. W. Hong, A. Semlyen, and G. X. A. Luo, “A compensation-based power flow method for weakly meshed distribution and transmission networks,” IEEE Trans. Power Syst., vol. 3, no. 2, pp. 753–762, May 1988. [24] D. Das, H. S. Nagi, and D. P. Kothari, “Novel method for solving radial distribution networks,” Proc. Inst. Elect. Eng., Gen., Transm., Distrib., vol. 141, no. 4, pp. 291–298, Jul. 1994. [25] M. H. Haque, “Efficient load flow method for distribution systems with radial or mesh configuration,” Proc. Inst. Elect. Eng., Gen., Transm., Distrib., vol. 143, no. 1, pp. 33–38, Jan. 1996. [26] M. S. Srinivas, “Distribution load flows: A brief review,” in Proc. IEEE Power Eng. Soc. Winter Meeting, 2000. [27] K. Deb, Multi-Objective Optimization Using Evolutionary Algorithms. Chichester, U.K.: Wiley, 2001. [28] H. Ishibuchi, Y. Sakane, N. Tsukamoto, and Y. Nojima, “Adaptation of scalarizing functions in MOEA/D: An adaptive scalarizing function-based multiobjective evolutionary algorithm,” in Proc. 5th Int. Conf. Evolutionary Multi-Criterion Optimization (Nantes, France, Apr. 7–10, 2009), Lecture Notes In Computer Science, Springer-Verlag, Berlin, Germany, 2009, vol. 5467, pp. 438–452. [29] C. Wang and H. Z. Cheng, “Optimization of network configuration in large distribution systems using plant growth simulation algorithm,” IEEE Trans. Power Syst., vol. 23, no. 1, pp. 119–126, Feb. 2008. [30] C. T. Su and C. S. Lee, “Network reconfiguration of distribution systems using improved mixed-integer hybrid differential evolution,” IEEE Trans. Power Del., vol. 18, no. 3, pp. 1022–1027, Jul. 2003. [31] C.-T. Su, C.-F. Chang, and J.-P. Chiou, “Distribution network reconfiguration for loss reduction by ant colony search algorithm,” Elect. Power Syst. Res., vol. 75, pp. 190–199, Aug. 2005. [32] H. C. Cheng and C. C. Kou, “Network reconfiguration in distribution systems using simulated annealing,” Elect. Power Syst. Res., vol. 29, pp. 227–238, May 1994. [33] J. Mendoza et al., “Minimal loss reconfiguration using genetic algorithms with restricted population and addressed operators: Real application,” IEEE Trans. Power Syst., vol. 21, no. 2, pp. 948–954, May 2006. [34] A. C. Santos, M. Nanni, M. R. Mansour, A. C. B. Delbem, J. B. A. London, Jr., and N. G. Bretas, “A power flow method computationally efficient for large-scale distribution systems,” in Proc. 2008 IEEE PES Latin America Transmission and Distribution Conf. Expo., Bogota, Colombia, 2008. [35] A. C. Santos, “Evolutionary Algorithm Computationally Efficient for Distribution System Reconfiguration,” (in Portuguese) Thesis of Doctorate, Engineering School of Sao Carlos, Univ. Sao Paulo, Sao Carlos, Sao Paulo, Brazil, 2009. [36] T. H. Cormem, C. E. Leiserson, R. L. Rivest, and C. Stein, Introduction to Algorithms. Cambridge, MA: MIT Press/McGraw-Hill, 1990. [37] R. K. Ahuja, T. L. Magnanti, and J. B. Orlin, Network Flows: Theory, Algorithms, and Applications. Englewood Cliffs, NJ: Prentice-Hall, 1993. [38] G. L. Libralao, T. W. Lima, K. Honda, and A. C. B. Delbem, “NodeDepth encoding for directed graphs,” in Proc. IEEE Congr. Evolutionary Computation–CEC 2005, Edinburgh, U.K., 2005. [39] G. L. Libralao, F. C. Pereira, T. W. Lima, and A. C. B. Delbem, “Node-depth encoding for evolutionary algorithms applied to multi-vehicle routing problem,” in Proc. Innovations in Applied Artificial Intelligence, 2005, vol. 3533, pp. 557–559. [40] T. W. Lima, F. Rothlauf, and A. C. B. Delbem, “The nodedepth encoding: Analysis and application to the bounded-diameter minimum spanning tree problem,” in Proc. 10th Annu. Conf. Genetic and Evolutionary Computation–GECCO’08, Atlanta, GA, ACM, 2008. [41] K. A. De Jong, Evolutionary Computation: A Unified Approach. Cambridge, MA: MIT Press, 2006. [42] H. L. Willis, H. Tram, M. V. Engel, and L. Finley, “Selecting and applying distribution optimization methods,” IEEE Comput. Appl. Power, vol. 9, no. 1, pp. 12–17, Jan. 1996. [43] R. L. Burden and J. D. Faires, Numerical Analysis. Pacific Grove, CA: Brooks/Cole, 2000. [44] N. Kagan, “Distribution Network Reconfiguration Using Genetic Algorithms and Fuzzy Decision Maker,” (in Portuguese) Ph.D. dissertation, University of Sao Paulo, Sao Paulo, Brazil, 1999. [45] Source Project, 2009. [Online]. Available: http://lcr.icmc.usp.br/colab/ browser/Projetos/MEAN.
SANTOS et al.: NODE-DEPTH ENCODING AND MULTIOBJECTIVE EVOLUTIONARY ALGORITHM
1265
A. C. Santos received the B.Sc. degree in electrical engineering from the Federal University of Mato Grosso, Cuiaba, Brazil in 2001 and the M.Sc. degree and the Ph.D. degree in electrical engineering from the University of Sao Paulo, Sao Paulo, Brazil, in 2004 and 2009, respectively. He is a Professor with the Federal Institute of Education, Science and Technology of Tocantins, Palmas, Brazil, since 2003. His research interest areas are network design, graphs, evolutionary algorithms, distribution system reconfiguration, and multicriteria problems.
J. B. A. London, Jr. (S’97–M’02) received the B.S.E.E. degree from the Federal University of Mato Grosso, Cuiaba, Brazil, in 1994, the M.S.E.E. degree from E.E.S.C.–University of Sao Paulo, Sao Paulo, Brazil, in 1997, and the Ph.D. degree from E.P.–University of Sao Paulo in 2000, both in electrical engineering. Now he is working as an Assistant Professor at the E.E.S.C.–University of Sao Paulo. His main areas of interest are power system state estimation, network reconfiguration, and application of sparsity techniques to power system analysis.
A. C. B. Delbem received the Ph.D. degree from the University of Sao Paulo, Sao Paulo, Brazil, in 2002. He became an Assistant Professor in 2003 and an Associate Professor in 2009 with the University of Sao Paulo. He researches efficiency in solutions for real-world problems involving large-scale, multicriteria, and real-time. The main areas of application are power system, scheduling, bioinformatics, and data structures.
N. G. Bretas received the Ph.D. degree from the University of Missouri, Columbia, in 1981. He became a Full Professor with the University of Sao Paulo, Sao Paulo, Brazil, in 1989. His work has been concerned with power system analysis, transient stability using direct methods, power system state estimation, and energy restoration for distribution systems.