Studies in Informatics and Control, 26(4) 397-402, December 2017
ISSN: 1220-1766 eISSN: 1841-429X
397
Node Seniority Ranking in Networks Vincenzo FIORITI1*, Marta CHINNICI2 1 ENEA-Qualification of Materials and Components Laboratory, C.R Casaccia Via Anguillarese 301, ROMA 00123, Italy
[email protected] (*Corresponding author) 2 ENEA- Energy Technologies Department, ICT Division, C.R Casaccia Via Anguillarese 301, ROMA 00123, Italy
[email protected] Abstract: Current advances in graph theory suggest that it may be possible to identify the oldest nodes of a network by using the graph topology alone. In this paper, applications of graph topology related to various real-world systems are reported. To this end, and to gain new insights, we propose the theoretical framework of the Estrada communicability index to real complex networks. We apply this framework to two technological networks (an underground and the diffusion of a software worm in a LAN) and for a third network representing a cholera outbreak. In spite of errors introduced in the adjacency matrix of the networks graphs, the identification of the oldest nodes is feasible and incredibly simple. Utilizations include the search of the first disease-spreader (patient zero problems), rumors in social networks, malware in computer nets, triggering events in blackouts, oldest urban sites recognition. Keywords: Graph Theory, Networks, Probability, Infrastructures, Malware.
1. Introduction Is it feasible to classify nodes according to their age without performing measurements? Until a few years ago, an affirmative answer would be puzzling due to the predictability of network structure. Nevertheless, recently the authors in [16] have shown how to trace the oldest node sources of an evolving graph, using only the eigenvalues and eigenvectors of the Laplacian matrix. This identification issue is to be regarded as a complex one, but the advantages to be gained in many fields of science are so relevant to justify the efforts of many researchers [6], [7], [1]. The interest of this inverse problem lies in a variety of applications such as in IT security, computer science, medicine, pharmacology, archaeology, finance, engineering, biology, but till a few years ago solutions were not foreseen. In this work, we show that it is possible to identify the oldest nodes both of heterogeneous real world technological networks and of an epidemic spreading graph, namely: the Paris’ underground (during the period 1900-1949), the diffusion of a software worm in a computer LAN, a cholera outbreak. Moreover, we suggest a necessary condition to recognise the networks suitable for the age analysis and a rough estimator of the algorithm performance. In [12], Pinto has developed a procedure to estimate the location of the epidemic source from measurements collected by sparsely placed observers using a maximum probability estimator. Each monitor (about 20% of the nodes were followed) measures from which neighbour and at what time has received the contagion. The https://doi.org/10.24846/v26i4y201703
collected data are used to produce the estimate, whose complexity is O(N3), with N that represents the number of nodes. Results of the validation test on the Kwa Zulu cholera outbreak in South Africa in 2000 show the estimation error are below four hops. In this paper, we consider the “patient zero” as the oldest node of the cholera outbreak graph. Thus, we see no difference among the three different networks, and consequently, we can apply the same methodology. The authors in [16] instead have developed a deterministic spectral strategy based only on the topology of the network. De facto, the authors solving an inverse problem and at the same computational cost O(N3), applying this method to the Santa Fe Institute (SFI) co-authorship social network [8] and the protein-protein interaction network. In this paper, we investigate the growth over time of graphs, identifying the source nodes that started the growth on a real topological basis. The primary goal of this work is to study some heterogeneous prototypical real-world networks to provide tools for practical applications. We emphasise that the age of nodes, except for the previously mentioned literature, was not investigated adequately. Above all, the analysis of real networks was neglected. Thus, our paper tries to fill the gap. The graph (the mathematical counterpart network, but the two words are almost equivalent) to be analysed results from a growth intended as an evolution over time, generally depending on ICI Bucharest © Copyright 2012-2017. All rights reserved
398
Vincenzo Fioriti, Marta Chinnici
stable, non-stochastic, “smooth“ transformations. When its topology is known, the authors in [16] claim that the eigenvalue spectrum of the connectivity matrix or preferably of the Laplacian matrix is related closely to the age of nodes. The correlation between eigenvalues and age is strictly required; moreover, if no evolutionary process was developed in the past, the method is not applicable. The correlation is evident in the case of the graphs that follow the preferential attachment rule (“rich get richer”) because the probability for a node to acquire new links is proportional to its degree. Therefore, a high correlation between the node degree and its lifetime is sure, but real world networks are much more complicated [15], [10]. For a given eigenvalue, the time frame of the associated eigenvector is the average age of all nodes contained in the vector, weighted by the respective components of the eigenvector.
2. Methodology The first step of our methodological framework is based on the Laplacian matrix, L = D – A,
(1)
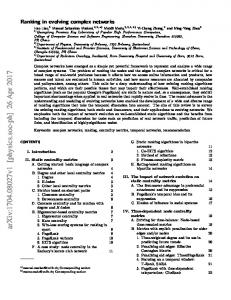
where D is the degree diagonal matrix and A the adjacency matrix (aij = 1 if the link i-j exists and 0 otherwise). The second step is represented by the standardisation of each eigenvector components: vi = | vi / max (vi) |, with i = 1, 2, ... N. The third step is represented by the seniority ranking. Nodes with standardised component values larger than a threshold are clustered in a particular age subset and related to the associated eigenvalues. Thus the largest eigenvalues are associated with the oldest node and so on. This method, tested on the Santa Fe Institute co-authorship of the scientific papers social network [8], can classify the age of nodes [16] altogether, see Figure 1. For example, the first three larger eigenvalues of the Laplacian, related to the nodes corresponding to the eigenvectors selected by the thresholding procedure, indicate the three oldest nodes of the network of figure 1 and figure 2: λ76>λ75>λ74 ↔ 40, 7, 67 where 40 is the oldest node, and the λN>λN-1 > … >λ1 is the descending eigenvalue spectrum. The procedure presented in [16] is due to the observation that the eigenvector size in networks, such as the protein-protein interactions, do not seem to increase, while the corresponding (according to the threshold procedure) eigenvalue does. No suggestions about the characteristics of evolving networks suitable to be age-analysed or how to http://www.sic.ici.ro
choose the threshold’s value are given. Hence, we note that it has been discovered [9] in many social networks how a significant non-random graph is changing over time results in a continuous variation of the adjacency matrix eigenvalues, while the eigenvectors stay (relatively) constant. Therefore, the correlation between the node ages and the largest eigenvalues comes as a direct consequence. Although authors of [9] apparently were not aware of the relation eigenspectrumage, they sketch a demonstration for a necessary condition on the eigenvectors, which we consider a sound approach to explain the age – eigenvalue correlation, as follows. The procedure starts from the standard eigenvalue decomposition of a graph: A(ti) = V(ti) Λ(ti) V(ti)’
(2)
with, i = 0, 1, 2, …, N. In (2), A is the adjacency matrix, V the eigenvectors matrix, V’ its transpose, Λ the eigenvalues matrix, at time ti . If the eigenvectors remain constant, it possible to write: A(ti+1) ≈ V(ti) Λ(ti+1) V(ti)’
(3)
with Λ(ti+1) = Δ’(A, V, Λ) + Λ(ti)
(4)
Since V has orthogonal columns, we can compute the best fit of Δ in a least-squares sense, Δ’(A, V , Λ) ≈ V(ti)(A(ti+1) – A(ti)) V(ti)’
(5)
Now the calculation requires Δ’ to be diagonal any deviation from this condition indicates a difference from the type of graph evolution over time required, deteriorating the age evaluation. The diagonality condition may be relaxed to a diagonal dominance. A note of caution: for random graphs, such as Erdos-Renyi graphs, eigenvectors increase faster than eigenvalues [7], hence in this case the age analysis is unfeasible. The next step consists of introducing our alternative procedure. We have noted that: A(ti+1) ≈ V(ti) Λ(ti+1) V(ti)’
(6)
Hence, tr(e A(ti+1)) = tr(V(ti)e Λ(ti+1)V(ti)’) = = Σj eλj
(7)
with λj=λj(ti+1). If eigenvectors stay almost constants, most of the variation of the trace from time ti to ti+1 depends on from the eigenvalues;
Node Seniority Ranking in Networks
399
in particular, each node i contributes with the quantity SCi = Σj (vij)2eλj, where λj=λj(ti+1) and vij denote the i-th component of the eigenvector vj. The SCi parameter [8] called subgraph centrality, is closely related to the communicability index ECI defined [11] as: ECI = eA ,
(8)
where i = j determines the diagonal entries of ECI matrix that are the SCi values, while for i≠j the communicability between node i and node j is presented. Now, the larger the ECIii value, the older the corresponding node i. Sorting the diagonal entries of the ECI matrix is possible to recover at the same time the node number and its age-rank. Note as SCi may be regarded as a self-communicability index [3], so we expect similar capabilities for both parameters. A probabilistic interpretation may also be given: SCi is proportional to the probability of a random walker passing close to node i. The Estrada indexes communicability and sub-graph centrality take into account not only the immediate effects of the closest nodes but also the long-range effects transmitted through the participation of a node in all sub-graphs [5], [6], [3] travelling along all the paths available. For this reason, ECI and SC can retain the information about the oldest nodes through many sub-graphs, during the time evolution. Since many significant results have been established about the spectrum of the adjacency matrix [12], it would be useful to use the adjacency matrix instead of the Laplacian, without losing insights about the node ages. For example, the spectrum of the adjacency matrix eigenvalues has been utilised in the last years to reveal the most vulnerable nodes to the epidemic spreading of viruses and malware [13].
Figura 1. Santa Fe Institute co–authorship collaboration network. Nodes represent authors of scientific papers related to the Santa Fe Institute. Nodes 40, 7, 67 (blue, at the centre of the major hubs) are the first, second and third oldest node, respectively
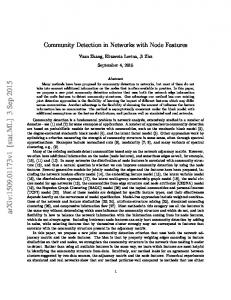
Figura 2. ECI classifies the oldest nodes of the Santa Fe Institute co-authorship collaboration network. On the abscissa are the node numbers, on the ordinate the ECI values; node 7 and node 40 have both an ECI value about 120 that is the maximum value. Therefore they are the first two oldest nodes. ECI classifies correctly the first two (40, 7) out of three (40, 7, 67) oldest nodes, but fails to node 67, mistaken with node 24. Note in the red dotted circle a group of coetaneous nodes
3.
Node seniority algorithms’ Application & Results
3.1 Application: Using benchmarks to validate ECI procedure A unified procedure based on the eigenspectrum would be elegant, theoretically sound and could be set in the larger framework of the graph entropy, the quantum mechanics, the non-linear oscillators [4], [3]. Then what are the advantages and drawbacks of the ECI procedure compared to the Zhu at al. [16] algorithm? From an algorithmic point of view, the Estrada communicability is simpler: does not need thresholds and the information on the nodes are quickly recovered as the diagonal entries of the ECI matrix. On the other hand, the Zhu at al. algorithm is certainly more accurate and usually slow, unless particular parallelization techniques are used. Thus, when precision for all nodes is needed, we suggest resorting to the methods introduced by Zhu at al. Otherwise, the ECI may be considered, according to circumstances. To validate the ECI procedure against benchmarks before the actual use, we have selected the social network of the Santa Fe Institute scientific co-authorship collaborations [16], [8], some artificial Barabasi-Albert graphs [10] and the cholera Kwa Zulu outbreak [12]. The Santa Fe Institute collaboration example shows that our ECI procedure recovers exactly the first two nodes (40, 7) out of the three (40, 7, 67) oldest, as follows: 40 125.19 ECI, 7 123.78 ECI, 24 55.75 ECI. The Zhu at al. algorithm [16] in this example can calculate exactly the seniority for all ICI Bucharest © Copyright 2012-2017. All rights reserved
400
Vincenzo Fioriti, Marta Chinnici
nodes, taking full advantage from the Laplacian matrix and therefore is more accurate. However, we point out that our interest is limited to the first oldest nodes. Another benchmark is the BarabasiAlbert graph (B-A) for 1000, 2500, 10000 nodes. Locating the sources of this kind of graph is easy because of the preferential attachment rule sets a high correlation with the degree [1]. The ECI procedure, in fact, finds the four sources (nodes 1, 2, 3, 4) within the first six positions of the calculated ranking (2, 4, 1, 21, 17, 3), adding two false positive nodes, 21 and 17. While better results with a B-A graph for 2500 nodes is: the four sources (nodes 1, 2, 3, 4) are the first five positions of the ranking (4, 6, 3, 2, 1) adding as a false positive only node 6. Finally, for a B-A graph of 10000 nodes, we obtain all the sources (2, 3, 1, 4) with no errors. Then we can conclude that the ECI method is less accurate concerning the Zhu at al. algorithm, nevertheless provides good performance for the very oldest nodes.
newer structures were superimposed to the first ones causing noise to the algorithm. Hence, this test is rather challenging, as always when the network is a real one. Moreover, some important stations have been discarded producing an extra amount of noise. To verify further the effect of deleting nodes, we eliminate the last seven 63-70 (four of them 64, 65, 69, 70 are inside the ring). ECI captures the five actual oldest nodes 1, 16, 31, 27, 3 exactly. However, what happens if some of the oldest nodes disappear from the graph? Eliminating the first seven nodes 1-7 (remember 1 and 3 are among the oldest five), ECI captures 16, 31, 64 out of the remaining 16, 31, 27. Thus, only the node 64 is mistaken as false positive. This last result is particularly important because it demonstrates a negative growth (e.g. some of the oldest nodes disappearing at the end of the evolution of the graph) does not damage the age identification unduly.
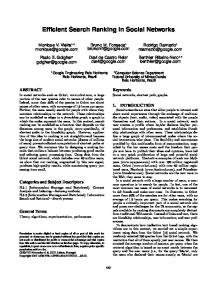
3.2. Results An important question to consider is whether the node seniority algorithms are robust to errors occurring in the adjacency matrix, i.e. nodes/links missing or wrongly added. In fact, very often when investigating the real world phenomena, one is compelled to face incomplete information about the topology of the network and the reliability of the algorithm becomes a major issue. Therefore, it may be convenient to stop the analysis at the very first oldest nodes, let’s say 10% of the total amount. Having validated the ECI procedure it is possible to apply this method to networks: the underground of Paris, a computer network and the contact graph obtained from the cholera outbreak of Kwa Zulu [12]. We stress that from the theoretical approach described before there is no difference between the mentioned networks. The Paris underground during the period 19001949 is shown in Figure 3. It can be seen a sort of ring surrounding the downtown city with the first 1900 − 1910 underground stations. The graph has been produced considering only the most important stations and the final destinations as actual nodes see Figure 4. The task, to identify the five oldest nodes (period 1900 − 1906) located inside the ring, is made harder by some young nodes and links added inside the ring during the period 1939 – 1949, see Figure 4. The five oldest nodes are captured by ECI method within the first eight (bold): 1, 64, 24, 3, 30, 31, 16, 27. After the 1910 many new lines were connected to the 19001910 nodes, disturbing the original topology; the http://www.sic.ici.ro
Figura 3. The network of Paris’underground. The green line is the older, and inside the green ring, there are the very first stations dating back to the years 1900-1906 (black circles)
Figura 4. Main underground stations are represented in the graph. The green nodes belong to the 19001910 line. The oldest nodes (1, 3, 16, 27, 31) in the ring have been identified correctly (circle). Brown nodes are the 1939-1949 stations: most of them are the ends of lines, but 64 and 65 are inside the ring (black arrows). The total number of nodes is 70
In the case of the cholera outbreak [12], we consider the actual source, node 87, as the oldest because it developed the epidemic diffusion. The
401
Node Seniority Ranking in Networks
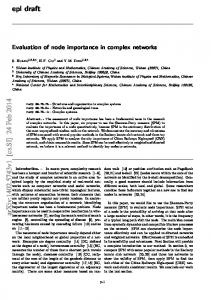
event of the cholera outbreak of Pinto shows that his probabilistic algorithm is accurate within less than four hops. Considering only three hops, to have an exhaustive search fifteen nodes should be taken into account (82, 83, 84, 85, 86, 88, 89, 90, 92, 99, 100, 101, 102, 103, 205). On the other hand, the ECI algorithm captures node 87 as the 14th in the calculated seniority ranking (68, 20, 140, 18, 121, 124, 67, 196, 28, 27, 133, 197, 24, 87). Hence, the performances are similar. However, the probabilistic algorithm of Pinto must monitor about the 20% of the nodes. Instead, ECI needs only the topology, that is, of course, a pivot advantage. The ex-post (meaning the stop criterion is known) search for “patient zero” is reduced to about the 7% of the nodes. In this case, applying the ECI to the Laplacian matrix instead of the adjacency matrix would improve the performance considerably; in fact, node 87, the epidemic source, would be ranked as the 7th oldest. Moreover, we have deleted some less relevant nodes to test the robustness of the algorithm again. The last application that we consider in this paper regards the diffusion of a software worm on a computer local area network (LAN) with 759 nodes, see Figure 5. The graph suffers from the absence of some links, due to the inherent difficulty of the data collection. Considering the first three ECI nodes 359, 492, 214, we find as, within an error margin of 5 hops or less from nodes 359, 214, (excluding node 492 that is entirely mistaken) the actual sources 1, 2, 3 are all reachable. The sources are reachable from node 359 within five hops and within four hops from node 214. On the other hand, ECI captures two sources 3, 2 (out of 1, 2, 3) respectively as the 25th and 27th (359, 492, 214, ..., 3, 59, 2). The other option to find the sources is the exhaustive visit of the 27 nodes 359, 492, 214, ..., 3, 59, 2, that is very short (3.6% of the total number of nodes).
Figura 5. The graph of the computer LAN infected by a software worm. Infection begins from nodes 1, 2, 3, (red) inside to the dotted rectangle. The network is incomplete as many links are missing, but the algorithm proved to be robust
Of course, it would be useful to know the margin error to stop the visit as soon as possible. We do not calculate the error margin, but provide a rough estimate of the algorithm performance: we propose a well-known global index [8], [9]: EIN = 1/N Σi eλi
(9)
averaged over the number of nodes. If the eigenvalues are the algebraic counterpart of the geodesic graph properties, they should be able to indicate the algorithm effectiveness, since EIN is known to be a measure of the global graph connectivity that influences the communicability. Therefore, a high EIN value could be correlated to a good performance of the algorithm (Table 1). Consequently, if the EIN parameter is significant on a BA network of the same size, it is probably possible to stop the visit to the first 10% of the total number of nodes. Of course, this is only a preliminary analysis of a limited data set preventing statistically significant claims. To validate an accurate statistical correlation between EIN and the real outcome would be necessary an extensive analysis on a large number of realworld networks of different kinds, supported by the standard statistical tests. Table 1. The networks are ranked according to EIN. Although discrepancies are present, nevertheless the EIN follows the ECI performance. The performance ranking in the last column (the best-evaluated performance is numbered 1) is somewhat arbitrary
Avr. Estrada Graph Nodes 759
Index 2.58
Perform. 8
ER
200
2.59
9
Kwa Zulu
205
2.68
6
BA 110
110
2.78
7
Underground
70
5.55
5
Santa Fe
76
13.76
4
BA 1000
1000
7.87
3
BA 2500
2500
19.5t
2
BA 10000
10000
697
1
LAN
It was already known that the eigenspectrum describes the depth characteristics of graphs efficiently, but is amazing to unveil its capability to identify the age of nodes on a simple topological basis in real world networks. ICI Bucharest © Copyright 2012-2017. All rights reserved
402
Vincenzo Fioriti, Marta Chinnici
4. Conclusions In this paper, we consider the following problem: to identify the oldest nodes or the source of an epidemic spreading in real networks, without measurements. We have shown that using simple graph theory methodologies as well as the graph topology in the mathematical form of the adjacency matrix the oldest nodes are identified. The main tool used is the Estrada-Benzi total communicability applied to several real networks: an underground, the diffusion of a software worm in a LAN and a cholera outbreak. The identification of the oldest nodes is feasible within a small margin of error, usually due to missing nodes or edges. Moreover, this simple technique should allow researchers to analyse large size networks using currently available elaboration resources, avoiding cumbersome calculations, while the framework presented in this paper can be applied likewise to the complex networks field.
REFERENCES 1. Arbore, A., Fioriti, V. & Chinnici, M., (2016). The topological defense in SIS epidemic models, Chaos Solitons and Fractals, 86, 1622, ISSN: 0960-0779. 2. Barabasi, A. L. & Albert, R. (1999). Emergence of scaling in random networks, Science, 286(54439), 509-512. 3. Estrada, E., Hatano, N. & Benzi, M. (2012). The physics of communicability in complex networks, Physics Reports, 514, 89-119. 4. Estrada, E. & Hatano, N. (2007). Statisticalmechanical approach to sub-graph centrality in complex networks, Chem. Phys. Lett., 439, 247-251. 5. Estrada, E. & Higham, D. J. (2010). Network properties revealed through matrix functions, SIAM. Rev., 52, 671–696.
http://www.sic.ici.ro
6. Fioriti V., Chinnici, M. & Palomo, J. (2014). Predicting the Sources of an Outbreak with a Spectral Technique, Applied Mathematical Sciences, 8(135), 6775-6782. HIKARI Ltd, ISSN: 1312885X. 7. Fioriti, V. & Chinnici, M. (2014). Identifying sparse and dense sub-graphs in large graphs with a fast algorithm, Euro Physics Letters, 108(5). ISSN: 0295-5075. 8. Girvan, M. & Newman, M. E. J. (2002). Community structure in social and biological networks. In Proc. Natl. Acad. Sci. USA 99 (7821-7826). 9. Kunegis, J., Fay, D. & Bauckhage, C. (2010). Network Growth and the Spectral Evolution Model. In CIKM’10 Conference. Toronto, Canada. 10. Milanese, A., Sun, J. & Nishikawa, T. (2010). Approximating spectral impact of structural perturbation in large networks, Phy. Rev. E 81, 046112. 11. Pinto, P., Thiran, P. & Vetterli, M. (2012). Locating the Source of Diffusion in LargeScale Network, Phys. Rev. Lett., 109, 068702. 12. Restrepo, J., Ott, E. & Hunt, B. (2006). Characterizing the dynamical importance of network nodes and links, Phy. Rev. Lett., 97. 13. Wang, Y., Chakrabarti, D., Wang, C. & Faloutsos, C. (2003). Epidemic Spreading in Real Networks: an Eigenvalue Viewpoint. In Proceeding SRDS2003. Florence, Italy. 14. Watts, D. J. & Strogatz, S. H. (1998). Collective dynamics of ‘small-world’ networks, Nature, 393. 15. Zhu, G., Yang, H. J., Yang, R., Ren, J., Li, B. & Lai, Y. C. (2012). Uncovering evolutionary ages of nodes in complex networks, The European Physical Journal B, 85, 106-111.