Comparison of Mean, Modal and Median Based Approaches. Nicholas W. D. Evans and John S. Mason. Department of Electronic and Electrical Engineering.
Noise Estimation Without Explicit Speech, Non-speech Detection: a Comparison of Mean, Modal and Median Based Approaches Nicholas W. D. Evans and John S. Mason Department of Electronic and Electrical Engineering University of Wales, Swansea eeevansn, j.s.d.mason @swansea.ac.uk �
Abstract Automatic speech recognition performance tends to be degraded in noisy conditions. Spectral subtraction is a simple, popular approach of noise compensation. In conventional spectral subtraction [1, 2], noise statistics are updated during speech gaps and subtracted from a corrupt signal during speech intervals. Some means of explicit speech, non-speech detection is therefore essential. Recent proposals have avoided the problem of speech, non-speech detection [3, 4, 5, 6, 7] by continually updating noise estimates whether speech is present or not. In this paper, we evaluate two such approaches of noise estimation and compare their performance with standard noise estimation in hand-labelled speech gaps. Experimental results are reported with the conventional spectral subtraction framework on a 1500 speaker database. Results confirm that such approaches of noise estimation which do not rely on explicit speech, non-speech detection compare favourably with conventional noise estimation approaches.
1. Introduction Background noise is a well known and well researched problem in many speech technology applications. In automatic speech recognition (ASR), strategies of noise compensation fall into three general categories. Information about the prevailing noise conditions may be used to compensate so-called clean speech models for changes that are likely to occur due to the noise [8, 9, 10]. Pre-processing techniques such as spectral subtraction [1, 2, 11] focus on suppressing the noise in the speech signal. Finally specific feature sets can also be selected which are judged to be robust to noise. In all cases, the aim in ASR is to reduce the mis-match between training and testing conditions while retaining a good representation of the speech. An optimal solution is likely to employ more than one of these techniques as for example in [12] where spectral subtraction and model adaptation are combined. The original work of Boll [1] and Berouti et al [2] has led to a large amount of research based on front-end processing of noisy speech. This fundamental approach requires a spectral estimate of the noise which is subtracted from the noisy signal. In the original work, estimates are obtained in non-speech periods, ideally immediately prior to the speech itself. This calls for speech, non-speech detection which can be a major problem in its own right especially in noisy conditions. To overcome this problem, some interesting approaches to noise estimation have been proposed recently which do not require explicit speech detection [3, 4, 5, 6, 7]. These approaches estimate noise during both non-speech and speech intervals and
continuously process the signal without explicitly differentiating between speech and non-speech periods. This paper assesses two such approaches against the benchmark of the original approach incorporating explicit speech detection. Here for the purposes of assessment the speech and non-speech sections are hand-labelled. In so doing, the problem of automatic labelling of speech, non-speech segments is circumvented. As a consequence a reliable estimate of the most recent noise can be assumed without any degradation caused by potential errors in speech, non-speech detection. Histogram [6] and quantile [7] based noise estimation approaches are examined to assess their performance without speech, non-speech detection. The emphasis here is on obtaining noise estimates. Thus the subsequent subtraction process and recognition tests are common to all three approaches. The remainder of this paper is organised as follows. In Section 2 we describe various noise estimation approaches which do not require speech, non-speech detection. In Section 3 we describe the database and recognition process, noise estimation approaches and the noise subtraction process which are used in Section 4 for the experimental work. Finally in Section 5 we discuss the results with our conclusions.
2. Noise Estimation In noise compensation by spectral subtraction an estimate of the noise is subtracted from the noisy speech signal. Obtaining this estimate is itself a non-trivial task. The noise is assumed sufficiently stationary and in the early work of Boll [1] and Berouti et al [2] estimates were obtained during non-speech intervals, ideally close to the speech signal. This calls for explicit speech, non-speech detection to determine where to start and stop noise estimation. In fact recent work including [3, 4, 5, 6, 7] has been directed at noise estimation without explicit speech, non-speech detection thereby circumventing a difficult task and ensuring that estimates are obtained not only close to speech intervals but also during the speech periods. Martin [3] proposes a method of noise estimation obtained from minimum values of a smoothed power estimate of the corrupt signal. This approach is extended in [4]. For each subband, a time window is defined over which the minimum statistics are derived. The window is large enough to bridge peaks in the power spectrum attributed to speech. The assumption is made that the valleys of the spectrum lie on the noise level which are used to obtain an estimate of the contaminating noise. Speech periods are accommodated therefore by ensuring noise intervals are included. Arslan et al [5] propose a simple method of adaptive noise estimation. The noise estimate is continually updated but is al-
noise noisy speech
Count
lowed to increase much more slowly than it is allowed to decrease. The noise estimate will increase only slowly during speech intervals but collapse quickly to the instantaneous noise in speech gaps. The system has a long time constant to increasing signal levels and therefore is likely not to respond well to increases in noise levels. In this paper we describe and assess two alternative ideas for noise estimation and compare them against a hand-labelled speech, non-speech conventional system where estimates are made immediately prior to the speech. The two are chosen on the grounds that they both continuously estimate noise, not stopping during speech intervals, are relatively simple to implement and are based on different statistical measures.
�
2.1. Histogram Based Estimation
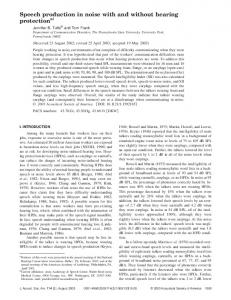
2.2. Quantile Based Estimation Stahl et al [7] base their work on the idea put forward by Hirsch and Ehrlicher [6], but extend the basic idea of energy histograms to quantile based noise estimation. Over a similar duration, the power in each sub-band is calculated and sorted by value. The noise estimate is taken as the middle or median of the resulting profile. The approach is illustrated in Fig. 1(b) for the same noise and speech segments as in (a). The noise estimate is obtained from q = 0.5 on the graph producing a similar estimate to that of the histogram approach. A characteristic of these approaches is the removal of the explicit speech, non-speech boundary detection. The noise estimate is continually updated whether speech is present or not. In this paper we assess the histogram and quantile based noise estimation techniques and compare their performance in spectral subtraction with conventional noise estimation during handlabelled speech gaps. These three approaches of noise compensation are modal, median and mean estimates respectively and these terms are used in the remainder of the paper.
3. ASR Based Experiments 3.1. Database Experiments were performed on a telephony database [13] of 10 Welsh isolated digits with 100 speaker training utterances and 1500 speaker test utterances; each person contributed one spoken digit. No overlap exists between training and testing data. To evaluate the performance of each noise estimation algorithm with different noise statistics, real car noise was artificially added to the test data at realistic SNRs. No noise was added to the training data. Car noise was added from a database
Power
(a) noise noisy speech
Power
Hirsch and Ehrlicher [6] propose two methods of noise estimation. In the first, the noise estimate is calculated from a weighted average of past spectral magnitude values which are below an adaptive threshold. In the second, the noise estimate is obtained from sub-band energy histograms. A threshold is set over which peaks in the histogram profile are attributed to speech. The highest peak in the profile below this threshold is taken as the noise estimate. The noise estimate is essentially the mode of the distribution. An example histogram is shown in Fig. 1(a) where a smoothed power histogram is plotted for a noise signal and a noisy speech signal over a period of 0.5 seconds centered on 1000Hz. The noise estimate is taken as the peak of this profile. The resulting noise estimate depends on the histogram bin-width.
�
0.0
0.25
0.5 quantile, q
0.75
1.0
(b)
Figure 1: noise estimation from (a) power histogram centred at 1000Hz, after [6] and (b) sorted power values for data as in (a) after [7]
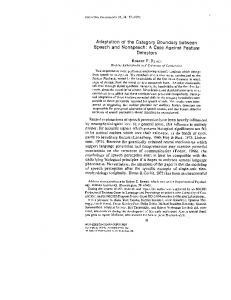
recorded at 0mph, 50mph and 70mph. The SNR of each utterance after noise contamination was in the order of 0dB although the exact SNR was dependent on the original energy of the uncorrupt speech. 3.2. Noise Estimation For all three examples of noise estimation under investigation here, the noise estimate was calculated over an interval of 0.5 seconds. All data was sampled at 8kHz and noise statistics where collected from frames of 32ms duration with a frame rate of 16ms. An illustration of each approach is given in Fig. 2 and is accompanied by an explanation below. Of the three techniques of noise estimation under investigation here, that of conventional mean noise estimation is the only method to require explicit speech, non-speech detection. In our implementation of the algorithms in [1, 2], speech sections of the input signal were hand-labelled so noise estimation was not affected by the performance of an automatic speech, non-speech detector. An example of mean noise estimation for the given time signal is illustrated in Fig. 2 by the solid lines in (b) and enlarged for the speech interval in (c). The noise level is designed to increase throughout the duration of the recording. The mean noise estimate increases gradually until the speech interval is reached at approximately 3.5 seconds. At this point
Amplitude
assumed noise level, allbeit with high quantisation effects. As in [7], the sorted profile of noise power over the estimation interval is determined. The median noise estimate is set as the middle or median value of the profile. The estimate is applied in the spectral subtraction algorithm at the centre of the interval as for the modal based approach. Again the profile (dotted lines in Fig. 2) appears to follow the noise level throughout the duration of the speech but without the apparent quantisation effects of the modal approach.
0.0
1.0
2.0
3.0 4.0 Time (s)
5.0
6.0
7.0
3.3. Noise Subtraction
(a)
Power
mean mode median
�
Spectral subtraction was implemented for all three approaches of noise estimation and the same algorithm was applied to each. In all cases the noise estimate was smoothed before subtraction and the resulting spectrum was median filtered to remove nonphysical negative values in the processed power spectrum. As for all common implementations of spectral subtraction and in [2, 11] the noise estimate was multiplied by some scalar value before subtraction. A noise scalar ( in the literature) of 0 corresponds to the original degraded speech without any noise subtraction. Current work in spectral subtraction techniques report the benefit of a spectral floor. In this work, a spectral floor was not implemented since its application is likely to benefit all three methods to the same extent. �
0.0
1.0
2.0
3.0 4.0 Time (s)
5.0
6.0
7.0
(b) mean mode median
Power
4. Experimental Results
�
Recognition tests were performed on the same data for the three approaches of noise estimation and repeated for all three car speeds under consideration. As was illustrated in Fig. 2 the three noise estimation techniques yield different statistical approximations of the prevailing noise conditions. For these reasons it was necessary to test different values of noise scalar ( ) for each approach. Table 1 presents results of recognition tests for spectral subtraction experiments using mean noise estimation as in [1, 2, 11]. The first column indicates the speed in miles per hour of the car in which the noise was recorded. For the first row, no noise was added and the results illustrate the performance of spectral subtraction on the original test data. Each column illustrates the recognition error rates for experiments with varying noise subtraction scalars. A noise scalar of 0 corresponds to no noise subtraction. Without any added noise or noise subtraction the error rate is 20%. The error rate increases for zero noise conditions when spectral subtraction is applied. The following rows illustrate the effect on recognition when noise is added to the test data. The first observation coming from these initial experiments was the differences in recognition error rates for the utterances before spectral subtraction. The highest recognition error (82%) before noise subtraction was produced when noise from a car travelling at 50mph was added. Slightly lower recognition error rates were achieved when noise from a car travelling at 0mph (74%) and 70mph (74%) was added. These differences in recognition error can be attributed to the differences in spectral composition at each speed. In all cases the SNR is in the region of 0dB. For mean noise estimation the best results where achieved with a noise estimation scalar of 1.0 corresponding to an average error rate of 33% from 63%. Above noise scalars of 1.0, results tended to degrade as excessive speech was subtracted. These results reflect the theoretical optimum for mean noise estimation with respect to speech, non-speech detection since speech intervals were hand-labelled. These results are now �
3.0
3.5
4.0 Time (s)
4.5
5.0
(c)
Figure 2: (a) time waveform of utterance plus added noise with constant increase and (b) mean, modal and median based noise estimates for power centred at 1000Hz and (c) as for (b) but enlarged for speech interval
noise estimation pauses and the noise estimate remains stationary throughout the duration of the utterance. When the speech, noise boundary is detected the estimation process continues. During the speech interval the noise level increases but the noise estimate is not updated with conventional mean noise estimation. As in [6], the noise estimate is chosen as the mode of the noise distribution in each sub-band. In our implementation of Hirsch’s approach the bin-width was determined before hand to give a suitable distribution for all sub-bands, given the noise statistics. The noise is estimated over 0.5 seconds and the modal noise estimate is applied at the centre of the estimation interval. Modal noise estimation is also illustrated in Fig. 2 by the dashed lines. The quantisation effects on the noise estimate are particularly noticeable. During the speech interval in Fig. 2(c) the noise estimate is continually updated and appears to follow the
compared to those of median and modal noise estimation approaches which do not require speech, non-speech detection. Table 2 presents results of recognition tests for spectral subtraction experiments using modal noise estimation as in [6]. The modal spectral estimate tends to be higher than the mean as illustrated in Fig. 2 and so lesser values of noise scalars were considered. The greatest reduction in error (63%-40%) was achieved with a noise scalar of 0.25. Table 3 presents results of recognition tests with a median noise estimate as in [7]. Again smaller values of the noise scalar were assessed since the median noise estimate is also generally higher than the mean. The greatest improvement in recognition (63%-37%) was achieved with a noise scalar of 0.25.
5. Conclusions The goal here was to assess approaches to spectral estimation which do not require specific non-speech detection. The benchmark system with mean noise estimation gives a reduction in error from 63% to 33%. Results from modal estimation (40%) and mean noise estimation (37%) do not perform quite as well as mean estimation. For modal estimation the high quantisation effects lead to less accurate estimation and results degrade significantly when higher values of the noise scalar are used. The performance of such an approach depends greatly on the choice of histogram bin-width. The quantile approach gives better performance than the histogram approach but also tends to produce a greater spectral estimation of noise than the same estimate obtained from the conventional approach using speech, non-speech detection. However, it should be remembered that here an ideal speech, non-speech detector is simulated. Thus the alternative approaches seem worthy of further consideration.
6. References [1] S. F. Boll. Suppression of Acoustic Noise in Speech using Spectral Subtraction. IEEE Trans. on ASSP, pages 113– 120, 1979. [2] M. Berouti, R. Schwartz, and J. Makhoul. Enhancement of Speech Corrupted by Acoustic Noise. In Proc. ICASSP, pages 212–215, April 1979. [3] R. Martin. Spectral Subtraction Based On Minimum Statistics. In Proc. EUSIPCO, pages 1182–1185, 1994. [4] G. Doblinger. Computationally Efficient Speech Enhancement By Spectral Minima Tracking in Subbands. In Proc. EuroSpeech, volume 2, pages 1513–1516, 1995. [5] L. Arslan, A. McCree, and V. Viswanathan. New Methods for Adaptice Noise Suppression. In Proc. ICASSP, volume 1, pages 812–815, 1995. [6] H. G. Hirsch and C. Ehrlicher. Noise Estimation Techniques for Robust Speech Recognition. In Proc. ICASSP, volume 1, pages 153–156, 1995. [7] V. Stahl, A. Fischer, and R. Bippus. Quantile Based Noise Estimation for Spectral Subtraction and Wiener Filtering. In Proc. ICASSP, volume 3, pages 1875–1878, 2000. [8] D. Van Compernolle. Noise Adaptation in a Hidden Markov Model Speech Recognition System. Computer Speech and Language, 3:151–167, 1989.
[9] A. P. Varga and R. K. Moore. Simultaneous Recognition of Concurrent Speech Signals using Hidden Markov Model Decomposition. In Proc. EuroSpeech, volume 3, pages 1175–1178, 1991. [10] M.J.F. Gales and S.J. Young. HMM Recognition in Noise using Parallel Model Combination. In Proc. EuroSpeech, volume 2, pages 837–840, 1993. [11] P. Lockwood and J. Boudy. Experiments with a Non-linear Spectral Subtractor (NSS), Hidden Markov Models and the Projection, for Robust Speech Recognition in Cars. In Proc. EuroSpeech, volume 1, pages 79–82, 91. [12] J.A. Nolazco Flores and S.J. Young. Continuous Speech Recognition in Noise using Spectral Subtraction and HMM Adaptation. In Proc. ICASSP, volume 1, pages 409–412, 1994. [13] C. Draxler, H. van den Heuvel, and H. Tropf. SpeechDat Experiences in Creating Large Multilingual Speech Databases for Teleservices. In Proc. LREC, Granada, volume 1, pages 361–366, 1998. speed (mph) 0 50 70 Avg
noise scaler ( ) 0.5 1.0 1.5 22 23 24 24 24 24 54 52 52 35 34 35 34 33 34 �
0.0 20 74 82 74 63
2.0 24 25 57 38 36
Table 1: Recognition error rates (%) for mean noise estimation
speed (mph) 0 50 70 Avg
noise scalar ( ) 0.25 0.5 0.75 37 45 50 31 34 36 57 57 58 34 35 37 40 43 45 �
0.0 20 74 82 74 63
1.0 53 37 57 41 47
Table 2: Recognition error rates (%) for modal noise estimation
speed (mph) 0 50 70 Avg
noise scalar ( ) 0.25 0.5 0.75 24 31 37 29 29 38 57 58 57 36 37 44 37 39 44 �
0.0 20 74 82 74 63
1.0 43 47 60 52 51
Table 3: Recognition error rates (%) for median noise estimation