Noise Management in Mobile Speech Based Health Tools Nikhil Yadav, Louis Daudet, Christian Poellabauer, Patrick Flynn Department of Computer Science and Engineering University of Notre Dame Notre Dame, IN, USA
[email protected],
[email protected],
[email protected],
[email protected]
Abstract— Noise impacts speech recognition and processing capabilities on mobile devices. The Signal-to-Noise Ratio (SNR) is a good indicator of noise in the acoustic environment where the speech is recorded and processed. In this paper, SNR and its impact on speech recognition and processing capabilities on a mobile device are studied for a relatively small text corpus of 50 words. The speech recognition accuracy is quantified using a word accuracy metric for different levels of SNR. Future mobile health tools that detect speech disorders caused by illness can benefit from this study and the resulting tool developed to give appropriate feedback to a user about their acoustic environment. Corrective measures can be suggested based on this to alleviate the potential problem, e.g., adjusting a microphone or relocating to a quieter environment.
I. I NTRODUCTION In-depth studies of speech measurement for general voice disorders [1] [2] [3] [4] [5] [6] [7] [8] and specifically Parkinson’s Disease (PD) [9] [10] have been conducted before. Research has shown that individuals with closed head injuries (CHI) exhibit significantly less intelligible speech than healthy individuals [15]. Deficits in the prosodic, resonatory, articulatory, respiratory, and phonatory aspects of speech production are evident in CHI cases. In [16], the authors show that persons with spastic dysarthria resulting from brain injury show an increase in vowel formant frequencies as well as duration of vowel sounds. In [17], speech processing speeds were affected by post-acute mTBI on a group of rugby players. Similar studies for PD affected persons have shown some form of vocal impairment [11] [12]. Vocal impairment may be the earliest indicator for the onset of an illness [13]. Measuring speech is non-invasive and simple to administer. Voice measurement to detect and track progression symptoms of PD has also been receiving significant attention recently [14]. In this paper, an external noise canceling microphone on a mobile device is used to capture speech. The SNR and power in the recorded speech is reported in different simulated acoustic environment settings. The impact of SNR on speech recognition and processing capabilities is studied. A threshold SNR and power value is derived that we use in a mobile tool to recommend actions to the subject in case SNR or power is not appropriate for accurate speech recognition and processing. The paper is organized as follows: The metrics for SNR, power, and speech recognition accuracy are described in Section II, the experimental setup and data collected is discussed
in Section III. In Section IV we present the results of our experimentation and illustrate the impact of SNR on the speech recognition and processing capabilities on the device. Section V discusses the interpretation of these findings and provides conclusions and the relevance of the results in building a mobile tool to give feedback and recommendations based on the SNR of the acoustic environment. II. T HE M ETRICS We developed a mobile application for iOS, which captures a user speaking a standard text corpus of 50 words in the order shown in Table I on an iPad screen using a noise canceling microphone attached to the device. SNR and power metrics are recorded on the device, and the speech recognition accuracy is calculated for the different speech files generated. A. Signal-to-Noise Ratio (SNR) The SNR is defined as: Peak Speech Power Mean Noise Power The SNR algorithm reports the SNR value in the voiced (V) and unvoiced (U) portion of the individual’s speech in decibels (dB). SNR = 10log
B. Power The power of the speech signal recorded on the device is defined as: Speech Amplitude2 2 C. Speech Recognition Accuracy Power =
The Sphinx1 speech recognition toolkit is used to process the recorded speech. Pocketsphinx, which is a lightweight version of Sphinx for embedded and mobile systems, is used to recognize the speech. The generic Wall Street Journal (WSJ) acoustic speech recognition model, which comes packaged with Pocketsphinx, is used in conjunction with a grammar model written in the JSpeech Grammar Format (JSGF), to force align words and obtain their timing boundaries. The recognition accuracy is defined as the number of words correctly recognized within their true timing boundaries in the recorded speech to an accuracy of 10%. If 1 http://cmusphinx.sourceforge.net/
the toolkit fails to recognize all the words or returns a null value for the whole speech recording, the accuracy is defined as zero.
SUBJECT 1 2 3 4 5 6 7 8
Words correctly recognized Accuracy = Total number of words TABLE I T EXT C ORPUS WORDS application, participate, education, reluctantly, population, number, guitar, congratulations, possibility, placement, mathematical, pocket, inconsiderate, immortality, inheritance, therapy, tenuous, synchronize, decreasing, leadership, profiling, pasta, addiction, blind, hyperbolic, immune, bothering, megabyte, variation, register, password, microwave, bottle, housing, passive, gallon, vinegar, computer, salt, prime, immutable, sanitation, creepy, vegetable, flute, wallet, vanity, memory, tuxedo, final
III. E XPERIMENTAL S ETUP A mobile application running on an iPad device was designed to display the text corpus on a screen. Four male and four female subjects, whose demographics are shown in Table II, were asked to read out the words as they appear, into a low-impedance Shure SM10A microphone2 designed for close-talk headworn applications such as remote-site sport broadcasting. The recordings were taken in the same environment to simulate similar conditions. TABLE II S UBJECT D EMOGRAPHICS GENDER
1 2 3 4 5 6 7 8
Female Female Male Male Female Male Male Female
NATIVE U.S. ENGLISH SPEAKER NO YES NO NO YES NO NO NO
SNR (Voiced, dB) 40.83 36.06 43.99 41.92 42.07 41.65 43.98 43.32
SNR (Unvoiced, dB) 25.92 21.94 27.49 26.37 28.33 26.43 27.48 29.30
B. Methods
Time between word onset on display: 1.5s
SUBJECT
TABLE III SNR R EADINGS FOR 100% SPEECH RECOGNITION ACCURACY ( NORMALIZED RECORDINGS )
AGE 24 29 27 32 24 25 25 27
A. Data Collected Speech data is collected for the four male and four female individuals speaking the 50 words in a similar environment. The speech recorded on the device is sampled at 44.1KhZ, 16 bit, mono channel for the SNR algorithm to work effectively. The volume for all the data was normalized using software tools to avoid discrepancies between recordings. Table III shows the voiced and unvoiced SNRs for the data collected at 100% accuracy of the voice recognition software. 2 http://www.shure.com/americas/products/microphones/sm/sm10aheadworn-microphone
1) Impact of Signal Power on Speech Recognition: For the first pass of the experiment, the power of each of the normalized recordings was reduced in steps of 2 dB. Pocketsphinx speech recognition was run over these files to determine the speech recognition accuracy and the power at which speech recognition drops or fails. The SNR readings were recorded. The results for this are shown in Table IV and discussed in the next section. 2) Impact of Noise on Speech Recognition: Noise (a recording of a discussion between two persons), was mixed with each of the speech files to simulate conditions of background noise. The intensity of the noise was reduced in steps of 2 dB and its impact on the speech recognition accuracy was determined. The results are shown in Figure 4 and discussed in the next section. IV. R ESULTS The power levels of the normalized signals for the eight subjects were reduced in steps of 2 dB to find a cutoff at which the speech recognizer fails, or its accuracy reduces. The power was dropped to a maximum of 34 dB, where the speech was barely audible for all 8 subjects. Interestingly, the SNR calculation software used appears to be very robust to major drops in the intensity of the speech signals. This is illustrated by the fact that the SNR values reduced very slightly as the intensity of the normalized speech was reduced for all subjects. The speech recognition accuracy is very good, but does fail in 3 instances, for subjects 1, 3, and 7, when the power intensity is dropped to values below 28 dB for subject 1 and below 30 dB for subjects 3 and 7. The speech recognition toolkit appears to be very robust and unbiased towards the gender of the subject. It can be argued that this is a very reduced sample size; however, currently data is being collected from over a thousand subjects, taking a similar test in real world conditions. A similar study is anticipated to find SNR values at which the acoustic speech recognition model of Pocketsphinx performs within a reasonable speech accuracy rate. The SNR values do not change drastically, indicating other factors that may include (but are not limited to), software inconsistencies in the acoustic speech recognition model causing recognition to fail. In the next step, a noise signal was added to the normalized speech recordings of each subject to simulate a noisy
TABLE IV I MPACT OF R EDUCING P OWER ON S PEECH R ECOGNITION ACCURACY
SUBJECT 1
2
3
4
5
6
7
8
POWER DROP 2dB-16dB 18dB-26dB 28dB-34dB 2dB-16dB 18dB-26dB 28dB-34dB 2dB-16dB 18dB-28dB 30dB-34dB 2dB-16dB 18dB-26dB 28dB-34dB 2dB-16dB 18dB-26dB 28dB-34dB 2dB-16dB 18dB-26dB 28dB-34dB 2dB-16dB 18dB-28dB 30dB-34dB 2dB-16dB 18dB-26dB 28dB-34dB
Avg. ACCURACY 100% 98.2% Failed 100% 99.8% 99.5% 100% 99.17% Failed 100% 100% 100% 100% 99.8% 98.3% 100% 100% 98.5% 100% 98.67% Failed 99.5% 94.4% 92.25%
Avg. SNR (in dB) 40.84(V), 25.95(U) 40.54(V), 25.85(U) 38.04(V), 24.00(U) 36.13(V), 21.98(U) 36.69 (V), 22.23(U) 36.70(V), 21.90(U) 43.95(V), 27.44(U) 43.32(V), 26.68(U) 40.49(V), 23.95(U) 41.93(V), 26.38(U) 41.98(V), 26.43(U) 40.92(V), 25.45(U) 42.07(V), 28.32(U) 42.09(V), 28.23(U) 41.52(V), 27.36(U) 41.65(V), 26.43(U) 41.71(V), 26.43(U) 41.55(V), 26.05(U) 43.94(V), 27.43(U) 43.32(V), 26.68(U) 40.48(V), 23.95(U) 43.31(V), 29.28(U) 43.21(V), 29.08(U) 42.33(V), 27.89(U)
Fig. 2.
Impact of Noise on Speech Recognition Accuracy (Subject2)
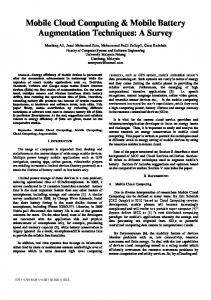
Fig. 3.
Impact of Noise on Speech Recognition Accuracy (Subject3)
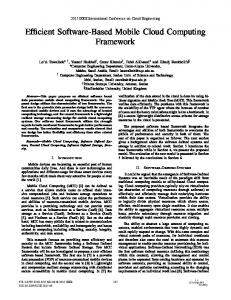
Fig. 4.
Impact of Noise on Speech Recognition Accuracy (Subject4)
environment. The intensity of the noise signal was reduced in steps of 2 dB. The corresponding speech recognition accuracy and SNR values were recorded. Figure 1- 4 show the trends that were observed for the first 4 subjects. In general, the same trend was observed for all the subjects, and speech recognition accuracy was greatly improved as the intensity of noise was decreased.
Fig. 1.
Impact of Noise on Speech Recognition Accuracy (Subject1)
As can be seen, the speech recognition accuracy improved drastically when the SNR values were increased. When the intensity of the noise signal was reduced, resulting in higher SNRs, there was a positive impact on speech recognition accuracy. The threshold for the SNR values in which a
speech recognition accuracy of greater than 95% speech was achieved is shown in Table V. Any values below these, resulted in accuracy drops, which were quiet steep at times. In particular, the accuracy reduced to 0 for all subjects when the intensity of the noise signal was reduced between 2 dB to 14 dB. The accuracy improved and reached close to 100% for no noise or very low intensity noise. TABLE V SNR T HRESHOLDS FOR >95% SPEECH RECOGNITION ACCURACY IN S IMULATED N OISY E NVIRONMENTS SUBJECT 1 2 3 4 5 6 7 8
SNR (Voiced, dB) 32.76 31.76 35.57 38 38 36 35.58 36
SNR (Unvoiced, dB) 19.10 17.91 19.67 22 24 22 19.67 22
Based on this data, we recommend that for accurate voice recognition using the Pocketsphinx software toolkit, it is advisable to record signals that have a voiced SNR above 38 dB and an unvoiced SNR over 22 dB. The speech recognition tool running on the device appears to be unbiased towards vocal qualities due to gender of the subject taking the test. V. D ISCUSSION AND F UTURE W ORK Speech recognition applications running on mobile devices often rely on an optimal power and SNR level to perform accurately and recognize word utterances clearly. In this paper we show, on a reduced testing population of 8 individuals with an equal split in gender, that for a speech recognition tool like Pocketsphinx to be accurate, the background noise needs to be kept at a minimal level. If not, than this can impact the speech recognition accuracy as it drops the SNR of the recorded speech. The tool developed on an iPad device based on this study can now make recommendations to relocate to a quieter environment or re-position the microphone to increase the intensity of the speech recorded based on the SNR calculations performed on the device. Currently, we are researching SNR values that impact speech recognition on mobile devices in a real-world setting. As part of this effort, speech recordings from over a thousand individuals speaking varied text corpuses in different environments and times are being analyzed to make a more conclusive case for the recommended SNR values. This research can be extended to measure voice signals recorded in acoustic environments more typical of a practical telemedicine application, which can analyze voice for signs of head injury, given a baseline recording from the same subject in a more healthy state. ACKNOWLEDGMENT This research was supported in part by GE Health and the National Football League. The authors would like to thank Vince Stanford of the National Institute of Standards and
Technology (NIST) for his help in providing us with the SNR estimation algorithm. R EFERENCES [1] J. Alonso, J. de Leon, I. Alonso, and M. Ferrer, “Automatic detection of pathologies in the voice by hos based parameters,” J Appl Sig Proc, vol. 4, p. 275284, 2001. [2] M. Little, P. McSharry, I. Moroz, and S. Roberts, “Nonlinear, biophysically-informed speech pathology detection,” in Proc ICASSP, 2006. [3] M. Little, P. McSharry, I. Moroz, D. Costello, and S. Roberts, “Exploiting nonlinear recurrence and fractal scaling properties for voice disorder detection,”Biomed Eng Online vol. 6:23, 2007. [4] J. I. Godino-Llorente and P. Gomez-Vilda, “Automatic detection of voice impairments by means of short-term cepstral parameters and neural network based detectors,” IEEE Trans Biomed Eng, vol. 51, pp. 380–384, 2004. [5] S. Hadjitodorov, B. Boyanov, and B. Teston, “Laryngeal pathology detection by means of classspecific neural maps,” IEEE Trans Inf Technol Biomed, vol. 4, pp. 68–73, 2000. [6] M. Falcone, N. Yadav, C. Poellabauer, and P. Flynn, “Using isolated vowel sounds for classification of mild traumatic brain injury,” ICASSP, 2013. [7] B. Boyanov and S. Hadjitodorov, “Acoustic analysis of pathological voices,” IEEE Eng Med Biol Mag, vol. 16, p. 7482, 1997. [8] J. H. L. Hansen, L. Gavidia-Ceballos, and J. F. Kaiser, “A nonlinear operator-based speech feature analysis method with application to vocal fold pathology assessment,” IEEE Trans Biomed Eng, vol. 45, pp. 300–313, 1998. [9] D. A. R. Rahn, M. Chou, J. J. Jiang, and Y. Zhang, “Phonatory impairment in parkinson’s disease: evidence from nonlinear dynamic analysis and perturbation analysis.” J Voice., vol. 21, no. 1, pp. 64–71, 2007. [10] L. Cnockaert, J. Schoentgen, P. Auzou, C. Ozsancak, L. Defebvre, and F. Grenez, “Low frequency vocal modulations in vowels produced by parkinsonian subjects,” Speech Comm, vol. 50, pp. 288–300, 2008. [11] A. K. Ho et al., “Speech impairment in a large sample of patients with parkinson’s disease,” Behav Neurol, vol. 11, pp. 131 – 137, 1998. [12] J. A. Logemann et al., “Frequency and co-occurrence of vocal-tract dysfunctions in speech of a large sample of parkinson patients,” J Speech Hear Disord, vol. 43, p. 4757, 1978. [13] J. R. Duffy, “Motor speech disorders : substrates, differential diagnosis, and management,” in 2nd ed. Elsevier Mosby, St. Louis, Mo, 2005. [14] S. Sapir et al., “Effects of intensive voice treatment (the lee silverman voice treatment [lsvt]) on vowel articulation in dysarthric individuals with idiopathic parkinson disease: acoustic and perceptual findings.” J Speech Lang Hear Res., vol. 50, no. 4, pp. 899–912, Aug 2007. [15] D. G. Theodoros, B. E. Murdoch, and H. J. Chenery, “Perceptual speech characteristics of dysarthric speakers following severe closed head injury,” Brain Injury, vol. 8, no. 2, pp. 101 –124, feb-mar 1994. [16] W. Ziegler and D. v. Cramon, “Spastic dysarthria after acquired brain injury: An acoustic study,” International Journal of Language & Communication Disorders, vol. 21, no. 2, pp. 173–187, 1986. [17] A. D. Hinton-Bayre et al., “Mild head injury and speed of information processing: a prospective study of professional rugby league players,” Journal of Clinical and Experimental Neuropsychology, vol. 19, pp. 275 – 289, 1997.