Department of Computer Science & Mathematics, University of Portsmouth, ... A new laser based remote NDE method named RAID is described and some selected results are .... Figure 6: Seven defects in the parametric repair panel revealed.
SPIE Conference on Nondestructive Evaluation of Aging Materials and Composites, March 1999.
Non-contact laser based computation method of NDE of composites and other structures John M. Webstera, Jackie M. Mewb & Thangavel Thevara a
Holographics Inc. 44-01, 11th Street, Long Island City, New York, NY 11101. b
Department of Computer Science & Mathematics, University of Portsmouth, UK. (deceased) ABSTRACT
A new laser based remote NDE method named RAID is described and some selected results are presented in this paper. This system has demonstrated its ability to detect defects in solid laminates; honeycomb/carbon, where defects at the rear have been observed; bonding defects in ceramic and also defects such as cracking in the new carbon foam materials, both of these latter materials have extremely high acoustic attenuation. Additionally the system has recently demonstrated its feasibility to detect and quantify subsurface corrosion in aluminum riveted and bonded structures such as lap joints; to date 5% metal loss has been detected. Defects in other metal structures such as tear straps in airframe fuselages of transport aircraft are rapidly detectable. Key Words: Laser vibrometer, Acoustic impact, NDE, NDT, Computational analysis.
1. INTRODUCTION A Remote Acoustic Impact Doppler (RAID) NDE technique for application to composite structures is in the final stages of development. This technology sponsored by Defense Advanced Research Programs Agency (DARPA), analyses the surface relaxation frequencies generated by acoustic impact excitation with a highly customized laser Doppler scanning vibrometer. The system is computer based and considerable effort has been put into the development of algorithms for the analysis of the large data acquired during any scan of a typical object. The RAID system becomes an important diagnostic tool when the option of remote, non-contact NDE is preferred. It has produced promising results on different types of composite structures. Although the system was specifically developed for composites under the DARPA sponsorship, it has shown equally good results on metal structures.
2. DESCRIPTION OF THE RAID NDE TECHNIQUE 2.1 System description The RAID technology is unique in many aspects, it is totally non-contacting and can presently be operated from a remote distance of up to four meters. It employs a proprietary design acoustic transducer1 that produces an air coupled shock or pressure wave, similar to that produced from a small explosion. This is achieved by discharging a high voltage capacitor within a period of less than 5 microseconds. The discharge is contained within a small ceramic chamber with an annular design anode providing an exit for the resultant hot gasses. The design of this transducer is illustrated in Figure 1. The result of this configuration is that a single brief, but extremely high velocity shock wave of broadly unidirectional characteristics is launched into the air and used to impact and excite the object undergoing testing. The objective of the brief impact is to excite natural relaxation frequencies in the object and avoid any “blanketing” effect that would be present if continuous wave white noise was applied. Surface relaxation frequencies for any given material are dependent upon the underlying substructure of the object. A limited analogy is tapping a surface with the edge of a coin: If there is a subsurface defect, such as a debond, then the resulting relaxation frequencies make a hollow sound. However, audible responses are very difficult to quantify under any circumstances; furthermore, physical contact is not always an option. An important aspect of the RAID technique is that it does not limit itself to the excitation of a single spot but a large area of the structure.
1
SPIE Conference on Nondestructive Evaluation of Aging Materials and Composites, March 1999.
Ceramic Body
Cathode
Nozzle
Annular Anode
Figure 1: Schematic diagram of the acoustic transducer without shielding
Remote interrogation of the vibration relaxation frequencies on the surface of the object undergoing non-destructive testing is accomplished with a customized scanning laser Doppler velocimeter. This device employs a He-Ne laser, with an output of less than 1 mW, to scan the surface of the object undergoing NDT on a point by point basis with an array of up to 512 x 512 data acquisition points, which may be deployed at the operator’s choice. Our current technique converts the analog time domain velocity signal received from each data point into frequency domain by Fast Fourier Transform (FFT). Data is then stored in the computer as individual frequency bands over the pre-selected frequency range. A velocity based image is computed and presented on a monitor overlaid on an image of the object which is grabbed by a CCD camera concurrently during the scanning process. Figure 2 shows a schematic diagram of the NDT system. Computer programs for full and rapid automatic analysis of the images for fault detection are currently being developed. An initial version of the program was successfully tested in a recent field demonstration.
Translucent overlay on captured video
FFT Processing based on DSP am be ser La
Sh Ac oc ou k sti wa c ve
Object area being tested
Pulsed synchronized Scanning Acoustic Laser Exciter Velocimeter
Presentation Mode
------------Digital Frequency Domain
Time
AD Converter ------------Digital Time Domain
Scan Grid Frequency
Fast A/D Board Acquisition Mode Laser Velocimeter Controller
Pentium 200 Motherboard & Peripheries
PC Graphic Monitor
SYSTEM PC Figure 2: Schematic diagram of the remote acoustic Doppler NDT system
2
SPIE Conference on Nondestructive Evaluation of Aging Materials and Composites, March 1999.
2.2 Methodology of defect detection An area of the object to be scanned can be designated by dropping a grid over the object’s image that is being displayed on the computer monitor. The number of scan points for the grid can be set to any value within the maximum of 512 x 512. Generally, the point density will determine the minimum lateral size of the defect that can be detected. The time domain velocity signal from each data point is measured by the vibrometer and is converted to frequency domain and is stored in the computer as individual frequency bands over the pre-selected frequency range, which can be up to 200 kHz. The number of frequency bands or FFT lines can be set, for example, to 400, 800, 1600 or 3200. From our experience, 800 lines have proven to be sufficient for most cases. Take, for example, an object scan with 800 lines over a frequency range of 0 to 50 kHz: At the end of the scan, the system will provide velocity based topographical color maps for each of the 800 frequency lines. A sample color map is shown in Figure 3. Each of these 800 maps may consists of information generated by background noise, bending modes, resonant oscillations, together with defects present in the object. Hence, a means of recognizing defect information from others is necessary and as such forms a key feature of this NDT system. A scan data set can be represented as a three-dimensional structure with X, Y, and Z planes. The X and Y coordinates represent the flat object plane from which the data was collected, while the Z plane represents frequency and consists of the 800 stacks of XY images. Figure 4 depicts this situation. Signals representing defects are found to have values at least an order of magnitude higher than the surrounding and are found to exist in a number of consecutive frequency bands. Noise signals, even though at times could have high amplitudes, are generally random and do not reproduce themselves in as many adjacent frequency bands. This discovery forms the main basis of defect recognition even though there are many other rules governing the process. Bending mode signals generally occur at low frequencies and are easily avoided by ignoring data sets below certain frequency, typically 2 kHz. Figure 5 shows the 2D representation of the same idea. The above idea has been implemented into a prototype software program. The program starts by identifying clusters of data points at every FFT line which have a magnitude of at least a certain percentage (operator defined) above the average at that particular frequency. A cluster is defined as a group of adjacent points. The operator will be able to define the minimum size for the cluster in terms of number of data points. This in turn determines the minimum defect size that can be detected.
Figure 3: Velocity color map at a single frequency line
3
SPIE Conference on Nondestructive Evaluation of Aging Materials and Composites, March 1999.
Having detected the clusters in individual FFT lines, the program then looks for vertical links (as illustrated in Figure 5) between clusters in adjacent FFT lines. The operator has to define the minimum vertical links and the minimum number of FFT lines the cluster should progress, in order for it to be considered as a defect, normally this would not be less than three and desirably more. The data points do not necessarily form the same shape through the frequency layers. It is also possible to have two or more defects forming on one frequency or a same defect being revealed at a number of different frequency intervals. Once all the defects have been detected in accordance with the above methodology, the program will then overlay all the defects on a background image of the object. This provides the end user with a permanent record of the relative positions and sizes of defects on the object under inspection. Low Frequency Bending Modes
Frequency KHz
Sinusoidal Bending Modes
0
Random Noise
Signal
High Frequency Noise 50 KHz
Figure 4: Three-dimensional representation of he analysis concept
0 Hz
Low Frequency Bending Modes
Low Frequency Defect Cluster
10 - 13.5 kHz
Medium Frequency Defect Cluster
15.5 - 18.5 kHz
High Frequency Defect Cluster
23 - 25 kHz
High Frequency Noise
50 kHz Figure 5: Identification of defect clusters from noise
4
SPIE Conference on Nondestructive Evaluation of Aging Materials and Composites, March 1999.
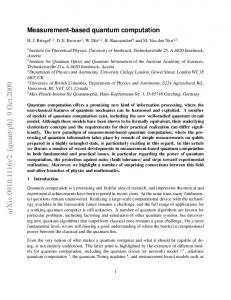
3. APPLICATION OF RAID TECHNOLOGY TO COMPOSITES AND METALS Many different types of composite structures, usually obtained as test panels from aircraft manufacturers, have been successfully tested and a range of results have been published in various conference proceedings2-5. In terms of detectable fault depth, results will be shown where the fault lays at the rear of a honeycomb core. On other structures, defects located beneath up to fourteen layers of composite have been detected. However, our experience has also included ceramic materials and carbon composite foam materials that are easily addressed by this form of testing. Similarly, the technology has been applied to aircraft metal constructions such as tear-strap delaminations and lately to corrosion. Results obtained from four different test panels are presented in this paper. The first is a carbon composite honeycomb scarf repair panel with faults simulated by the inclusion of shims. The faults were variously located at the front and rear of the honeycomb repair. Figure 6 shows one of many forms of result presentation possible with our system. The fault regions here are shown as isolines overlaid on the image of the object. Further analysis of the data recorded in the test of this panel gives accurate measurement of the fault size and shows the presence of the foam adhesive. Usually all presentations are made in colors relating to either vibration velocities or defect characterization. Animation is possible throughout a single vibration cycle and each individual data point can be analyzed with respect to its frequency spectrum, thus offering the potential for characterization of the individual fault.
Figure 6: Seven defects in the parametric repair panel revealed
Carbon foam composite is now being used in aircraft in place of honeycomb where curved shapes are required. The problem with testing this material for defects is that it is porous and therefore has a high acoustic impedance. This is further complicated by the fact that fractures are liable to proceed beneath the surface. Our test of such a test panel faithfully showed the defect. Furthermore, we were able to detect that defect from both surfaces with good correlation. Figure 7 shows the result presented as velocity color map where the brightest region (yellow in color presentation) represents the defect region. A number of test coupons simulating the shell of AWACS rotodome radome were tested with RAID technology. Each of them, representing different sections of the radome, contained a variety of preprogrammed defects simulated by the insertion of Teflon discs. Figure 8 shows the result on one of such coupons where 10 defects of various lateral sizes lying at different depths in the 1 inch thick sample were revealed. In this presentation, only the defect locations are mapped on the CCD image of the test coupon. Application of this NDE technique to metallic structures produced promising results. Delaminations in helicopter blades and in tear-straps of aircraft fuselage were reliably detected. Lately, initial experiments on detection and quantification of hidden
5
SPIE Conference on Nondestructive Evaluation of Aging Materials and Composites, March 1999.
corrosion in aircraft lap joints have proven successful to warrant further research and development. Figure 9 shows one of the results where a 5% machined metal thinning (to simulate corrosion) on the inner side of a lap joint was reliably detected. The smallest lateral size of defect (metal thinning) that has been detected to date is ¼ inch square.
Figure 7: Detection of defect in carbon foam composite
X
Figure 8: Radome coupon scan result showing 10 defect regions
6
SPIE Conference on Nondestructive Evaluation of Aging Materials and Composites, March 1999.
5%
Figure 9: Simulated corrosion of 5% metal reduction detected by RAID technique
4. CONCLUSIONS We have demonstrated that te RAID system can operate from large stand-off distances and detect defects in various composite materials and ceramics with high acoustic impedance which essentially preclude ultrasound. Additionally the technique has been applied to bonded and riveted aluminum structures such as those used on the present air transport fleet. Current efforts include the customization of this technology for specific NDE applications.
ACKNOWLEDGEMENTS This work was sponsored by DARPA Phase II # DAAH01-95-C-R182 Contract “Development of an Optical/Acoustic Method for the Remote Non-Destructive Inspection of Large Area Composite Materials for Structural Defects”. Approved for Public Release Distribution Unlimited.
REFERENCES 1.
Acoustic Wave Generating Apparatus, US Patent No. 5,616,865, 1997.
2.
Webster et al., “A new remote air coupled acoustic impact system for the NDT applications to composite and bonded metal structures” - Proc. ASNT Research Conference, Pg. 350-353, March 1998, USA.
3.
Webster et al., “A Computerized non-contacting NDT system using an impacting acoustic wave applied to detecting corrosion and subsurface defects in composite and metal structures” - Proc. Canadian Society for NDT, Sept.1998, Canada.
4.
Webster et al., “A new non-contacting NDT system for detection of debonds in composite and metal structures” - Proc. Second Joint NASA/FAA/DOD Conference on Aging Aircraft, Aug. 1998, USA.
5.
Thevar et al., “Detection and quantification of corrosion by a remote NDT system” - Proc. ASNT Research Conference, Pg. 187-189, Oct. 1998, USA.
7