Appl. Phys. A 81, 663–667 (2005)
Applied Physics A
DOI: 10.1007/s00339-005-3281-6
Materials Science & Processing
e. dooryh´ee1,u m. anne1 i. bardi`es2 j.-l. hodeau1 p. martinetto1 s. rondot1 j. salomon3 g.b.m. vaughan4 p. walter3
Non-destructive synchrotron X-ray diffraction mapping of a Roman painting 1 Laboratoire
de Cristallographie, CNRS UPR 5031, 25 av. des Martyrs, BP 166, 38042 Grenoble cedex 9, France 2 Mus´ ees de la Cour d’Or, 2 rue du Haut Poirier, 57000 Metz, France 3 Centre de Recherche et de Restauration des Mus´ ees de France, CNRS UMR 171, 6 rue des Pyramides, 75041 Paris Cedex 01, France 4 European Synchrotron Radiation Facility, av. Jules Horowitz, BP 220, 38043 Grenoble cedex, France
Received: 7 January 2005/Accepted: 14 April 2005 Published online: 7 June 2005 • © Springer-Verlag 2005
The history and the properties of materials are deduced not only from their elemental and molecular signatures, but also from their exact phase compositions, and from the structures and the defects of their constituents. Here we implement a non-destructive synchrotron X-ray based method, which combines both the quantitative structural content of diffraction and the imaging mode. As a demonstration case, the pigments of a Roman wall painting are examined. The joined elemental and mineral maps mimic the major features of the painting. Different structural phases made of common atomic elements are differentiated. Textures and graininess are measured and related to the artist’s know-how.
ABSTRACT
PACS 07.85.Qe;
1
61.10.Nz; 83.85.Hf
Introduction
Many analytical methods in environmental, geological, astrophysical, archaeological or material sciences are employed for finding out chemical species, measuring their proportions and imaging their distribution, at the surface and/or in the bulk. This information on the chemical speciation is often insufficient and diffraction-based methods are also needed to identify the structural forms of the host species [1–3]. There is an increasing demand for examining the material with a convergent combination of absorption and diffraction techniques. Fluorescence emission techniques excel in revealing the elemental compositions in the topmost layers of a sample. Complementarily, X-ray diffraction (XRD) is suited for studying more quantitatively the phase composition, the structural details of the constituent phases themselves and the characteristic distribution of size and orientation of crystallites. Until now, diffraction has been extensively used and is a common laboratory technique. Nevertheless, it is not used in situ as a quantitative mapping and imaging tool on ‘real’ objects. One reason for this is that XRD studies are often limited by: (i) the width and depth of the probe, (ii) the difficulty in the quantitative interpretation of the diffraction patterns, u Fax: +33-4-76-88-10-38, E-mail:
[email protected]
(iii) the constraining angular alignment of the object analysed and (iv) the diffraction aberrations caused by defects and non-planarity of the surface studied. Thanks to a number of advances in X-ray sources, optics, detection and analysis software [4], many optical aberrations and misalignment errors can be minimised and corrected. The implementation of coupled X-ray microbeam techniques is now possible [5]. The present work is a step forward to exploit the intensities and the breadths of the diffraction peaks and to extract more quantitative information from a ‘real’ object, combining synchrotron-radiation instrumentation and using a semi-automatic procedure for data reduction. The result is that XRD is presented as a quantitative method and an appropriate non-invasive tool for mapping the phase and microstructure distributions on surfaces or bulk (or buried) specimens. The spatial resolution and the energy of the synchrotron X-ray probe can be adapted to the scale and heterogeneity of the material in the mm-to-µm range. No doubt this mapping method opens more paths for the non-destructive investigations of materials in a large variety of applications: soils and sediments, trace elements and pollutants, extraterrestrial matter, artefacts from art and cultural heritage and biological objects. This is also particularly relevant for industry where the understanding of the material properties at the microstructural level becomes increasingly important. The physico-chemical analysis of a polychrome is a difficult issue in archaeological science [6–9]: mixing, overlapping and uneven distribution of different pigments and layers on a solid substrate, large variations of grain size, coating with a surface layer of opaque colours, glazes or varnish, presence of contaminants or pollutants, presence of transformed phases or phases with structural defects. All these features need to be examined quantitatively: they relate to the artist’s intentions and methods, the provenance of the pigments and how they have been prepared, used and possibly transformed with time. The applicability and potentialities of the method are here illustrated in the case of a fresco painting: it consists of a 9 × 12 cm2 mural fragment (end of second century AD), which was excavated from a Roman villa in Pierre Hardie Street in Metz, France (Fig. 2a). Fresco has been used in both Western and Eastern art for at least 4000 years [10]. The Greeks developed the technique to a high level of expertise [11] and their methods spread and continued to prosper through the Roman civilisation [12–14].
664
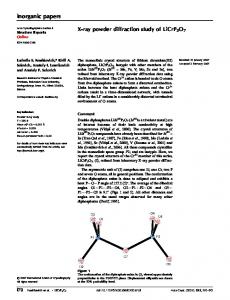
Applied Physics A – Materials Science & Processing FIGURE 1 (a) Experimental set-up: the object was positioned at a low fixed incidence angle ω = 5 ◦ C, and x–y step-scanned with a focused monochromatic beam (0.1 times 1 mm2 , wavelength λ = 0.991 Å). Using the 2D images of relevant mineral references, the diffraction reflection arcs were corrected in position and intensity. At each pixel at the surface of the object is associated a 2D diffraction image (b) before and (c) after corrections. The breadth and intensity distribution of the diffraction rings are related to the microstructure and the texture of the diffracting minerals. Integration in the azimuthal direction improves the signal level and yields a better estimate of the diffracted intensity. (d) Linear diffraction patterns obtained after corrections, integration and projection into the linear 2θ space. The fitting curve using the Rietveld method [16, 17] is shown for one profile: the respective mass fractions of the minerals are extracted from the fit
The art of fresco in Classical times was described by Vitruvius (De Architectura) and Pliny The Elder (Naturalis Historia). The wall is coated with a fresh mortar of lime and sand mixed with finely powdered marble. Coloured pigments are applied while the wall is still damp. As the plaster dries and hardens, carbonation of slaked lime occurs. A layer of calcite crystals forms over the pigments, locking them into the surface, and the colours become one with the plaster. This is what gives fresco its beautiful matt finish and permanence. In dry mural painting (fresco secco or tempera), the presence of an organic binder (egg, casein, animal glue, beeswax or vegetable gum) ensures the adhesion of the pigments on to the wall. The final rendering of colours, tones and shadows critically depends on the preparation of the successive plaster layers and pigments. All elements, such as powder grade or smoothness of coat floating, are important and are determined by the artist’s method and skill. In the current example, the presence of intricate nuances gives the face its lively expression. Natural shades and tones are rendered by complex mixtures of pigments. Some pigments are superimposed or are present in minute quantities, and others may have transformed over time by physical damage or chemical alteration. The current challenge of the advanced physico-chemical analysis is to confer to the image its original features, in terms of composition of the palette, painting technique and artistry. 2
Experimental
The XRD experiment was carried out at the Materials Science beamline ID11 at the European Synchrotron Radiation Facility. The experimental set-up (Fig. 1a) uses a fixed large-area X-ray-sensitive fluorescent screen, mounted on a two-dimensional (2D) CCD camera [15]. Each crys-
talline pigment generates a set of co-axial diffraction cones at discrete 2θ angles, which is intercepted by the large solid angle detector as concentric arcs of rings (Fig. 1a). At each (x, y) position on the object a corresponding 2D XRD pattern is generated from the painting and the substrate. It consists of the superposition of the individual sets of rings or portions of rings, respectively weighted by the scattering power and the amount of each contributing phase (Fig. 1b). The acquisition geometry, and in particular the incidence angle ω, was optimised regarding a number of factors: the penetration depth probed by the X-rays, the spatial resolution (i.e. the pixel size of the diffraction map), the truncation and shadowing of the diffracted beam and the sensitivity to the surface topology. In order to perfectly correlate the elemental and phase maps, both the fluorescence and the diffraction signals can be simultaneously recorded. A large amount of data is thus generated, and a semi-automatic procedure was implemented for data reduction, correction and analysis. Synchrotron radiation beam dimensions in the micrometreto-millimetre range are now routinely achieved, and the pixel size can be varied between 10 and 0.01 mm2 . In the present case, the pixel size, i.e. the footprint of the beam on the exposed surface, is 1 mm2 . Here the chemical/mechanical preparation and the application of the pigment on its support contribute to the graininess and the texturing, respectively. Small grain size (i.e. crystallite size < 0.1 µm) increases the width of the diffraction rings. Texturing occurs when the grains dispersed over the support tend to orientate themselves in some preferred directions. The presence of large grains and the texturing results in the non-uniform distribution of the photon intensity over the diffraction rings. This bias on the overall diffracted intensity is reduced by the azimuthal integration over the arcs of the rings. The integration also helps
´ et al. DOORYH EE
Non-destructive synchrotron X-ray diffraction mapping of a Roman painting
665 FIGURE 2 (a) Photograph of the fragment of a wall painting (museum of Metz, France). The frame shows the analysed zone. The 60 × 60 pixel2 diffraction phase maps of the individual constituents are (b) underlying preparation layer of calcite → Ca; (c) superficial calcite pigment → Ca; (d) haematite → Fe; (e) goethite → Fe; (f) Egyptian blue → Cu; (g) lead carbonate as transformed → Pb. All images (b to g) are obtained by diffraction. (h) Superposition of the Fe, Pb and Cu fluorescence elemental PIXE maps, (i) superposition of the diffraction maps of the individual phases. All individual maps use an arbitrary code of colours. (j) On transposing the colour code of (i), the diffraction-interpreted image reveals the main features of the Cupid’s face
detect weakly scattering or poorly crystalline components, or small amounts of a mineral. The Gallo–Roman mural fragment was also subjected to a proton induced X-ray emission (PIXE) elemental analysis, carried out at the AGLAE accelerator at The Louvre [18]. A 0.05-mm beam of 3-MeV protons is extracted in air through a 0.1-µm-thick Si3 N4 window and impinges on the surface. The proton-induced X-ray fluorescence radiation is emitted at characteristic wavelengths which reveal qualitatively the elemental composition of the top 10 – 20 µm of the painted surface. Elemental 64 × 64 1 mm2 pitch maps are constructed from the intensity of the X-ray radiation lines. PIXE clearly shows the presence of Ca, Fe, Cu and Pb. 3
Results
Figure 1b–d show an example of the reduction of the 2D diffraction rings into one-dimensional powder diffractograms, which represent the diffraction intensity against the diffraction angle 2θ (one pattern per pixel (x, y)). Peak searching and phase identification are performed at that stage. Two procedures have been implemented: either each major single peak of the respective phases present is individually integrated over a relevant region of interest (ROI method), or the entire pattern is fitted using a scale factor for each phase and con-
straining the peak intensities by the structural model of each phase (Rietveld refinement fitting [16, 17], Fig. 1d). The former method gives the individual peak intensities versus the position (x, y) at the surface; the latter gives the global and average scale factors of each phase (proportional to the quantity of pigment deposited) versus (x, y). Both methods give comparable maps. In addition to the mass fractions, the peak broadening is interpreted in terms of grain size and strain from the whole profile fitting. The surface topology of the object (i.e. curvature, rugosity, native defects and imperfections such as steps or holes) varies with the coordinates (x, y), and causes a shift in the apparent position of each diffracting pixel and its corresponding set of diffraction rings. The positions of the calcite and quartz peaks, used as internal references, and the concentricity of the diffraction rings, make it possible to correct for such a positioning error. Hence, a correction map = f(x, y) can be extracted, which reproduces to a first approximation the surface topology. This correction map is used to extract the absolute pixel location in the laboratory frame. In the present case, the XRD maps (Fig. 2) are dominated by the diffraction pattern from the calcite (CaCO3 ) in the plaster and show the non-uniform distribution of embedded quartz (SiO2 ). The diffraction pattern of calcite shows two distinct sub-sets of peaks, giving rise to two different phaseabundance maps. One map shows the uniform presence of cal-
666
Applied Physics A – Materials Science & Processing
cite over the entire area of interest (Fig. 2b). It corresponds to calcium carbonate in both the substrate and the plaster coats, where it is produced by the reaction of lime (CaO) with atmospheric carbon dioxide. In the second map, one sees the contours of the nose and of the left cheek; here a thin topmost calcite layer was used as a white pigment (Fig. 2c). It was superficially laid flat over those parts of the face the artist likely wanted to highlight. The floated pigment exhibits some texture, which in turn enhances the diffraction intensity of a few reflections. The broadened diffraction peak suggests that the calcite was finely ground and subsequently applied over the surface. Therefore, texture and peak breadths of calcite were used here for the separation of two components in the calcite phase. The PIXE elemental maps reveal the abundance of Fe over large areas of the face. In addition, the XRD maps of the crystalline species show the existence of two well-known host phases for Fe: haematite Fe2 O3 and goethite FeO(OH). These phases could not be distinguished from one another by PIXE, since PIXE cannot discern different mineral types with common elements. Haematite is found all over the surface in substantial quantities, and gives the artefact its dominant contours and its red-ochre colour (Fig. 2d). However, the facial expression is rendered through a range of hues and tints which haematite alone cannot produce. We find that the shading of the hair and the shadow over the lip were achieved by the sprinkling of goethite (Fig. 2e). Moreover, cuprorivaïte (CaCu(Si4 O10 )) is detected over the eyelids and in the hair (Fig. 2f). The PIXE Cu map fits well with the XRD cuprorivaïte map. This copper silicate is the main constituent of the so-called Egyptian blue [19], and is commonly found in antiquity. In this painting, the blue eye shadow was not visible to the naked eye (Fig. 2a), and was unexpectedly revealed by both XRD and PIXE. The uneven intensity distribution over the diffraction rings shows the presence of small quantities of large crystallites of cuprorivaïte. The coarsely crystalline Egyptian blue contributed to the colourful and bright aspect of the eye shadow and was used to highlight the Cupid’s expression. In addition, Fig. 2g shows the presence of lead, also observed by PIXE, in two zones: the bridge of the nose and the right-hand corner of the lips. The XRD patterns collected over these zones show additional lines which correspond well with lead magnesium carbonate (PbMg(CO3 )2 ) [20]. This set of diffraction lines is not observed anywhere else on the painted surface. The presence of other common lead forms, in particular PbO2 , cannot be excluded. However the respective diffraction patterns of other lead pigments such as minium (Pb2 O3 ), litharge (PbO), lead carbonate (cerussite, Pb(CO3 )) or white lead (hydrocerussite, 2PbCO3 .Pb(OH)2 [21]) cannot be recognised or are masked by more intense diffraction peaks from the other phases. Rietveld simulations with these phases do not significantly improve the figure of merit of the fits. Interestingly, in a few pixels, the diffraction peaks of the pigment massicot (PbO) [22] are found. This suggests that the original lead pigment, probably yellow massicot, reacted with Mg-containing calcium carbonate to produce lead magnesium carbonate. Magnesium is a frequent impurity in lime, in particular in
dolomitic limestones, which have been a major plastering ingredient. All the individual maps are superimposed and the final reconstructed XRD map is shown in Fig. 2i. Eventually, each elemental pixel is attributed a colour and a hue which follow the mass fraction for each phase as determined by XRD. By transposing the colour code, the scientific image of Fig. 2i is converted into Fig. 2j. For comparison, Fig. 2h shows the superimposition of the individual elemental PIXE maps. 4
Conclusion
The major layers of paint are identified on the fragment of a Roman wall and the image of a Cupid’s face is reconstructed from the fluorescence and diffraction data. Through this example, we demonstrate that both the surface image of an object and its relevant structural and chemical content can be obtained by scanning a focused, intense synchrotron X-ray beam and by recording the XRD patterns and the fluorescence emission (Fig. 2h–j). This is a nondestructive structural fingerprint tool, which makes it possible to identify the powders at, or even below, the surface of an object, even those with elements in common (e.g. Fe2 O3 and FeO(OH)). The relative phase proportions can also be determined from the measured diffracted intensities. Fine details or large areas can be examined on matching the pixel size in the µm–mm range. One can analyse in depth the underlying phases by XRD, by changing the incidence angle or the energy of the incoming beam. Finally, the detailed analysis of the lateral breadth and spatial distribution of intensity over the XRD rings indicates the particle size and the texture of the powder and the intragrain strain [23]. The grain size, orientation and deformation all originate from the processing and history of the material. In the present example, the size, shape and texture of pigment grains are also proved to have an effect on the colour and on the luminosity of the picture, and reveal the artist’s intentions and methods. ACKNOWLEDGEMENTS We thank M. Brion for helping us in the processing of the final images. We also thank E. Anne and C. Deep for comments on the manuscript.
REFERENCES 1 B. Busson, P. Engström, J. Doucet: J. Synchrotron Radiat. 6, 1021 (1999) 2 N. Tamura, R.S. Celestre, A.A. MacDowell, H.A. Padmore, R. Spolenak, B.C. Valek, N. Meier Chang, A. Manceau, J.R. Patel: Rev. Sci. Instrum. 73, 1369 (2002) 3 S. Hlawatsch, C.D. Garbe-Schönberg, F. Lechtenberg, A. Manceau, N. Tamura, D.A. Kulik, M. Kersten: Chem. Geol. 182, 697 (2002) 4 J.B. Hastings, W. Thomlinson, D.E. Cox: J. Appl. Crystallogr. 17, 85 (1984) 5 I. McNulty (Ed.): X-Ray Micro- and Nano-Focusing: Applications and Techniques II (SPIE Proc. 4499) (Bellingham, Washington 2001) pp. 117–125 6 Ph. Walter: In Organic Coatings Proc. of the 53rd Int. Meet. of Physical Chemistry, Paris 1995, ed. by P.-C. Lacaze, University of Paris, AIP Conference Proc., No. 354, p. 503 7 H. B´earat, M. Fuchs, M. Maggetti, D. Paunier (Eds): in Proc. Int. Workshop Roman Painting (Institute of Mineralogy and Petrography, Fribourg 1997) p. 378 8 B. Guineau: Stud. Conserv. 29, 35 (1984) 9 J. Plesters: Stud. Conserv. 2, 110 (1955) 10 R.D. Zuccarini: Sacred Art J. 13, 103 (1992) 11 P. Duell, R.J. Gettens: Tech. Stud. Field Fine Arts 10, 179 (1941)
´ et al. DOORYH EE
Non-destructive synchrotron X-ray diffraction mapping of a Roman painting
12 M. Henig (Ed.): A Handbook of Roman Art (Cornwell University Press, Phaidon 1983) 13 C. d’Andrea Cennini: Il Libro dell’Arte (1437), trans. by D.V. Thompson The Craftsman’s Handbook: The Italian “Il Libro dell’Arte” (Dover, New York 1954) 14 S. Augusti: I Colori Pompeiani (De Luca, Roma 1967) 15 J.C. Labiche, J. Segura-Puchades, D. van Brussel, J.P. Moy: ESRF Newslett. 25, 41 (1996) 16 H.M. Rietveld: J. Appl. Crystallogr. 2, 65 (1969) 17 J. Rodriguez-Carvajal: Physica B 192, 55 (1993)
667
18 T. Calligaro, J.C. Dran, H. Hamon, B. Moignard, J. Salomon: Nucl. Instrum. Methods B 136–138, 330 (1998) 19 J.R. Partington: Origins and Development of Applied Chemistry (Longmans, Green, London 1935) 20 F. Lippmann: Naturwissenschaften 53, 701 (1966) 21 P. Martinetto, M. Anne, E. Dooryh´ee, Ph. Walter, G. Tsoucaris: Acta Cryst. C 58, i82 (2002) 22 M.I. Kay: Acta Cryst. 14, 80 (1961) 23 T. Ung´ar, P. Martinetto, G. Rib´arik, E. Dooryh´ee, Ph. Walter, M. Anne: J. Appl. Phys. 91, 2455 (2002)