Non-Foster Matching Circuit Design via Tunable Inductor for VLF
Recommend Documents
FPGA Programming File in NI c-RIO 9082: For Duty Ratio: D=0.4 and 100 KHz frequency. Module Used: Digital Input Output : NI 9401.
the RF systems can be realized with low power consumption, high frequency range ... feedback [10]. Low noise amplifier (LNA) is the first block of the receiver to .... factor, wide inductive bandwidth, and low power consumption, very less noise ...
CMOS analog circuit design via geometric programming. Maria del Mar
Hershenson. Abstract—This talk presents a new method for optimizing and
automating ...
appear following to the leg shoot- through of one phase, two phases or three phases, this .... 3. 2. 1. 2. 1. Figure 5 Equivalent Circuit of Improved SL Z-source Inverter. ... this makes the two inductors L1 and L3 to be connected in series. On the .
Computer-Aided Analysis of Power Electronic Systems, Venkatachari ...
Transformer and Inductor Design Handbook: Second Edition, Revised and.
Expanded ...
Sep 2, 2013 - 2 ECE Department, ITM University, Gwalior 474001, India ..... ce gm (mS/ m). 105 .... This work was supported by ITM University Gwalior, in.
1 www.cst.com. Whitepaper | CST AG. 2012. Matching circuit optimization for
antenna applications. Impedance matching is an essential part of antenna design
.
3200. 90%. 8%. 2%. 4.97. 430. DE-3. 1600. 50% 40% 10%. 4.99. 397. DE-4. 800 ..... Piddyachiy, D., U. S. Inan, T. F. Bell, N. G. Lehtinen, and M. Parrot (2008),.
We propose an optical circuit design method for coherent waves as a boundary value problem. The method produces a very compact circuit in which the ...
The input and output microwave characteristics are measured by using air coplanar probes (GSG 150;. Cascade Microtech Inc.) and computed controlled vector.
practice in image matching applications. One of the ... [1] that extracts dominant modes from a histogram as a sig- ... resentations, in an image matching task are evaluated and ... 2 Image representation via Gaussian mixture .... Then, the EMD measu
onomies, corporate ontologies), and are then supported in finding relevant ... www.yahoo.com. Arts & Humanities. Photography. Humanities. Chat and Forum.
Jan 30, 2009 - AbstractâWe show how to build an inductorless version of the classic Chua's circuit. The goal is to build Chua's circuit quickly and easily.
Olive H. Murphy 1, Kevin G. McCarthy,1 Christophe Delabie,2. Aidan C. ..... and Thomas H. Lee, âSimple Accurate Expressions for Planar Spiral. Inductances ...
Index TermsâAnalog circuit design, binary decision diagram, design optimization, graph reduction ... analysis was presented in [7], but was limited to small-scale circuits. Symbolic AC sensitivity ... Although it is in principle possible to carry o
these circuits, the output matching network plays a very im- portant role for PAs. ...... in 1997 and the Ph.D. degree from University of Wales,. Cardiff, UK, in 2002 ...
Dec 7, 2009 - mHEMT technology from the OMMIC foundry. We have used the foundry provided models for simulation of the active part (two transistor stages.
AbstractâThe design of high-power inductors for applications with broad current spectrum excitation is a challenging task. The resonant inductor of a resonant ...
This paper proposes a new active synthetic floating resistor circuit employing three voltage differencing transconductance amplifiers (VDTAs). The proposed ...
AbstractâThe Actively Clamped Resonant DC Link Inverter (ACRLI) is a well ... ACRLI; for a medium to high power ACRLI it will be large and may add .... 100. 50. 0. Fig. 3. ACRLI loss and inductor size versus LR. Peak circulating current. Increase .
4Electrical and Electronic Engineering technology department, Jubail Industrial College. Jubai-31961l, Saudi Arabia. 5Institute of Computing and Information ...
Page 1 ... University of Florida for his help with the Forward Converter design equations. .... converter, because it is operating at the fundamental frequency.
Non-Foster Matching Circuit Design via Tunable Inductor for VLF
Oct 1, 2017 - Figure 3: The equivalent circuit of an electrically small antenna; (b) two-port representation ... Figure 4: (a) Series-connected tunable inductor fabricated in the NFC; (b) the simulated and .... One can obtain the following values.
Hindawi International Journal of Antennas and Propagation Volume 2017, Article ID 6198686, 10 pages https://doi.org/10.1155/2017/6198686
1. Introduction Electrically small antennas (ESAs) are a popular research subject because they are the enabling technology for wireless communication applications. ESAs infamously suffer from high radiation quality factor (𝑄) value and a corresponding efficiency-bandwidth tradeoff when using passive impedance matching. Wheeler and Chu [1, 2] provided very useful descriptions of this fundamental tradeoff limit. The limit can be overcome by adding active elements to the antenna’s matching circuit and “non-Foster” elements are particularly effective due to their “negative capacitance” or “negative inductance” characteristics. These negative elements exist only theoretically; an equivalent circuit, for example, negative impedance converter (NIC) or negative impedance inverter (NII or NIV), is necessary to invert the passive capacitor to a negative capacitor or inductor. Several NFC topologies have been reported to date [3–5], most of which were designed for enhanced stability and bandwidth performance. Earlier researchers mainly concentrated studies on the high frequency (HF) band [6–10]. Different NFCs, including CMOS based NFC [11], diode based NFC [12], and amplifier based NFC [13] have been matched to various types of antennas, including the monopole antenna [14],
loop antenna [15], Egyptian axe dipole antenna [16], microstrip leaky-wave antenna [17], and parasitic array [18], with mostly favorable results. Also, negative non-Foster impedances are not absolutely stable circuits which could be a serious problem in practical application; the stability of negative impedances in several circuits was analyzed, including series C-C tank circuit, parallel C-C tank circuit, and series- parallel C-C tank circuit [14, 19]. There are three main obstacles to the practical realization of NFCs. First, little is known about the antennas’ operation frequency band enlargement process, especially below HF. VLF receive loop antennas, which are common in submarines as a signal reception component, are a good example of this. Submarines under water usually receive VLF signal which is transmitted by large VLF transmitting stations; although the VLF signal could go through the water, the signal bandwidth and rate received by the submarine are relatively low. Now, the receive antennas equipped on the submarine are passive antennas, such as trailing wire antennas (about 200 m long) or loop antennas. The bandwidth of the signal is limited by using this type of antennas, so improving the bandwidth and SNR of the received signal is very necessary. To the best of the authors’ knowledge, the only NFC design in VLF was described by Albee [20] from 14 to 38 kHz, where a variable
2
International Journal of Antennas and Propagation 1m
1m
2.5 cm Litz coil (10 circles)
(a)
(b)
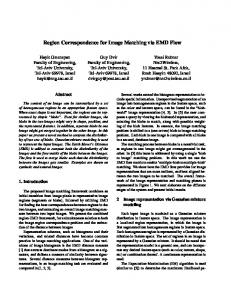
Figure 1: (a) Schematic diagram of rectangle loop antenna with shield case. (b) Photograph of rectangle loop antenna with shield case (valid at a single frequency).
capacitance was matched passively to the antenna and the antenna’s reactance was canceled by a negative reactance generated by a single NFC. This matching circuit can only function at a single frequency or in a small bandwidth as opposed to the whole bandwidth. The second obstacle is the lack of a negative tunable inductor suitable for VLF receive antenna matching. Previous researchers have presented methods in ultrahigh frequency (UHF) [21, 22] and did not address the matching process between the antennas and the tunable NFCs. The third obstacle is the general lack of research on NFC noise and SNR performance; Sussman-Fort and Rudish [5] and Jacob and Sievenpiper [23] provided conflicting results on SNR performance in HF. The present study was to run a noise and gain test on the receiving system to examine the NFC network’s SNR performance in VLF. The results presented below suggest that it is feasible to modify a voltage controlled tunable inductor integrated in NFC for VLF receive antennas. Different VLF receive loop antennas can be applied to the designed NFC by switching each CMOS “on” or “off” as necessary. The noise and gain of the passive and non-Foster matching network were also measured to test the actual SNR performance of the VLF receiving system. All the data was analyzed in the small-signal regime (e.g., receive antennas). The remainder of this paper is organized as follows. Section 2 presents the design and model method of the receive loop antenna. The design topology of the tunable inductor which is integrated in the NFC is presented in Section 3.1; Section 3.2 describes the application of the inductor tunable NFC to the receive antenna in VLF. Section 4 presents the gain, noise, and SNR of the non-Foster network. Section 5 provides a brief conclusion.
2. Antenna Design and Model 2.1. Antenna Design. The influence of a noise source near an antenna can be minimized by selecting the proper electric or
magnetic receive antenna, and the SNR of the antenna can also be improved. For instance, the response of a loop antenna which has a shield case is 30 dB lower than a same effective height whip antenna under a 0.005𝜆 distance from the static noise source (100 m at the frequency of 15 kHz) [24]. A 1 ∗ 1 m rectangle loop antenna with a polyvinyl chloride (PVC) pipe shield case was selected as the VLF receive antenna in this study, the loop antenna was designed by litz wire, the litz wire was circled inside a shield pipe, and the PVC pipe acts as a supporting function of the litz wire. Many circles of litz wire (99 circles per string, 20 strings, and 1980 circles in total) could increase the antenna’s efficient height. Also according to [24], the signal reception antennas which submains usually use are trailing wire antennas or loop antennas, as the trailing wire (around 200 m) is too long for experiment, so when selecting the type of VLF receive antenna, the loop antenna became the first choice. As the antenna is wound with litz wire inside the pipe, it is difficult to model it in electromagnetism (EM) simulation software such as FEKO or HFSS. The impedance characteristics of the designed loop antenna were measured and simulated both in practice and in FEKO; the simulation was nearly 120 h long, and the VLF results differed substantially. We designed a practical VLF receive loop antenna as the measurement target. Its input impedance characteristics, which served as parameters for the subsequent design, were obtained by vector network analyzer (VNA) from 15 to 30 kHz. A schematic diagram of the rectangle loop antenna is shown in Figure 1(a); Figure 1(b) shows a photograph of the antenna. The loop antenna’s inductance was determined by (1) as the Litz coil was being wound [24]: 𝐿𝑎 =
𝜇𝑎𝑛2 𝑝 , 2
(1)
International Journal of Antennas and Propagation
3 −8
0
0.6506
−10 S(2, 1) (dB)
S(1, 1) (dB)
−0.2
−0.4
−12
Inductance (mH)
0.6504
0.6502
0.65
0.6498
−0.6 15
−14 30
20 25 Frequency (kHz)
0.6496 15
S(1, 1) S(2, 1)
20 25 Frequency (kHz)
30
Antenna equivalent inductance Curve fitting (a)
(b)
Figure 2: Loop receive antenna measurement data. (a) 𝑆-parameters of the VLF loop receive antenna; (b) equivalent inductance of the VLF receive loop antenna.
jXa
Z0
Z0
Rl
jXa
Rl N:1
Rr
Port 2
Port 1
(a)
Z0
(b)
Figure 3: The equivalent circuit of an electrically small antenna; (b) two-port representation of an antenna (radiation resistance replaced with a transformer of free space) (valid at a single frequency).
where 𝑎 is the average radius of the coil, 𝑛 is the turns of the coil, and 𝜇 is the permeability of the coil’s material. 𝑝 is related to the form factor 𝑚𝑓 of the loop antenna. 𝑚𝑓 =
𝑠 , 2𝑎
(2)
where 𝑠 is the cross-sectional area of the loop antenna. When 𝑚𝑓 < 0.2, 𝑝 = (1 +
𝑚𝑓 2 6
) ln (
8 ) + 0.41𝑚𝑓 2 − 1.70. 𝑚𝑓 2
(3)
We next obtained the 𝑆-parameters of the loop antenna with a VNA, as shown in Figure 2(a); Figure 2(b) shows the antenna’s equivalent inductance.
2.2. Antenna Model. A two-port antenna model to match the simulated NFC targets was used in the Advanced Design System (ADS) simulation software. The equivalent circuit (valid at specific frequency) of the antenna is shown in Figure 3(a), where [25] 𝑍𝑎 = 𝑅𝑎 + 𝑗𝑋𝑎 = 𝑅𝑟 + 𝑅𝑙 + 𝑗𝑋𝑎 𝑅𝑟 = 𝑒𝑟 𝑅𝑎
(4)
𝑅𝑙 = (1 − 𝑒𝑟 ) 𝑅𝑎 . 𝑍𝑎 denotes the complex input impedance of the antenna, 𝑅𝑟 represents the radiation resistance, 𝑒𝑟 denotes the radiation efficiency, 𝑅𝑙 represents the dissipative loss resistance, and 𝑋𝑎 is the antenna’s reactance.
4
International Journal of Antennas and Propagation −0.9
L1
L2
L3
SW1
SW2
L5
L6
SW3
L7
L4
SW4 L8
Realized inductance (mH)
−0.8 −0.7
SW4: on SW1–SW3: off
SW3: on SW1, SW2, SW4: off
−0.6 −0.5 −0.4 −0.3
SW2: on SW1, SW3, SW4: off SW1: on SW1–SW4: off
−0.2 −0.1 15
20
25
30
Frequency (kHz) Sim Meas (a)
(b)
Figure 4: (a) Series-connected tunable inductor fabricated in the NFC; (b) the simulated and measured inductance of the tunable inductor.
The radiation resistance represents power that is “delivered” by the antenna to the external environment (377 Ω); we replaced the radiation resistance with a transformer to the impedance of free space, or, more conveniently, to any port impedance that we wish (such as 50 Ω). Figure 3(a) can be transformed to Figure 3(b) as a result, where the turns-ratio of the transformer is given by 𝑁=√
𝑅𝑟 . 𝑍0
(5)
As the reactance of the loop antenna in VLF has inductive properties, the equivalent inductance can be derived as follows: 𝐿=
𝑋𝑎 , (2 ∗ 𝜋 ∗ 𝑓)
(6)
where 𝑍0 is the desired port impedance. We set 𝑍0 to 50 Ω in order to match the designed loop antenna. The turns-ratio of the transformer and the equivalent inductance of the antenna can be calculated at each frequency according to (5) and (6). The 𝑆-parameters of the loop antenna obtained can be imported to the two-port network in a specific format (such as dataset or touchstone) in the circuit simulator accordingly. When port 2 of the two-port network is terminated in the system impedance (𝑍0 ), the antenna’s input impedance can be obtained as follows [4]: 𝑍𝑎 = 𝑍0
1 + 𝑆11 . 1 − 𝑆11
(7)
3. NFC Design 3.1. Tunable Inductor. A “tunable-negative-inductive” NFC is necessary to match VLF loop antennas with different equivalent inductance, so a tunable inductance cell should be
designed and fabricated in the NFC. Capacitive frequency tuning in integrated circuits is easily implemented by using varactors or switched-capacitor arrays, but inductive tuning is rarely used because there is no inherently tunable device; the quality factor is usually insufficient compared to capacitors. A voltage controlled tunable inductor which consists of chip winding inductors and MOSFET switches is proposed here, as shown in Figure 4(a). The inductor array is seriesconnected and CMOS switches determine the number of unit inductors. 𝐿 1 –𝐿 7 were set to 0.1 mH and 𝐿 8 was set to 0.08 mH in order to match the designed antenna. When SW4 on, SW1–SW3 off, and 𝐿 1 –𝐿 8 function in the circuit, the inductance of the array was 0.78 mH. When SW3 on, SW1, SW2, and SW4 off, and 𝐿 1 –𝐿 3 and 𝐿 5 –𝐿 7 function in the circuit, the inductance of the array was 0.6 mH. When SW2 on, SW1, SW3, and SW4 off, and 𝐿 1 -𝐿 2 and 𝐿 5 -𝐿 6 function in the circuit, the inductance of the array was 0.4 mH. When SW1 on, SW2–SW4 off, and 𝐿 1 and 𝐿 5 function in the circuit, the inductance of the array was 0.2 mH. Compared to other methods for securing tunable inductors, such as path-short of spiral inductors [26] and polarity switching of a transformer [27], this approach is programmed and area-efficient. Unlike the previously proposed tunable inductor at nH level [22, 23], this inductor can be tuned to mH level, which is suitable for non-Foster matching in VLF. After the inductor array fabricated in the NFC, which is shown as in Figure 5(a), the negative inductance of this NFC was simulated in ADS and measured by LCR meter. There was a significant disparity between the simulated and measured data (Figure 4(b)), especially at small mH levels, because the excitation voltage was only set to 3 V in the simulation to ensure that the transistors in the NFC functioned properly; the excitation voltage is limited to 2 V in the LCR meter. The difference in excitation voltage caused the split between simulation and measurement inductance data.
5
C1 = 0.1 uF
+
−
International Journal of Antennas and Propagation
V_DC = 3.1 V C2 = 0.1 uF R1 = 100 Ohm
R2 = 100 Ohm Port 1
−
L1
+
R3 = 10 kOhm M1
−
L2
+
s
M2
s
L6
M3
s +
−
L4
L5
+
−
L3
s
Port 2
M4
L7
L0
L8
R5 = 80 kOhm R4 = 80 kOhm Port1
Q1
C3 = 1 uF
C4 = 1 uF
Q2
Port2 Inductor cells
Switches
L9 = 0.1 mH R6 = 500 Ohm (a)
(b)
Figure 5: (a) Floating two-port “tunable-negative-inductive” NFC for VLF receive antenna. (b) Photograph of the NFC applied in VLF (45 mm length, 35 mm width).
3.2. NFC Realization. A floating open-circuit stable configuration of Linvill’s NFC, which is shown in Figure 5(a), was implemented with a low-noise NPN silicon bipolar transistor (NEC NE85630) on a standard 1.5 mm thick PCB board (Figure 5(b)), where 𝐿 1 –𝐿 8 and the four NMOS switches constitute the loaded tunable inductor to match different antennas. The transistors were modeled based on their 𝑆parameters, so the performance of the NFC designed according to calculated element values was not ideal. After port 2 of the designed NFC connected to the antenna model, we first calculated the values of 𝑅4 , 𝑅5 [28], and, for better matching performance, the values of 𝑅1 , 𝑅2 , 𝑅4 , 𝑅5 , 𝐿 10 and supply power 𝑉 DC were optimized by genetic algorithm in ADS to account for this. Two objective functions were set in the ADS to optimize control unit. The first one is −20 < abs (imag (𝑍in1)) < 20.
(8)
The second one is −20 < abs (real (𝑍in1) − 50) < 20.
(9)
With the introduction of the two objective functions above, the elements’ values were reconfigured, the input resistance of the matching circuit can be closer to 50 Ω, and the input reactance can be closer to 0 Ω. During the simulation, we found that 𝐿 9 and the load 𝐿 0 were the two most sensitive components in the NFC. 𝐿 9 relates more closely to 𝑆11 of the two-port matching network, which changes 𝑆11 minimum value’s corresponding frequency point. 𝐿 0 determines the magnitude of the minimum
I2
I1 ZCH1 = −KZL2 (K > 0)
+ ZL1
V1 −
Port 1
+ NFC
V2
ZL2
ZCH2 = −KZL1 (K > 0)
− Port 2
Figure 6: Ideal NFC diagram.
𝑆11 value and maximum 𝑆21 value. To this effect, the values of 𝐿 9 and 𝐿 0 should be slightly tuned to ensure favorable NFC performance after optimization in addition to the selection of components in HF. 𝑅3 is mainly used in the control of current mutation situations. 3.3. Stability Analysis. The stability of the NFC is also an important concern. The ideal NFC diagram is shown in Figure 6. One port of an NIC must be an OCS (open-circuit stable) port, with the other port then being SCS (short-circuit stable) [5] in Figure 6. Then with port 1, the OCS port open circuited, and, with any passive impedance terminating port 2, the resulting network will be stable. Of more interest is a corollary to the previous theorem, which may be stated as follows: The inherent conditional stability of an NIC constrains the magnitude of the impedances that can be connected to the OCS port and to the SCS port [5].
6
International Journal of Antennas and Propagation
4. Test and Results
2.2 2.0 Stable factor
1.8 1.6 1.4 1.2 1.0 0.8 14
16
18
20 22 24 Frequency (kHz)
26
28
30
Source stable factor Load stable factor
Figure 7: Stable factor of source and load port of the non-Foster matching network.
This means that, at the OCS port 1, at the very least, the following is required: (10) 𝑍𝐿1 > 𝑍in1 . Similarly, at the SCS port 2, we want 𝑍𝐿2 < 𝑍in2 .
(11)
This indicates that to maintain the stability of the circuit. The absolute –𝐿 (inductance) value produced by the NFC should be greater than the load’s (loop antenna) equivalent inductance value in an OCS condition. In our study, the absolute value of the NFC is about 0.78 mH (Figure 4(b), SW4 on, SW1–SW3 off condition) and the loop antenna’s equivalent inductance is about 0.65 mH (Figure 2(b)), which meets the circuit stability requirement. After the NFC designed, the circuit stability was verified via transient simulation in ADS, which is one of the best approaches to verify stability among the numerical methods based on our experience with NFC circuit measurement. The load and source’s stability can be analyzed in the two-port network. The stability factor of the NFC’s load and source can be expressed as 2 (1 − 𝑆11 ) 𝜇 = (𝑆22 − Δ𝑆11 ∗ + 𝑆12 𝑆21 ) (12) 2 (1 − 𝑆 ) 22 𝜇 = . (𝑆11 − Δ𝑆22 ∗ + 𝑆12 𝑆21 ) Here 𝜇 (𝜇 ) stands for the distance from the center of the smith chart to the nearest unstable-input load (source) stability circle. If 𝜇 > 1 (𝜇 > 1), the nearest load’s (source’s) impedance value is outside the unity reflection coefficient rim of the Smith chart and cannot represent a passive impedance, which means there’s no unstable passive load (source) impedance in this matching network. The designed NFC’s stable factors of source and load are shown in Figure 7. The values of 𝜇 and 𝜇 are greater than one, which means the network is in a stable condition.
The proposed circuit was tested by matching the loop antenna described in Section 2 with equivalent inductance of 0.65 mH. According to the simulation we ran to optimize NFC performance. The negative inductance generated by the NFC can be tuned by changing the inductor cells’ values and the switch numbers, which would allow different antennas to be applied to the NFC in practice. A “best-effort” passive matching network with a resonance frequency of 22.5 kHz was designed for comparison with the non-Foster matching network. The passive matching network is formed by an L network which contains two capacitances, as shown in Figure 8. The values of the capacitances can be obtained not only by existing formulas but also by the control unit Smith Chart Matching in ADS. The latter method is more convenient and precise after comparison. One can obtain the following values of the capacitances when designing a perfect matching at 22.5 kHz, 𝐶1 = 514 nF, 𝐶2 = 84.4 nF. 4.1. 𝑆-Parameter Measurements. The two-port 𝑆-parameters of the matching network were simulated and measured at −30 dBm source power with M1–M3 in the “off” case and M4 in the “on” case by VNA. The simulation scheme is roughly similar to Figure 8; the L network which contains 𝐶1 and 𝐶2 was replaced by the NFC designed. When conducting 𝑆11 measurement, the antenna was connected to port 2 of the NFC through a 50 Ω microstrip line, and port 1 of the NFC was connected to port 1 of the VNA (R&S ZVL). The test setup is shown in Figure 9(a). When conducting 𝑆21 measurement, as the result is not precise to measure 𝑆21 in the VLF near field by using the receive and transmit antenna measuring system (referred in reference [23]), we used 𝐿 𝑎 and 𝑅𝑎 to represent the equivalent model of the antenna and let the signal transfer in electronic component; 𝐿 𝑎 represents the equivalent inductance of the loop antenna and 𝑅𝑎 represents the resistance of the antenna. The values of 𝐿 𝑎 (average 0.65 mH) and 𝑅𝑎 (average 3.5 Ω) at each frequency are obtained by the measured data of the loop antenna in Section 2.1. The test diagram is shown in Figure 9(b). The test setup is shown in Figure 10. The results can be observed from Figure 11(a) that the −10 dB 𝑆11 fractional bandwidth of the NFC loaded case is 18% from 15 kHz to 30 kHz, marking a 383% improve over the passive loaded antenna (4.7%). In ideal situation, if the NFC is replaced by an ideal negative inductor in series with the loop antenna, the bandwidth would be much larger, but Figure 11(a) does not show the same behavior, we indicate that after the transistors, the supply power and other electronic devices joined in, the noise, the transistors’ nonideal bias, and the circuit’s loss all may lead to this “not much larger” bandwidth performance compared with the passive matching case. 𝑆21 of the NFC-enhanced antenna was also compared to that of the passive loaded antenna, as shown in Figure 11(b). Although the signal gain provided by the NFC matching network decreased by 25% maximum at the resonant point, it increased over 15–21.8 kHz and 23.1–30 kHz. Therefore, the NFC-enhanced signal gain is superior to that of the
International Journal of Antennas and Propagation GOAL
Figure 8: The designed passive matching circuit for comparison with the non-Foster matching circuit; the s2p file is the loop antenna model. Genetic algorithm in ADS was used to optimize the values of 𝐶1 and 𝐶2 .
Antenna
Passive/NFC matching
2
Antenna model
2
VNA
La VNA
1
Passive/NFC matching
Ra
1
(a)
(b)
Figure 9: (a) 𝑆11 measurement diagram for non-Foster matched antenna and passive antenna; (b) 𝑆21 measurement diagram for non-Foster matched antenna and passive antenna (the passive matching and non-Foster matching circuit are attached to the antenna, resp.).
DC power
VNA
VNA DC power
NFC
Loop antenna NFC
Antenna model
S11
S21 (a)
(b)
Figure 10: (a) 𝑆11 of NFC matching experiment setup. (b) 𝑆21 of NFC matching experiment setup.
passive loaded case over most frequency bands in VLF (15 kHz–30 kHz). 4.2. SNR Measurements. Non-Foster matching networks can eliminate the gain-bandwidth limitations of passive small antennas, but at the cost of increased noise generated by the
active matching circuit. To assess the SNR of the antenna with the matching circuit, we used basically the same procedure suggested by Sussman-Fort and Rudish [5]; the difference between our method and Sussman’s is that the measurements distance of the Tx/Rx is not the same, as we should conduct the SNR measurement in far filed of the signal, so in the SNR
International Journal of Antennas and Propagation 5
5
0
0
−5
−5
S21 (dB)
S11 (dB)
8
−10 −15
−10 −15 −20
−20 −25 15
20
25
30
−25 15
20
Passive: Sim Passive: Meas
25
30
Frequency (kHz)
Frequency (kHz) Non-Foster: Sim Non-Foster: Meas
Non-Foster: Sim Non-Foster: Meas
Passive: Sim Passive: Meas
(a)
(b)
Figure 11: (a) Comparison of measured and simulated 𝑆11 of NFC and passive matching network under condition of SW1–SW3 off and SW4 on. (b) Comparison of measured and simulated 𝑆21 of the NFC and passive matching network under condition of SW1–SW3 off and SW4 on.
Antenna
Spectrum analyzer
Preamplifier Transmitter
Measure signal level S0 at receiver using antenna with non-Foster matching
Non-Foster matching .& = 4 dB
Spectrum analyzer
Antenna
Preamplifier Transmitter
Measure signal level S1 at receiver using antenna with passive matching
Passive matching .& = 4 dB
Gain improvement (dB) = (S1 − S0 )
Figure 12: Received SNR of a non-Foster matched antenna compared to that of a passive antenna attached to an amplifier.
test in VLF, the Tx and Rx system test distance should be much further compared to the test in HF. The received signal is transmitted from a VLF transmitting station. The noise signal at the antenna input terminal with and without the matching network was measured with a spectrum analyzer (Agilent N9310A) while the transmit signal disappeared. When performing noise measurements, it is very important to be aware of the sensitivity of the receiver, namely, its noise floor (NF). Depending on the noise floor, the noise at the terminals of the antenna with and without a matching circuit may not be detected by the spectrum analyzer, so a low noise preamplifier was attached to the spectrum analyzer to obtain a receiver that had a low NF (4 dB) under matched conditions. For gain measurement, the passive and non-Foster matching circuits were attached to the spectrum analyzer and
subjected to a test outdoors. To access the NFC’s far field performance, when the received VLF signal was transmitted through a VLF transmitting station at fixed time, the signal data was recorded for SNR calculation. The measurement setup is shown in Figure 12. We found that the NFC provided a gain improvement greater than 0 dB (average 1.1 dB) over the whole bandwidth (Figure 13(a)), which suggested that the NFC can enhance the received signal power compared to the passive circuit. The received SNR was calculated according to the difference in gain and noise levels (Figure 13(b)). There was no improvement in the received SNR over 15–30 kHz (average −2.6 dB), which is contradictory to the conclusion provided by Sussman-Fort and Rudish [5] but conforms to Jacob et al.’s [18] conclusion. We found that the NF of the spectrum analyzer used in these two studies was different – the former
−67.5
−100
−68
−110
−68.5
−120
−69 15
20
25
−130 30
Noise power (dBm/Hz)
−90
−67 Realized gain (dBm)
9 Gain and SNR improvement (dB)
International Journal of Antennas and Propagation 2 0 −2 −4 −6 −8 15
20
Frequency (kHz) Passive noise NFC noise
Passive gain NFC gain
25
30
Frequency (kHz) Gain improvement SNR improvement
(a)
(b)
Figure 13: Measurement setup to record (a) gain, noise of passive, and non-Foster matching network and (b) gain, SNR improvement of passive, and non-Foster matching network.
spectrum analyzer has a NF of 8 dB and the latter has a NF of 4 dB. In order to analyze this SNR decrease phenomenon, we noted that the noise received by the spectrum analyzer can be divided into three parts: the generated noise in the NFC, the receiver’s noise, and the environmental noise. The receiver’s noise and the environmental noise are the same between the passive matching case and the NFC matching case. From our results where the realized gain’s improvement is less than the noise improvement, we can prove that, with a higher noise figure (8 dB) amplifier, the NFC noise signal is decreased to an extremely low value that would get masked by the receiver’s noise floor. In our test, we took a 4 dB amplifier connected to the spectrum analyzer; in this case, the NFC noise signal still exits and is higher than the receiver’s noise floor, so the NFC noise dominates. As a result, we got a higher noise figure and a lower SNR compared to the passive matching case. We used the NF analyzer as Jacob and Sievenpiper [23] and reached a similar conclusion. Thus, the non-Foster loaded antenna does not provide SNR improvement over the passive loaded antenna using a low noise figure receiver in VLF.
5. Conclusion In this study, a 1 ∗ 1 m loop antenna was matched by a “tunable-negative-inductive” circuit. A modification to the balanced NFC allowed the circuit to match different antennas in VLF. The −10 dB 𝑆11 fractional bandwidth of the NFC loaded antenna was improved by 383% and the signal gain was improved over most bands compared to the passive loaded antenna. The realized gain was also improved by an average of 1.1 dB over 15–30 kHz. Gain and noise measurement results further indicated that the NFC loaded antenna exhibited no SNR advantage over the passive loaded antenna with an amplifier. As non-Foster receiving systems provide an SNR advantage over passive systems only in cases where the system is device-noise limited, or when the receiver noise is dominant, the noise generated by the NFC would be masked by the receiver’s noise floor and does not affect the overall
system noise figure. Therefore, our results indicate that the non-Foster matching circuit can provide a larger bandwidth and gain in low noise receive systems but may not provide any actual SNR performance advantage over passive matched antennas in VLF.
Conflicts of Interest The authors declare that there are no conflicts of interest regarding the publication of this paper.
References [1] H. A. Wheeler, “Fundamentals limitations of small antennas,” Proceedings of the IRE, vol. 35, no. 12, pp. 1479–1484, 1947. [2] L. J. Chu, “Physical limitations of omni-directional antennas,” Journal of Applied Physics, vol. 19, no. 12, pp. 1163–1175, 1948. [3] C. R. White, J. S. Colburn, and R. G. Nagele, “A non-foster VHF monopole antenna,” IEEE Antennas and Wireless Propagation Letters, vol. 11, pp. 584–587, 2012. [4] J. T. Aberle, “Two-port representation of an antenna with application to non-foster matching networks,” IEEE Transactions on Antennas and Propagation, vol. 56, no. 5, pp. 1218–1222, 2008. [5] S. E. Sussman-Fort and R. M. Rudish, “Non-foster impedance matching of electrically-small antennas,” IEEE Transactions on Antennas and Propagation, vol. 57, no. 8, pp. 2230–2241, 2009. [6] R. W. Ziolkowski, M.-C. Tang, and N. Zhu, “An efficient, broad bandwidth, high directivity, electrically small antenna,” Microwave and Optical Technology Letters, vol. 55, no. 6, pp. 1430–1434, 2013. [7] K. A. Obeidat, B. D. Raines, and R. G. Rojas, “Application of characteristic modes and non-foster multiport loading to the design of broadband antennas,” IEEE Transactions on Antennas and Propagation, vol. 58, no. 1, pp. 203–207, 2010. [8] T. Debogovi´c, S. Hrabar, and J. Perruisseau-Carrier, “Broadband Fabry-P´erot radiation based on non-Foster cavity boundary,” IEEE Electronics Letters, vol. 49, no. 4, pp. 271-272, 2013. [9] M. Barbuto, A. Monti, F. Bilotti, and A. Toscano, “Design of a non-foster actively loaded SRR and application in
10
[10]
[11]
[12]
[13]
[14]
[15] [16]
[17]
[18]
[19]
[20] [21]
[22]
[23]
[24] [25] [26]
International Journal of Antennas and Propagation metamaterial-inspired components,” IEEE Transactions on Antennas and Propagation, vol. 61, no. 3, pp. 1219–1227, 2013. F. Albarrac´ın-Vargas, E. Ugarte-Mu˜noz, V. Gonz´alez-Posadas, and D. Segovia-Vargas, “Sensitivity analysis for active matched antennas with non-foster elements,” Institute of Electrical and Electronics Engineers. Transactions on Antennas and Propagation, vol. 62, no. 12, pp. 6040–6048, 2014. A. Niang, A. de Lustrac, and S. N. Burokur, “Superluminal wave propagation in a non-Foster negative capacitor loaded transmission line,” Electronics Letters, vol. 53, no. 8, pp. 547–549, 2017. D. S. Nagarkoti, Y. Hao, D. P. Steenson, L. Li, E. H. Linfield, and K. Z. Rajab, “Design of broadband non-foster circuits based on resonant tunneling diodes,” IEEE Antennas and Wireless Propagation Letters, vol. 15, pp. 1398–1401, 2016. H. Yang, I. Kim, and K. Kim, “Non-foster matching of a resistively loaded vee dipole antenna using operational amplifiers,” Institute of Electrical and Electronics Engineers. Transactions on Antennas and Propagation, vol. 64, no. 4, pp. 1477–1482, 2016. H. Mirzaei and G. V. Eleftheriades, “A resonant printed monopole antenna with an embedded non-foster matching network,” IEEE Transactions on Antennas and Propagation, vol. 61, no. 11, pp. 5363–5371, 2013. T. K. Albee, “Broadband VLF loop antenna system,” U.S. Patent 3953799 (1976). M.-C. Tang, N. Zhu, and R. W. Ziolkowski, “Augmenting a modified egyptian axe dipole antenna with non-foster elements to enlarge its directivity bandwidth,” IEEE Antennas and Wireless Propagation Letters, vol. 12, pp. 421–424, 2013. D. Muha, S. Hrabar, I. Krois, I. Boni´c, A. Kiricenko, and D. Zaluˇski, “Design of microstrip non-foster leaky-wave antenna,” in Proceedings of the 21st International Conference on Applied Electromagnetics and Communications, ICECom 2013, pp. 1–3, hrv, October 2013. M. M. Jacob, J. Long, and D. F. Sievenpiper, “Non-Foster loaded parasitic array for broadband steerable patterns,” Institute of Electrical and Electronics Engineers. Transactions on Antennas and Propagation, vol. 62, no. 12, pp. 6081–6090, 2014. A. M. Elfrgani, R. Moussounda, and R. G. Rojas, “Stability assessment of non-Foster circuits based on time-domain method,” ET Microwaves, Antenna & Propagation, vol. 9, no. 15, pp. 1769–1777, 2015. T. K. Albee, “Submarine communication antenna system,” U.S. Patent 3528014 (1966). C. R. White, J. W. May, and J. S. Colburn, “A variable negativeinductance integrated circuit at UHF frequencies,” IEEE Microwave and Wireless Components Letters, vol. 22, no. 1, pp. 35–37, 2012. S. Saadat, H. Aghasi, E. Afshari, and H. Mosallaei, “Low-power negative inductance integrated circuits for GHz applications,” IEEE Microwave and Wireless Components Letters, vol. 25, no. 2, pp. 118–120, 2015. M. M. Jacob and D. F. Sievenpiper, “Gain and Noise Analysis of Non-Foster Matched Antennas,” IEEE Transactions on Antennas and Propagation, vol. 64, no. 12, pp. 4993–5004, 2016. L. Chao, “VLF Communications,” Bei Jing: Tide Press, pp. 99100, 2008. R. S. Elliot, Antenna Theory and Design, John Wiley & Sons, 2006. S.-M. Yim and K. K. O, “Demonstration of a switched resonator concept in a dual-band monolithic CMOS LC-tuned VCO,”
Proceedings of the Custom Integrated Circuits Conference, pp. 205–208, 2001. [27] S.-J. Yun, H. D. Lee, K.-D. Kim, S.-G. Lee, and J.-K. Kwon, “A wide-tuning dual-band transformer-based complementary VCO,” IEEE Microwave and Wireless Components Letters, vol. 20, no. 6, pp. 340–342, 2010. [28] CEL, “NPN RF Transistor NE856 Series,” 2005.