Proceedings of the Institute of Acoustics
NON-LINEAR DECAYS IN SIMPLE SPACES AND THEIR POSSIBLE EXPLOITATION Mike Barron
1
Fleming & Barron, Combe Royal Cottage, Bathwick Hill, Bath BA2 6EQ
[email protected]
INTRODUCTION
Standard room acoustic theory is based on the assumption that the sound field is diffuse. Yet in auditoria one might consider the likelihood of a diffuse sound field to be remote, since nearly all the absorption is on only one of the six principle surfaces, the floor. In practice, the situation regarding diffusion in auditoria is generally less extreme than this thought might suggest. However, spaces with poor diffusion are not uncommon, which often means that the Sabine or Eyring reverberation time equations do not predict accurately. In such situations, one is usually dealing with non-linear decays, so that even quantifying the measured situation becomes difficult. The traditional methods for measuring reverberation time (such as T20 and T30) may be of questionable validity with non-linear decays. This paper considers first the question of quantifying the situation in spaces with poor diffusion. The subsequent discussion is concerned with the physical requirements for auditorium spaces to exhibit non-linear behaviour and how that might be valuable in certain multi-purpose halls. Four auditorium spaces will be reviewed: two scale model spaces, a real auditorium with non-linear behaviour and fourthly rectangular shoebox halls.
2
QUANTIFYING DIFFUSION AND NON-LINEAR DECAYS
Measuring the state of diffusion in a space is problematic and for practical purposes looking at the consequences on standard measures is likely to be more productive. There are three simple consequences that may be relevant: • • •
The linearity of sound decays The agreement between measured and calculated reverberation times The spread of reverberation time measured at different positions
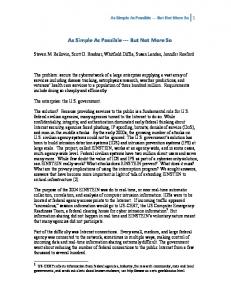
In a diffuse sound field we can expect a linear decay beyond the first few decibels of the decay. Non-linear decays are usually associated with poor diffusion or coupled volumes. With a non-linear decay, one does need to question the validity of reverberation time measurements, such as T20 etc.! Measuring a non-linear decay is not trivial. If the decay is curved, it is usually sagging with a steeper initial slope; one could in principle measure the curvature but additional information is required regarding actual rates of decay. If one is lucky, one has two principal rates of decay, in other words a double slope decay with an initial decay rate (and RT) and a terminal decay rate. Figure 1 shows a measured decay with a terminal decay. With a double slope decay, the time or level at which the slope changes is also relevant. The agreement between measured and calculated reverberation times requires little comment, other than that its validity is dependent on accurate absorption coefficient data. The Sabine/Eyring
Vol. 34. Pt.2 2011
Proceedings of the Institute of Acoustics
EDT
Terminal RT Slope of T30
Figure 1. Measured decay in a scale model. The green line indicates the EDT, the blue line the slope of the T30 value and the red line the slope of the terminal decay. equations ignore the location of absorbing material and the degree of scattering by surfaces, which are both known to influence reverberation time. Comparing reverberation times also assumes that the decays are sufficiently linear for the measurement of RT to be valid! The spread of reverberation time with measurement position can be assessed by the standard 1,2 deviation (SD). Davy and colleagues have proposed theoretical equations for the scatter of measured reverberation time. When using the integrated impulse method to measure reverberation time, the following are appropriate for a 20 dB octave band decay (the number of measurements, n, has been taken as ∞): Standard deviation, σ(T20 ) = 0.88
T20 = 1.0 B
T20 fc
s
where B is the frequency bandwidth and fc is the octave band centre frequency. Here, on Davy’s 3 th advice , the bandwidth has been replaced with the statistical bandwidth which for the 5 order Butterworth filters used in this research is 11% greater. This theoretical value can be used to calculate a Normalised Standard Deviation of Reverberation Time (NSDRT): Measured st. deviation Normalised s tan dard deviation = Theoretical st. deviation We can expect a value for the NSDRT close to unity in a diffuse sound field, with higher values for non-diffuse fields. The application of this parameter in rooms other than reverberation chambers was first discussed by the author in reference 4.
3
EXPERIMENTS IN A MODEL CONCERT HALL 5
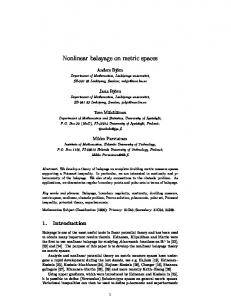
Measurements have been made in a 1:25 scale model of a rectangular concert hall, Figure 2. The internal dimensions of the model were length 45m, width 22m and height 18.2m, giving an internal 3 volume of 18,000m . The model included a raised stage containing a model orchestra and correctly modelled seating on a raked floor. A single source position was used on stage. The walls and ceiling contained removable panels so that tests could be made with scattering or plane walls and Vol. 34. Pt.2 2011
Proceedings of the Institute of Acoustics
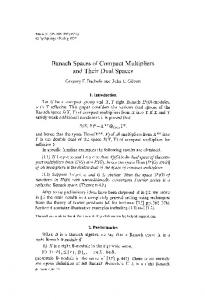
ceiling. Figure 3 shows measured decays for the two extreme configurations: all surfaces plane and all surface panels scattering. With plane surfaces (labelled flat) the decay is far from linear, whereas as we would expect the scattering surfaces result in linear decays.
Figure 2. Interior of the 1:25 concert hall with most surfaces with scattering panels. The balcony was omitted for the measurements reported. 0
Level, dB
-10
-20
flat
-30
scattering
-40
0
0.5
1
1.5 Tim e, s
2
2.5
3
Figure 3. Measured decays in the concert hall model with all plane surfaces (flat) and all panels 5 scattering . 5
One of the big surprises of initial tests in this model by Chiles was that making the ceiling scattering while other surfaces remained plane had very little influence on the non-linearity of decays. This was further brought out when values of the Normalised Standard Deviation of Reverberation Time 4 (NSDRT) were plotted , as defined in section 2 above. Further experiments in the same model by 6 Green in similar circumstances confirmed these results, Figure 4. One observes that at 500 and 1000 Hz, the values of the NSDRT are virtually identical for configurations Pl (all walls and ceiling plane) and Cl (all walls plane, scattering ceiling). The lowest values of the NSDRT, all close to unity, occur with configuration Sc (all surfaces scattering). Values of NSDRT are reasonably close to unity for the other configurations, which all include scattering surfaces on the walls.
Vol. 34. Pt.2 2011
Proceedings of the Institute of Acoustics
Figure 4. NSDRT for configurations with 8 scattering panels on ceiling (Cl), around stage (St), around the rear (Rr) and on side walls (Sw). Values for no scattering panels (all plane Pl) and all 6 scattering panels (Sc) configurations are also included (after Green ). The ratio of theoretical (Sabine equation) to measured reverberation times (T20) also back up this conclusion concerning the limited value of a scattering ceiling, Table 1. Configuration Pl Cl Sc
Conditions All walls and ceiling plane All walls plane, ceiling scattering All walls and ceiling scattering
Theoretical/Measured T20 0.57 0.62 0.95
Table 1. The ratios between theoretical (Sabine equation) and measured (T20) reverberation times 6 for configurations Pl, Cl and Sc, as labelled in Figure 4 (after Green ). Ratio values are the means for the 500Hz and 1000Hz octaves. 6
In fact, Green found linear relationships between the theoretical/measured RT ratios and the NSDRT, when values were compared for 13 configurations in the 500Hz and 1000Hz octaves. Thus two of the methods of quantifying non-diffuse behaviour are related to one another, an encouraging result. The observation that a scattering ceiling does not contribute to diffusion in a space with plane walls implies that the reverberation time is being extended because of a horizontal sound field which does not involve reflection off the ceiling. Sound travelling in a plane above the seating is being reflected by walls only and this 2-dimensional reverberation is responsible for the extended terminal decay. Such a non-linear decay might be valuable in multi-purpose halls.
4
EXPERIMENTS IN A MODEL LECTURE THEATRE
Measurements have also been conducted in a smaller 1:25 scale model, Figure 5. The plan dimensions were 22 x 13 m, with a flat ceiling which could be placed at different heights, principally 6 and 8 m. Either a flat floor or a raked floor were available. As seen in Figure 5, due to availability a mixture of bench seats and seated model people were used, in each case close matches of full size seating and people regarding absorption. The seat capacity was 300. Measurements were made with a central spark source 2 m from the stage front. All surfaces other than the seating were plane, apart from small angled reflectors ‘opposite’ the source to suppress flutter echoes. Though this model has been labelled a lecture theatre, with a flat floor in particular it would be similar to small village or school halls. The aims with this model were to investigate the state of diffusion in Vol. 34. Pt.2 2011
Proceedings of the Institute of Acoustics
the space and whether there was scope for intelligible speech with a terminal reverberation time longer than normally used in a space for speech.
Figure 5. Overhead view of the lecture theatre model with a raked floor and model seating/people. On the right is a viewing window. The disc on stage is the spark source, to the left of the source is th a temperature/humidity probe (used for correction for air absorption). In the 6 row, left of centre, is the raised reference microphone. 7
For this space, Kissner undertook both scale model studies and analysis with the computer simulation program CATT. As an objective measure for speech intelligibility, the 50 ms early energy 8 fraction (eef) was used, values in excess of 0.5 are considered adequate . For the condition with a raked floor and seating/audience, the following results relevant to this discussion were achieved: • •
Reverberation times (T20) were about 20% higher than predicted by the Sabine equation and by CATT. CATT predicted both the reverberation time and eef at individual positions accurately, in spite of the non-linear decays.
Given that CATT predicted the above situation correctly, further trials were conducted using CATT to investigate achieving suitable speech intelligibility (eef > 0.5) at 14 different seat locations. Absorbing treatment was added until this was achieved. Table 2 lists the calculated reverberation times to achieve this. These values are based on the slope of the best fit line between the limits in nd the 2 column. Measure EDT (Early decay time) T15 (RT measured over 15 dB) T30 (RT measured over 30 dB) Sabine prediction
Level range (dB)
Reverberation time (s)
0 to 10 -5 to -25 -5 to -35
1.28 1.51 1.64 1.05
Table 2. Average reverberation times in the model to achieve speech intelligibility at all positions. The significant difference between T20 and T30 indicates a non-linear decay. A similar decay from the same model is shown in Figure 2. In the case of the T30 slope, it is clear that there is a poor fit for a straight line with the curved decay, but the T30 value is just a best fit. It represents the decay Vol. 34. Pt.2 2011
Proceedings of the Institute of Acoustics
rate in this case at a level of around -25 dB. The potential value of non-linear behaviour like this is that a space could be used for unassisted speech, but without the same degree of starkness for music which is characteristic of a short (linear) reverberation time.
Source
Figure 6. Section through the lecture theatre model with the 8 m high ceiling, including a sound ‘ray’ according to geometrical acoustics. Figure 6 shows a long section through a rectangular hall, which happens to be the lecture theatre model. It demonstrates an interesting issue regarding possible horizontal sound fields below the ceiling. As illustrated, according to geometric acoustics for a sound ‘ray’ to reach the ceiling it has to rise from the source, and the slope relative to the horizontal remains constant in magnitude. One could introduce a tilted panel on the wall just above the audience in the back row, but according to geometrical acoustics a horizontal sound field between vertical surfaces cannot be generated!
5
THE STADTHALLE, GÖTTINGEN, GERMANY
This multi-purpose space was opened in 1964, with the III Physikalisches Institut of Göttingen 9 3 University acting as acoustic consultants . It seats 1250 in a volume of 8,200 m , which works out 3 at 6.6 m /person. The ceiling height is 12m. Because of the varied uses for the hall, which included orchestral concerts, theatre, conferences and social events, the main floor is flat, while there is a single balcony. Figure 7 shows an internal view of the Stadthalle. The plan is a regular hexagon, with a stage off one side, Figure 8. The walls are plane, whereas the ceiling is covered with pyramids 300 mm deep intended to promote diffusion. (A similar ceiling was used in the 8,10 Beethovenhalle, Bonn of 1959 .)
Figure 7. Internal view of the Göttingen Stadthalle viewed from the stage.
Vol. 34. Pt.2 2011
Proceedings of the Institute of Acoustics
9
Figure 8. Long section and plan of the Göttingen Stadthalle . Around the 1960s, concert halls tended to have reverberation times shorter than expected; the consultants were surprised to discover that, instead of the predicted occupied reverberation time 9 (RT) of 1.6s, the measured value at mid-frequencies was around 2.0s, a 25% increase . A high proportion of the decays were sagging and higher reverberation times were measured near the ceiling than in the Stalls. Extensive measurements were made in both the actual hall and in a 1:15 11 scale model . These established that a horizontal sound field was developing in the upper region of the hall with sound reflecting between the plane vertical walls; it was little influenced by the absorbing audience and scattering ceiling. For sound to reach this region of the hall, reflection off the balcony fronts and the risers of the steps which linked the Stalls with the Balcony were isolated. Figure 9 shows the results of RT measurements in the unoccupied hall first in the condition as built, then with absorption applied to the central balcony front, thirdly absorption on the whole length of balcony front and then the stair risers as well. The authors point out that absorbing material is more effective than geometrical changes (such as inclining the balcony fronts or making them scattering) because the former is unaffected by diffraction. One notes that making the ceiling highly scattering did not result in a diffuse sound field. The predicted occupied RT had been chosen as a compromise value for multi-purpose use. A value of 1.6s was considered to be the lower limit for orchestral music, while being acceptable for conference use. Figure 9 however shows that not only is the reverberation time longer than expected but that it is possible to reduce it by treating only a small surface area – in other words, variable acoustics had been created.
Vol. 34. Pt.2 2011
Proceedings of the Institute of Acoustics
11
Figure 9. Measured reverberation times in the unoccupied Stadthalle, Göttingen . x
x, as built; , with absorption on central balcony front; , with absorption over whole balcony front; , with absorption over whole balcony front and stair risers.
On a theoretical note, the modelling paper (T seconds):
11
includes a formula for 2 dimensional reverberation time
T = 0 ⋅ 128
S − L ln(1 − α )
where S is the plan surface area, L is the perimeter length and α is the length weighted mean 12 absorption coefficient. This formula is derived by using the 2D mean free path, πS/L . 9
The consultants report that comments on the acoustics of the hall from both audience and performers had only been positive. The hall was also praised for use for opera and chamber music. Users appear not to be concerned by sound persisting which arrives from above.
6
SOUND BEHAVIOUR IN TRADITIONAL SHOEBOX CONCERT HALLS
Many traditional shoebox concert halls have a significant height between the highest audience seat and the ceiling, a good example is Boston Symphony Hall, Figure 10. This is considered to have the objective effect of increasing the reverberation time, due to the horizontal sound field which 14 builds up in the region close to the ceiling. Beranek has quantified this by calculating appropriate absorption coefficients for audience and unoccupied seating in rectangular and non-rectangular halls. The distinction is more precisely between halls with modest seating rakes and significant vertical walls below the ceiling and those halls with steep seating rakes and short distances between seating and the ceiling. The latter are predominantly surround and terraced concert halls, 8 the best known being the Berlin Philharmonie . The relatively small seating blocks separated by reflecting surfaces as found in terraced halls contribute to more diffuse sound fields. Octave frequency: Rectangular halls Non-rectangular halls
500Hz 0.79 0.85
1000Hz 0.85 0.89
Table 3. Mean mid-frequency absorption coefficients for occupied seating as a function of hall 14 shape .
Vol. 34. Pt.2 2011
Proceedings of the Institute of Acoustics
13
Figure 10. Long section of the Boston Symphony Hall, Massachusetts, USA . 14
The absorption coefficient values proposed by Beranek are given in Table 3; the average reduction in absorption coefficient in rectangular halls at mid-frequencies is 6%. Using the figures in 13 Table 3 on data for the Boston Symphony Hall , these different absorption coefficients would result in the predicted occupied RT being reduced from 1.85 s to 1.77 s, a 4.5% reduction, if the hall were placed in the non-rectangular category. It is interesting to consider the scattering properties of the upper surfaces in a hall like Boston Symphony Hall. The walls are moderately profiled with quite deep niches containing statues, whereas the ceiling is coffered with a depth of about 440 mm. This degree of scattering appears to allow a horizontal sound field below the ceiling, as opposed to creating a fully diffuse sound field.
7
SUBJECTIVE RESPONSE TO NON-LINEAR DECAYS AND POOR DIFFUSION
The linearity of a decay is relatively easy to establish but what about detection by our ears? It appears that our subjective abilities at detecting non-linearity are quite limited as such. As long as what we hear does not sound unnatural, it appears to be acceptable. However when non-linear decays are associated with poor diffusion and reverberation arrives from distinct directions, this may be detected. This is a potential problem with the introduction of reverberation chambers around a concert hall auditorium. Reverberation chambers result in double slope decays, with a longer terminal reverberation time. If the chambers are placed at high level, for instance, the arrival of sound from this region may be detected and be distracting, particularly when there is a pause in the music.
8
CONCLUSIONS •
Several examples of auditoria which generate non-linear decays have been discussed. In each case, an extended terminal decay seems to be associated with a horizontal sound field below the ceiling, which involves reflection off vertical walls.
•
To quantify the state of diffusion, the Normalised Standard Deviation of Reverberation Time (NSDRT) appears to be a useful parameter.
•
Our ears appear to be relatively insensitive to non-linear decays unless directional cues are present.
Vol. 34. Pt.2 2011
Proceedings of the Institute of Acoustics
•
Non-linear decays have the interesting potential of offering multi-purpose acoustics for spaces which, for instance, have to offer intelligible speech but are also used for unamplified music. Community and school halls come to mind as suitable for this approach.
•
The design requirements to create horizontal sound fields at high level are not trivial and deserve further investigation.
9
REFERENCES
1.
J.L. Davy, I.P. Dunn and P. Dubout ‘The variance of decay rates in reverberation rooms’, Acustica 43, 12-25 (1979).
2.
J.L. Davy ‘The variance of impulse decays’, Acustica 44, 51-56 (1980).
3.
J.L. Davy and I.P. Dunn ‘The statistical bandwidth of Butterworth filters’, J. Sound Vib. 115, 539-549 (1987).
4.
M. Barron ‘Thoughts on the room acoustic enigma: the state of diffusion’, Proceedings of the Institute of Acoustics, Vol. 27, Pt. 2 (2005).
5.
S. Chiles. ‘Sound behaviour in proportionate spaces and auditoria’. Ph.D thesis, University of Bath (2004).
6.
E. Green ‘Scale model analysis of a rectangular concert hall with variable diffusion’, MSc dissertation, Institute of Sound and Vibration Research, University of Southampton (2011).
7.
S. Kissner ‘The limits of intelligibility speech in medium-sized multi-purpose spaces’, Bachelor dissertation, Institut für Hörtechnik und Audiologie, Jade Hochschule, Oldenburg, Germany (2009).
8.
M. Barron Auditorium acoustics and architectural design, 2
9.
E. Meyer and H. Kuttruff ‘Über einige raumakustische Beobachten in der neuerbauten Stadthalle zu Göttingen’, Acustica 15, 301-303 (1965).
10.
E. Meyer and H. Kuttruff ’Zur akustischen Gestaltung der neuerbauten Beethovenhalle in Bonn’, Acustica 9, 465-468 (1959).
11.
E. Meyer, H. Kuttruff and N. Roy ‘Raumakustische Untersuchungen an einem Modell der Stadthalle in Göttingen’, Acustica 19, 132-142 (1967).
12.
C.W. Kosten ‘The mean free path in room acoustics’, Acustica 10, 245-250 (1960).
13.
L.L. Beranek Concert halls and opera houses: Music, acoustics and architecture, 2 edition. Springer, New York (2004).
14.
L.L. Beranek ‘Analysis of Sabine and Eyring equations and their application to concert hall audience and chair absorption’, J. Acoust. Soc. America 120, 1399-1410 (2006).
nd
edition, Spon, London (2010).
nd
Vol. 34. Pt.2 2011