Image Classification into Object / Non-object Classes 1
2
Sungyoung Kim , Sojung Park , and Minhwan Kim 1
2
School of Computer Engineering, Kumoh National Institute of Technology, Gumi, Korea
[email protected] 2 Dept. of Computer Engineering, Pusan National Univ., Pusan, Korea {sokkobi, mhkim}@pusan.ac.kr
Abstract. We propose a method that automatically classifies the images into the object and non-object images. An object image is an image with object(s). An object in an image is defined as a set of regions located near the center of the image, which has significant color distribution compared with its surrounding (or background) region. We define three measures for the classification based on the characteristics of an object. The center significance is calculated from the difference in color distribution between the center area and its surrounding region. Second measure is the variance of significantly correlated colors in the image plane. Significantly correlated colors are first defined as the colors of two adjacent pixels that appear more frequently around center of an image rather than at the background of the image. The last one is the edge strength at the boundary of the region that is estimated as an object. To classify the images we combine each measure by training the neural network. A test with 900 images shows a classification accuracy of 84.2%. We also compare our result with the performance of several other classifiers, Naïve Bayes, Decision Table, and Decision Tree.
1 Introduction In content-based image retrieval (CBIR), images are automatically indexed by summarizing their visual contents, and are searched and matched usually based on low-level features such as color, texture, shape, and spatial layout. However, we know that there is obvious semantic gap between what user-queries represent based on the low-level image features and what the users think. To overcome the semantic gap, many researchers have investigated techniques that retain some degree of human intervention either during input or search thereby utilizing human semantics, knowledge, and recognition ability effectively for semantic retrieval. These techniques called relevance feedbacks are capable of continuous learning through run-time interaction with end-users. Semantic feature finding approaches have been also studied, which tried to extract semantic information directly from images. Automatic classification of scenes into general types such as indoor/outdoor or city/landscape [13] is an example of utilizing the semantic information. On the one hand, many researchers believe that the key to effective CBIR performance lies in the ability to access images at the level of objects because users generally want to search for the images containing particular object(s) of interest. Thus, it may be an important step in CBIR to determine whether there is an object(s) P. Enser et al. (Eds.): CIVR 2004, LNCS 3115, pp. 393–400, 2004. © Springer-Verlag Berlin Heidelberg 2004
394
S. Kim, S. Park, and M. Kim
in an image. An object / non-object image classification can improve retrieval performance by filtering out images that are classified as another class. For example, when a user wants to retrieve ‘tiger’ images, the category to be retrieved can be restricted to the object image class only. The object / non-object image classification can be also utilized for the pre-process of object-based applications, such as the extraction of objects from object class images [4, 5] and the classification of object types to improve image retrieval performance [6]. An object image can be characterized by the presence of object(s). However, determining an object of interest in an image is an unresolved issue [5]. It is subjective to determine the object of interest on which user’s attention is concentrated. For example, a reddish rising sun with a significant size and salient color distribution in an image can be regarded as an object. However, a meridian sun which has a small size in the image corner may not be an object. The sun may not be an object of interest when a sun is treated as an object. Then, is the sunrise image an object image? The sunrise image is assumed to be an object image when the sun in the image is treated as an object. In this paper, we propose a method that automatically classifies images into the object and non-object image classes. Generally an object in an image can be defined as a region located near the center of the image, which is characterized as having significant color distribution compared with its surrounding region. The characteristic region tends to be not elongated and to have strong boundary against the surrounding region. Thus we defined three measures based on the characteristics of an object in an image. The first measure is called a center significance that indicates color significance of image center area against its surrounding region. The center area is defined as the region in the center 25% of an image [4]. The second measure is to describe horizontal or vertical distribution of significant pixels in image plane. The significant pixels indicate the pixels that have significant color. Their horizontal and vertical variances are first computed and the larger one is defined as the second measure. The third measure is defined as average edge strength of boundary pixels of a central object [4]. The neural network technique is used for combining the three measures effectively.
2 Definition of Object An object in a color image tends to satisfy the following conditions. (1) It is located near center of the image, (2) It has significant color or texture characteristics against its surrounding area, (3) Its size is relatively big, (4) Its boundary pixels have relatively strong edginess, (5) It has restricted shape, and (6) It is related to a specific semantic key word. It was shown that conditions (1)-(4) were useful to describe objects in ref. [4]. Through the evaluation on the location and size of the manually extracted objects, it was showed that the objects of interest are often located near the center of image. The objects could be displaced from the image center to one of image border directions by some extent. On the one hand, an object with no salient color distribution in a low resolution image or protective colors could be discarded.
Image Classification into Object / Non-object Classes
395
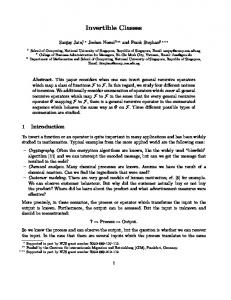
There are two additional conditions to clearly distinguish object images from nonobject images. Condition (5) discards some objects whose shapes can be temporarily changeable because they are not interesting objects to us usually. For example, we are not interested in clouds in an image. Condition (6) is obvious even though it cannot be measured easily. Fig. 1(a) and (b) show the objects that can be assigned with key words, tiger and waterfall, respectively. Note that the tiger is clearly a meaningful object. Furthermore, the waterfall can be object because it is a salient region and satisfies our conditions. Thus these two images can be classified into object class image. However, the image in Fig. 1(c) does not have any meaningful region in center of the image, so it is a nonobject image. On the one hand, the waterfall in Fig. 1(b) may not be an object of interest, because our attention is not restricted to a specific area but to the whole image, as in Fig. 1(c).
(a)
(b)
(c)
Fig. 1. This figure shows examples of object and non-object image. The left and center images can be regarded as object images, while the right image cannot. On the one hand, the left image contains an object of interest but the center image does not
Concept of object of interest is very important in CBIR because users generally want to search for the images containing particular objects of interest. However, it is difficult to describe the objects of interest using only the low-level image features. Thus our research focuses on determining the existence of object rather than the object of interest. We will describe three measures for characterizing object images in next section.
3 Classification of Object and Non-object Images 3.1 Significant Features in the Default Attention Window A significantly correlated color [4] is defined as the color pair (ci,cj) that satisfies Eq. (1), where CDAW(ci,cj) and CSR(ci,cj) are the count of (ci,cj) in the correlogram CDAW for the default attention window (DAW) and one in CSR for the surrounding region, respectively. The DAW is defined as the rectangle that is located at the center of an image and whose height and width are set to half the image height and width, respectively. The region outside of the DAW is called the surrounding region in this paper. Significant pixels for a significantly correlated color (ci,cj) are defined as the adjacent pixels in the image one of which has the color ci and the other the color cj.
396
S. Kim, S. Park, and M. Kim
C DAW (ci , c j ) − C SR (ci , c j ) C DAW (ci , c j )
≥ 0.1
(1)
3.2 Measures for Classification 3.2.1 Center Significance Center significance of an image is defined as in Eq. 2, which represents significance of color distribution in DAW against the surrounding region. It tends to increase in proportion to density of significant pixels near center of the image. In Fig. 2(a), the object of interest, tiger, presents dense significant pixels and a large center significance value. We can expect to obtain a small center significance value for the non-object image Fig. 2(b). However the center significance does not work well for a non-object image whose background color changes gradually as in Fig. 2(c).
∑∑ Max(C (i, j ) − C CS = ∑ ∑ C (i, j ) DAW
i
SR
(i, j ),0)
j
(2)
DAW
i
j
(a)
(b)
(c) Fig. 2. First image shows dense significant pixels near the center with the help of the ‘tiger’ and has a large center significance value (0.466). Second image has a small center significance value (0.002) because it does not contain any objects. Third non-object image has a large center significance value (0.548) because its background color changes gradually near the center
3.2.2 Variance of Significant Pixels Significant pixels in non-object images tend to be distributed with large variance, while those in object images with small variance. Thus variance of significant pixels in horizontal or vertical direction can be used as a measure of distinguishing object images from non-object images. This measure is defined as the larger variance between the horizontal variance Vx and the vertical one Vy in Eq. 3. Px and Py are the x and y coordinates of each significant pixel in an image, respectively. W and H represent the horizontal and vertical image size, respectively. N is the number of significant pixels in the image.
Image Classification into Object / Non-object Classes
Vx (SP ) =
∑ ((P − m )
2
x
x
/W
), V (SP ) = ∑ ((P − m ) / H ) 2
y
y
N
397
y
N
(3)
V ( SP ) = Max(Vx ( SP ), V y ( SP ))
3.2.3 Edge Strength at Object Boundary Another measure is the edge strength at the boundary of a central object in an image. The central object is determined by using the extraction method in [4]. The method can extract objects of interest well, but it sometimes extracts meaningless regions when it is applied to non-object images. The edge strength in object images tends to be strong, while one in non-object images relatively weak. If the method [4] cannot extract any central region, then the image is classified as a non-object class image. The edge strength measure is defined as in Eq. (4), where ∇f i represents edge strength of the i-th boundary pixel and N is the total number of boundary pixels. E (CO ) =
∑ ∇f
i
i
(4)
N
3.3 Neural Network Classifier Even though each measure by itself may be useful to classify images, the classification accuracy can be improved by combining three measures. We have used a neural network [8] to optimally combine them, since it was hard to assign an appropriate weight to each measure. We adopt the back-propagation algorithm because of its simplicity and reasonable speed.
4 Experimental Results and Discussions The proposed method is evaluated on 900 images selected from the Corel photo-CD, which consist of 450 object images and 450 non-object images. To verify the distinguishing capability of each measure for classification, we check up the distribution of values for the object and non-object images when each measure is applied to them. Fig. 3(a)-(c) show the distribution curves for the center significance, the variance of significant pixels, and the edge strength measure, respectively. We can see that two curves in each figure are not clearly separated. Thus each measure does not provide very good performance by itself. The back-propagation neural network is trained using the 6-fold cross-validation [9] to mitigate bias caused by the particular sample chosen for holdout. In n-fold cross-validation, the data is partitioned into n equal fold and each fold in turn is used for testing while the reminder is used for training. When there are insufficient significant pixels due to the lower center significance value, it is unnecessary to consider the other two measures. After the morphological closing operation followed by the opening one is applied to the significant pixels, a minimum bounding rectangle (MBR) for the biggest connected component of significant pixels is selected. If the size of the MBR in an image is less than 5% of the total image size, the image is
398
S. Kim, S. Park, and M. Kim
classified as a non-object image without additional process. We achieve an 84.2% classification accuracy on the total data. Table 1 shows classification accuracy based on the precision, recall and F-measure. From the precision and recall of the total data we can see that more object images are misclassified to non-object images class than the opposite. Table 2 shows the classification results for each measure. The measure on the edge strength at the object boundary provides the best accuracy.
(a)
(b)
(c) Fig. 3. The distribution of values for 450 object images and 450 non-object images when each measure is applied to: (a) the center significance, (b) the variance of significant pixels, and (c) the edge strength measure at the object boundary Table 1. Evaluation of the classification result by using 6-fold cross-validation
Precision Recall F-measure
Object 0.90 0.78 0.83
Non-Object 0.80 0.90 0.85
Fig. 4 shows a representative subset of the misclassified object and non-object images. The main reason for the misclassification of object images is the similarity of the object to the background in the color distribution. The reason for the misclassification of the non-object images is that center regions of the images are surrounded by regions with abrupt change in the color distribution. The object images can be subdivided into images with objects of interest and otherwise. The objects of interest must be more useful in CBIR than the others. In this
Image Classification into Object / Non-object Classes
399
Table 2. Evaluation of the classification results for each measure by using 6-fold crossvalidation
Object NonObject
Precision Recall F-measure Precision Recall F-measure
Center Significance 0.72 0.68 0.70 0.70 0.73 0.71
Variance of significant pixels 0.76 0.74 0.75 0.75 0.77 0.76
Edge Strength at Object Boundary 0.75 0.80 0.78 0.79 0.73 0.76
paper, we re-conduct the classification in view of objects of interest and non-object. A human subject classifies 94.9% (427) of the object images into the images with objects of interest. The percentage of objects of interest can be changed depending on the set of images selected. We also compute the classification accuracy when the noninteresting object images are assigned to the non-object image class. Table 3 shows the classification accuracy in this case.
(a)
(b) Fig. 4. A subset of the misclassified (a) object and (b) non-object images Table 3. Evaluation of the classification result in view of the object of interest
Precision Recall F-measure
Object 0.88 0.79 0.83
Non-Object 0.82 0.90 0.86
We have used a neural network as a classifier so far. The classification accuracy may depend on the classifier to be used. To compare with other classifiers, we also adopt other classifiers, Naïve Bayes [10], Decision Table [11], Decision Tree classifier [12]. Table 4 shows the classification accuracy according to the classifiers. The classification results show similar accuracies regardless to the classifiers.
400
S. Kim, S. Park, and M. Kim Table 4. Evaluation of the classification results according to the classifiers
Object NonObject
Precision Recall F-measure Precision Recall F-measure
Naïve Bayes 0.83 0.84 0.83 0.83 0.82 0.83
Decision Table 0.86 0.80 0.83 0.82 0.87 0.84
Decision Tree 0.84 0.81 0.83 0.82 0.85 0.83
5 Conclusions We proposed a classification method that classified the images into the object and non-object image classes with an 84.2% accuracy. For this classification we proposed three measures (the center significance, the variance of significant pixels, and the edge strength at the object boundary) and trained the neural network based on them. When we used other classifiers, Naïve Bayes, Decision Table, and Decision Tree, instead of a neural network, we obtained similar classification accuracy. Our work is applicable to improve the performance of the image retrieval and image indexing.
References 1.
Vailaya, A., Jain, A.K., and Zhang, H.J.: On Image Classification: City images vs. landscape. Pattern Recognition. 31(12) (1998) 1921-1936 2. Szummer, M., and Picard, R.W.: Indoor-outdoor image classification. IEEE Int’l Workshop Content-Based Access Image Video Databases. (1998) 42-51 3. Vailaya, A., Figueiredo, M.A.T., Jain, A.K., and Zhang, H.J.: Image Classification for Content-Based Indexing. IEEE Trans. on Image Processing. 10(1) (2001) 117-130 4. Kim, S.Y., Park, S.Y., and Kim, M.H.: Central Object Extraction for Object-Based Image Retrieval. Int’l Conf. on Image and Video Retrieval (CIVR). (2003) 39-49 5. Serra, J.R. and Subirana, J.B.: Texture Frame Curves and Regions of Attention Using Adaptive Non-cartesian Networks. Pattern Recognition. 32 (1999) 503-515 6. Park, S.B., Lee, J.W., and Kim, S.K.: Content-based image classification using a neural network. Pattern Recognition Letter. 25 (2004) 287-300 7. Huang, J., Kumar, S.R., Mitra, M., Zhu, W.J., and Zabih, R.: Image Indexing Using Color Correlograms. Proc. Computer Vision and Pattern Recognition. (1997) 762-768 8. Lippmann, R.P.: An introduction to computing with neural nets. IEEE ASSP Magazine. (1994) 4-22 9. Witten, I.H., Frank, E.: Data Mining. Academic Press. (2000) 10. Good, I.J.: The estimation of Probabilities: An Essay on Modern Bayesian Methods. MIT Press, MA USA (1965) 11. Kohavi, R.: The Power of Decision Tables. Proceedings of the European Conference on Machine Learning, Lecture Notes in Artificial intelligence 914, Springer Verlag, Berlin Heidelberg NY (1995) 12. Breiman, L., Friedman, J.H., Olshen, R.A., and Stone, C.J.: Classification and Regression Trees. Wadsworth, Belmont (1984)