by a steepest ascent search for the value T which max- imizes the correlation coe ...... Selection, IEEE Trans. on Systems, Man, and. Cybern., Vol. SMC-13, pp.
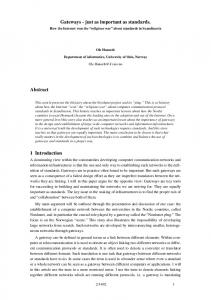
Non-Parametric Histogram Thresholding Methods - Error Versus Relative Object Area Fritz Albregtsen Department of Informatics, University of Oslo P.O.Box 1080 Blindern, N-0316 Oslo, Norway. (E-mail: fritz@i�.uio.no)
Abstract We describe and compare eight di�erent approaches to automatic non-contextual non-parametric bi-level thresholding. The methods have been applied to binormal histograms where the distance between the two peaks varies from 1 to 4 times the standard deviation of the distributions, and where the ratio of the a priori probabilities range from 1:1 to 100:1. The evaluation of performance (i.e. thresholding error) is based on a comparison with an imaginary, perfect method.
1 Introduction Automatic thresholding is important in applications where the speed or the physical conditions prevent interactive human selection of thresholds. In bilevel thresholding, the histogram of the image is usually assumed to have one valley between two peaks, the peaks representing background and objects, respectively. There are two main approaches to the problem of locating the intensity threshold that ideally represents the bottom of this sometimes elusive histogram valley: parametric and non-parametric techniques. In the non-parametric case, one separates the two gray level classes in an optimum manner according to some a posteriori criterion, without estimating the parameters of the two distributions. The nonparametric methods are more robust, and usually faster than the parametric. Surveys of some of the methods may be found in Weszka [23], Sahoo et al. [18], and Lee et al. [9]. However, systematic quantitative comparisons of thresholding errors, including the case of low a priori probability ratios often found in real world images does not seem to have received much attention in the literature. Speci�cally, the surveys give little guidance to the proper choice of thresholding method if one wants to avoid nonsensical thresholding of images where the relative object area is very small.
Weszka and Rosenfeld [26] used both busyness and classi�cation error as performance criteria. However, their work did not include the methods proposed in recent years. Sahoo et al. [18] used test images that do not satisfy the two-class assumption, and did not test for actual classi�cation error. Lee et al. [9] evaluated performance based on error, shape measure and a uniformity measure. However, only two di�erent test images were used. Di�erent histograms were obtained from a given test image by scaling the object size and the di�erence between the object and background. We have chosen to test only automatic, noncontextual, non-parametric methods, i.e. methods that rely only on the gray level histogram of the image. We apply the methods to binormal histograms where the distance between the two peaks varies from 1 to 4 times the standard deviation of the distributions, and where the ratio of the a priori probabilities range from 1:1 to 100:1. The evaluation of performance (i.e. thresholding error) is based on a comparison with an imaginary, perfect method.
2 Threshold selection by statistical criteria The normalized histogram (or brightness probability density function), p(z ), is given by p(z ) = n(z )/N (1) where n(z ) is the number of pixels in the image f that have gray level value z , and N is the total number of pixels in the image. Even though the Gaussian distribution may not be a strictly valid assumption, it is often used as the underlying distribution, although its parameters are not extracted. Suppose that the total probability density function is given by p (z ) =
P1 √
σ1
2π
e
−
(z−µ1 )2 2σ2 1
+
P2 √
σ2
2π
e
−
(z−µ2 )2 2σ2 2
(2)
where µi and σi are the a priori mean values and standard deviations of the two distributions (µ1 < µ2 ). The a priori probabilities P1 and P2 of the background and foreground are subject to the constraint P1 + P2 = 1. The overall probability of erroneously classifying a pixel from one of the two distributions as a pixel from the other distribution, is simply E (T ) = P1
Z
∞
T
p1 (z )dz + P2
Z
T −∞
p2 (z )dz
(3)
We may now di�erentiate E (T ) with respect to T to �nd the value of T where this error is minimal, getting − P1 √ e 2πσ1
(T −µ1 )2 2σ2 1
=
− P2 √ e 2πσ2
(T −µ2 )2 2σ2 2
(4)
If the variances are assumed to be equal, a single threshold is given by T
= µ1 +2 µ2 + µ
1
2
σ ln(P2 /P1 ). − µ2
(5)
If the a priori probabilities are equal, P1 = P2 , the optimal threshold is simply the average of the means. Many methods are implicitly based on this assumption, and will inevitably fail if the a priori probability ratio gets too high or too low.
2.1 A simple iterative method Ridler and Calvard [15] have described an iterative heuristic thresholding technique which is implicitly based on the assumptions described above. The initial threshold value, t0 , is set equal to the average brightness, µ0 . Thereafter, the new threshold value tk+1 for the (k + 1)-th iteration is given by (this formulation is actually given in Trussell's comment [21] on the paper by Ridler and Calvard [15]) µ1 (tk ) + µ2 (tk ) tk+1 = "P 2 # PG−1 t 1 z =t +1 zp(z ) z =0 zp(z ) = 2 Pt + PG−1 (6) z =0 p(z ) t +1 p(z ) k
k
k
k
where µ1 (tk ) and µ2 (tk ) are the a posteriori mean values of the gray values below and above the previous threshold tk , respectively, and G is the number of gray levels. The two distributions will usually overlap somewhat. Because of the overlap, the a posteriori mean values of the two classes are only approximations to
the a priori mean values of the two now contaminated and truncated distributions. Thus, the correctness of the estimated threshold depends on the extent of this overlap, as well as the correctness of the P1 ≈ P2 assumption.
2.2 Otsu's method The method of Otsu [10] maximizes the a posteriori between-class variance σB2 (t), given by 2 σB (t)
=
P1 (t)µ21 (t) + P2 (t)µ22 (t) − µ20
2 t) − µ1 (t)] = [µP0 P(t1)([1 . − P1 (t)] 1
(7)
The optimal threshold T is found by a sequential search for the maximum of σB2 (t) for values of t where 0 < P1 (t) < 1.
2.3 The method of Reddi et al. The method of Reddi et al. [14] is based on the same assumptions as the method of Otsu [10], selecting a threshold T so that the a posteriori betweenclass variance between dark and bright regions is maximized. They show, however, that the between-class variance σB2 (t) has a unique maximum, and establish the condition for this maximum. We may write σB2 as hP t
z =0 zp(z ) Pt z =0 p(z )
2 σB (t) =
i2
+
hP G−1
z =t+1 zp(z ) PG−1 z =t+1 p(z )
i2 − µ20
(8)
Di�erentiating σB2 and setting δσB2 (t)/δt = 0, we �nd a solution for "P
( )+ () This may be written as T z =0 zp z PT z =0 p z
PG−1
#
() = 2T ()
z =T +1 zp z PG−1 z =T +1 p z
µ1 (T ) + µ2 (T ) = 2T
(9) (10)
where µ1 (T ) and µ2 (T ) are the mean values below and above the threshold T . Finding the value of T that satis�es the above condition can be accomplished by an exhaustive sequential search, giving the same result as Otsu's method. Starting with a threshold t0 = µ0 , fast convergence is obtained equivalent to the ad hoc technique of Ridler and Calvard [15]. Thus, the work of Reddi et al. [14] ties together these three methods.
2.4 A minimum error method
3 Maximum correlation thresholding
Taking the logarithm of both sides of Equation 4 we get a quadratic equation in t with �ve unknown parameters. Kittler and Illingworth [8] optimizes a criterion function, J (t), related to the average pixel classi�cation error rate
Brink [3] has demonstrated a thresholding method based on maximizing the correlation between the original gray level image f and the thresholded image g. The gray levels of the two classes in the thresholded image may be represented by the two a posteriori average values below and above the threshold. Using the histogram p(z ) of the gray level values z , the correlation coe�cient ρf g (t) may be expressed as Ef g (t) − Ef Eg (t) ρf g (t) = (12) (Vf Vg (t))1/2 where E and V denote the expected values and the variances of the expression in the index, respectively. This correlation coe�cient has a very smooth behaviour, and starting with the overall average graylevel value, the optimal threshold may be found by a steepest ascent search for the value T which maximizes the correlation coe�cient ρf g (t). However, as pointed out by Cseke and Fazekas [5] this optimization criterion is identical to the one used by Otsu, despite their di�erent approach.
J (t)
= 1 + 2 [P1 (t)lnσ1 (t) + P2 (t)lnσ2 (t)] − 2 [P1 (t)lnP1 (t) + P2 (t)lnP2 (t)] (11)
For an arbitrary threshold t, each of the two resulting populations may be modelled by a normal density distribution p(z | i, t), i = 1, 2 with a posteriori parameters Pi (t) and σi (t) estimated from the two disjunct portions of the histogram. As the threshold t is varied, the model parameters change. Thus, the problem of minimum error threshold selection is reduced to computing J (t) for all t, and �nding its minimum value. This approach has been used here. If the criterion function was well behaved with a single, global minimum, the solution could be found by a faster iterative search for the minimum error threshold. However, as pointed out by Ye and Danielsson [25], the criterion function has local minima at the boundaries of the gray scale, and in addition an unfortunate starting value for the iteration may cause the iteration to terminate at a nonsensical threshold value. If the starting threshold is obtained by the method of Otsu (= Reddi et al.), convergence towards the minimum error threshold is assured. We note that even at this optimum threshold, and even if the assumption of a bimodal normal distribution is valid, the model parameters will represent biased estimates, as the tails of the overlapping distributions are truncated. Thus, the correctness of the estimated threshold relies on this overlap being small. However, the most challenging images are those where the histograms do not have two well separated modes. Therefore, Cho et al. [4] have improved on the method of Kittler and Illingworth, simply by improving on the estimate of the two variances, given an initial guess on the correct threshold value. Cho et al. uses both the Kittler and Illingworth threshold and the Otsu threshold to get an initial value, and recommends the latter. The improvement in the Cho et al.-method over the Kittler and Illingworth method is most outstanding in not-well-separated, but still bimodal histograms. As we will se later, the performance of the Kittler and Illingworth method is very satisfactory. We have therefore not included the Cho et al. improvement in the present work.
4 Entropy-based methods An optimal threshold may also be obtained from the entropy of the histogram of the image. Below we brie�y describe the method of Kapur et al. [7]. Tests have shown this to be superior to the methods of Pun [12], [13], and Johannsen and Bille [6]. Kapur et al. [7] proposed a thresholding algorithm based on Shannon entropy. For two distributions separated by a threshold t the sum of the two class entropies is ψ (t) = H1 (t) + H2 (t) (13) t G− 1 X X p(z ) p(z ) ln = − Pp((zt)) ln Pp((zt)) − P t ) P ( 1 2 (t) z =0 1 z =t+1 2 Using Ht
=
−
t X
p(z )ln(p(z ))
z =0
HG
=
−
G− X1
p(z )ln(p(z ))
(14)
z =0
the sum of the two entropies may be written as ψ (t) = ln [(P1 (t)) × (P2 (t))]+
Ht HG − Ht + P1 (t) P2 (t)
(15)
The discrete value T of t which maximizes ψ(t) is now the threshold value which maximizes the information between object and background. Pal and Pal [11] proposed a new de�nition of entropy based on an exponential information gain. Thus, we search for the value T which maximizes the total global entropy H (G) (t) =
t X z =0
p(z ) 1− Pp(z(t)) p(z ) 1− Pp(z(t)) 1 2 e − e P1 (t) P (t) z =t+1 2 G− X1
(16)
5 Preservation of moments Tsai [22] used the preservation of moments to obtain a threshold value without iteration or search. The method also gives representative gray level values for each thresholded class, and the method is easily extended to multi-level thresholding. De�ning m0 to be 1, i-th moment mi of a gray level image f may be computed from the normalized histogram p(z ) mi
=
G− X1
p(z )(z )i ,
i = 0, 1, 2, 3.
(17)
z =0
The image f may be seen as a blurred version of an ideal bi-level image g with gray levels z1 and z2 (z1 < z2 ). The method selects a threshold T such that if all below-threshold values in f are replaced by z1 , and all above-threshold values are replaced by z2 , then the �rst three moments of f are preserved in the unblurred bi-level image g. Let P1 and P2 denote the fractions of the belowthreshold and above-threshold pixels in f . Then the �rst three moments of g are given by 0
mi
=
2 X
Pj (zj )i ,
i = 1, 2, 3.
(18)
j =1
Thus, preserving the moments and using the fact that P1 + P2 = 1 = m0 we have a set of four equations: 2 X
j =1
Pj (zj )i
=
−m2 m1 −m3 m2 m0 −m2 c1 = (1/cd ) m1 −m3 h i z1 = (1/2) −c1 − (c21 − 4c0 )1/2 c0
G− X1
p(z )(z )i ,
i = 0, 1, 2, 3.
(19)
z =0
In the bi-level case, the equations are solved by : cd
m0 m1
=
m1 m2
(20)
z2 1 Pd = z1
= (1/cd)
= (1/2)
h i −c1 + (c21 − 4c0 )1/2
, z2
1 P1 = (1/Pd ) m2
1
(21) (22) (23) (24) z2
1
(25)
The optimal threshold, T , is then chosen as the P1 tile (or the gray level value closest to the P1 -tile) of the histogram of f .
6 Exponential convex hull Instead of searching for the bottom of the valley that separate two distributions in a histogram, Rosenfeld and de la Torre [16] proposed to select the threshold through an analysis of the convex de�ciency of the histogram. The convex de�ciency is obtained by subtracting the histogram from its convex hull. They proposed to compute the convex hull using the general algorithm by Rutovitz [17]. This algorithm is rather slow (O(n2 )), but as pointed out by Toussaint [20], the O(n) convex hull algorithm of Sklansky [19] is applicable to the speci�c polygon of a histogram. Progressing sequentially, vertexes are tested for concavity and eventually removed, regressing one vertex at each removal to check for a newly formed concave vertex. The concavity test for three histogram points (z1 , p1 ), (z2 , p2 ), and (z3 , p3 ) is simply (z3 − z1 )(p1 − p2 ) + (p3 − p1 )(z2 − z1 ) < 0
(26)
As pointed out by Whatmough [24], the upper concavity of histogram tail regions can often be eliminated by considering ln{p(z )} instead of the histogram p(z ). In the ln-domain, upper concavities in the histogram can be produced by bimodality and by shoulders, but not by the tail of distributions like the normal or exponential, nor by the extension of the histogram by zero values. Thus, we have computed the convex hull h(k) of ln{p(z )} using the fast algorithm of Sklansky [19], and transformed the convex hull back to the histogram domain by he(k) = exp(h(k)). Now the exponential
convex hull de�ciency is given by d(z ) = h� e (z ) − p(z ) where the exponential convex hull value h� e(z ) for each gray level z is obtained by linear interpolation of the set of points he(k). Finally, the threshold is found by a sequential search for the maximum of the exponential hull de�ciency d(z ). If the two components of the binormal histogram are close (µ2 − µ1 < 2σ), no upper exponential concavity will be present. We have therefore tested this method only for distances of 3σ and 4σ.
Total error
0.5 0.4 0.3 0.2 0.1 0.0
.......... ..... ..... .... .... .... .... ............. ... .... ........ .......... ..... .... ....... ....... ..... .... ................... .. .... . . . . . . . ......... .........................................................
0.0
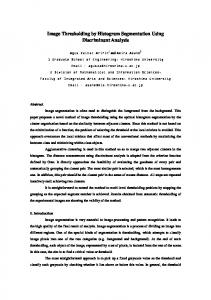
7 Results We have tested the eight methods described above on normalized binormal histograms, as given by Equation 2. We let the a priori probability ratio range from 1 to 100. The standard deviations, σ, of the two distributions are equal, and we let the distance between the distribution means vary from 1σ to 4σ. For each of the eight methods tested we give in Figure 2 the total fraction of error versus the logarithm of the a priori probability ratio log10 (P1 /P2 ) for binormal histograms where µ2 − µ1 = D × σ, D = 1, 2, 3, 4; as well as the fraction of mis-classi�ed foreground pixels. The reason for including the latter is simply that in the case of low object-to-background ratios some methods will obtain a low overall classi�cation error, simply by placing the threshold too high. In that case, the foreground pixels will su�er. It is therefore important to judge the methods from both aspects.
8 Discussion The total error and the corresponding fraction of mis-classi�ed foreground pixels shown in Figure 2 should be compared to 1: the minimum total error and its corresponding fraction of mis-classi�ed foreground pixels; but also to 2: the case when equal amounts of foreground and background pixels are mis-classi�ed. The total error and the corresponding fraction of misclassi�ed foreground pixels for these two di�erent cases are given in Figure 1. The fast and often used iterative method of Ridler and Calvard [15] seems to fail when the a priori ratio exceeds about 10. However, the method will bene�t somewhat from a starting threshold at t0 = µ0 + 3σ. The sequential search method of Otsu [10] shows a performance very similar to the Ridler and Calvard method. We note that the sequential correlation method of Brink [3] gives identical results to the
... ... ... .... .. ... ... ... ...
...
.. ... ... . . .. ... ....
. .....
.. ...
. .....
.. ...
.....
.. ...
. . . ..... . . ...... . . ..... . . . . . ....... . . . . . . .
1.0 2.00.0 1.0 2.0 log10 (P1 /P2 ) log10 (P1 /P2 ) Total error
0.5 0.4 0.3 0.2 0.1 0.0
Foreground error
Foreground error
.........................................................................................
.........................................................................................
............. .... ............. .... ............. .... ...........
............. .... ............. .... ............. .... ...........
....... ....... ....... ....... ....... ....... ....... .. . . . . . . . . . . . . . . .
....... ....... ....... ....... ....... ....... ....... .. . . . . . . . . . . . . . . .
0.0
0.5 0.4 0.3 0.2 0.1 0.0
1.0 2.00.0 1.0 2.0 log10 (P1 /P2 ) log10 (P1 /P2 )
0.5 0.4 0.3 0.2 0.1 0.0
Figure 1: a) The two panel: The minimum fraction of mis-classi�ed pixels (left) versus the logarithm of the a priori ratio log10(P1 /P2 ) for µ2 − µ1 = D × σ, D = 1 (solid), 2 (dash-dot), 3 (dashed), 4 (dotted); and the corresponding fraction of mis-classi�ed foreground pixels (right). b) The bottom panel: The case of equal amounts of background and foreground pixels being mis-classi�ed. Otsu method, and has therefore been omitted from Figure 2 . In the moment preserving method of Tsai [22] the total error increases steadily as the object-tobackground ratio decreases. The minimum error method of Kittler and Illingworth [8] gives a very stable error rate, and the classi�cation results obtained here therefore mostly resemble the equal error case. We note that if the criterion function was well behaved with a single, global minimum, the solution could also be found by a much faster iterative search for the minimum error threshold. As pointed out by Ye and Danielsson [25], a starting threshold obtained by the method of Otsu may be appropriate. However, in the case of low object-tobackground ratio the Otsu method may fail to give an appropriate starting threshold, as shown above. In an industrial application with very low P2 : P1 (≈ 1:300) Borgli [2] found that the iterative Kittler and Illing-
Total error
0.5 0.4 0.3 0.2 0.1 0.0 0.5 0.4 0.3 0.2 0.1 0.0 0.5 0.4 0.3 0.2 0.1 0.0
Foreground error
....................................... ....... .... ...... ....... ............. ...... ................. ...... . . . . . . .. .. . ... ....... ....... .. .... . ........ ..... .. ............... .... ... .. . ... . . .. .... ... . ...... . . . . . . . . ... ............. . . .... . ..... . ....... ....... . . . . . . . . . .
0.0
1.0
2.00.0
.................... ................ .................... ........................................... ............. .... ............. .... ............. .... ............. .... ....... ....... ....... ...... . ....... ....... ....... ....... . . . . . . . . . . . . . . . .
0.0
1.0
1.0
2.0
................................................................... .................. ........ ........ ............. .... . .... ............. .... .......... .... .. . . . . . . . . . . ... ....... ....... ....... ....... ....... ....... . ....... ....... . . . . . . . . . . . . . . . .
2.00.0
.......... ...... .... ...... ........ ..... ...... ...... ...... ...... ....... . . ....... . . . . . ........................... ............. .... ......... .... .. ....... ....... ....... .. .. ............ ..... . .. . . . . . . . . ......... ........... .............................. . .
0.0
..... ..... ...... ...... ....... .......... .......... .................... ...................................... ............ .. ... ......... .... ....... ....... ...... .... ........ . . . . . .. ......... ............ .... ............. .... . . ........ ........ ........ ..
1.0
2.0
... ... ..... ... .... .... .... .. ..... .... . ..... .... ... . . ..... . . . . .. ..... .. . . . . ....... . .... . . . . ..... ... .. ... ... ... .. ... ... ... ...... .. . .... ..... .... . . . ... . .... . ... . . ....... ....... ...... . . . . . . . . . . . . . .
1.0 2.00.0 log10 (P1 /P2 )
Total error
0.5 0.4 0.3 0.2 0.1 0.0
0.5 0.4 0.3 0.2 0.1 0.0
0.5 0.4 0.3 0.2 0.1 0.0
0.5 0.4 0.3 0.2 0.1 0.0
0.5 0.4 0.3 0.2 0.1 0.0
0.5 0.4 0.3 0.2 0.1 0.0
1.0 2.0 log10 (P1 /P2 ) Total error 0.5 0.4 0.3 0.2 0.1 0.0
.......... ............... ........... .................... . .......... .... ...... .......... ........ . . . . . . ... ..... . .... ....... . ... ....... . . . ........ .... ......... ... . . . . . . . . . . . . . . . . . . . . .. . . .. . ... . .. ... .. . ...... . .. . . . . . ... ............. . . .... . ..... . ....... ....... . . . . . . . . . .
0.0
1.0
0.0
1.0
0.0
. ......
. ...... ....... ....... . . . . . . ...... ....... . ....... . . . . . . . . . . . . . . . .
..
2.0
1.0
2.0
. ...
. ...
.
.. ... ......... ......... .. ......... ... .......... .... ...... . . .. .......................... .... ........ .............. .. .... .... .................................. ........... . . . . .... ..... .. . . ....... ... . . . ....... ....... ....... . . . . . ......... .... .. . . . . . . . . . . .
1.0 2.00.0 log10 (P1 /P2 ) Foreground error 0.5 0.4 0.3 0.2 0.1 0.0
1.0
...... ...... ......... .......... ....... ...... ................... .................... ................. ..... ...... ...... . ... . ........ ..... ....... .... ......... .... .... ............. ....... .. .... . . . . . ....... ......... ......... ........ ........ ........ ..
2.00.0
..... .............. . ................ ............ ....... . . . . . . . . . . .... ....... .. ....... ... ........ ... ......... . . . . . . . . . . . ............. .. .. ... ... ... ............. .... ... ........... .. .... ..... . ....... ....... ....... .. ..... . . . . . . . . ......... ......... ......... ....... .
0.0
...... ...... ......... .......... .......... .......... ........... ..................... ...................... ....... ...... .... ......... .... ....... ....... ...... .... ......... . . . . . .. ......... ............ .... ............. .... ........ ........ ........ ..
2.00.0
........ ....... ................... .............. .... .... ...... . . . . . . . . . . . . . . .. ... ....... ..... ....... . ..... ... .... . . ....... .. ......... .. . . . . . . . . . . . . . . . . . . . . . . . ..... .... . . ..... ... . .. . ... .... . ....... . . . .. ...... . . .. . . ............ ...... . ....... . . . ....... . ....... . . . . .
. ......
....... ....... ....... ....... . . . . . . . . ......... ......... ......... ........ .
Foreground error
1.0 2.0 log10 (P1 /P2 )
0.5 0.4 0.3 0.2 0.1 0.0 0.5 0.4 0.3 0.2 0.1 0.0 0.5 0.4 0.3 0.2 0.1 0.0
1.0 2.00.0 1.0 2.0 log10 (P1 /P2 ) log10 (P1 /P2 ) Figure 2: For each of seven methods tested we present two graphs, showing a) Left: The total fraction of mis-classi�ed pixels versus the logarithm of the a priori ratio log10(P1 /P2 ). b) Right: The corresponding fraction of mis-classi�ed foreground pixels. Four di�erent line types have been used in order to distinguish between di�erent distances between the distribution means, µ2 − µ1 = D × σ, D = 1 (solid), 2 (dash-dot), 3 (dashed), 4 (dotted). The seven methods are : Upper left: The iterative method of Ridler and Calvard. Upper right: The sequential search method of Otsu. Middle left: The sequential method of Kittler and Illingworth. Middle right: The moment method of Tsai. Lower left: The entropy method of Kapur et al. Lower right: The exponential entropy method of Pal and Pal Bottom: The exponential convex hull method (only for D = 3 and D = 4).
worth method with a starting threshold at t0 = µ0 +3σ gave a very good result. The results that most closely replicates the ideal case of minimum total error is the entropy-based method of Kapur et al. [7]. The only exception occurs for low a priori probability ratios combined with a very small distance between the distribution means. However, this method is very tolerant to noise in the histogram, and ought to be one of the most popular. Abutaleb [1] has demonstrated that this thresholding is signi�cantly improved if a two-feature entropy threshold is used (gray level + average gray level), particularly in low SNR images. In our experience, a similar improvement occurs for any histogrambased thresholding method if the two-feature contextual strategy (gray level + average gray level) is used. The exponential entropy method of Pal and Pal [11] fails for very close distributions. For distances of 3σ and 4σ it gives results equivalent to the much less time-consuming method of Kapur et al. [7]. The exponential convex hull method is not applicable to the case of very close distributions. For distances of 3σ and 4σ it gives very good results. However, it is not very tolerant to noise in the histogram, although Whatmough [24] has demonstrated its usefulness in determining both the number of thresholds and the location of each threshold for real life images. Zhang and Gerbrands [27] compared one contextual and four non-contextual methods applied to synthetic images, and recommended the convex hull method for small object areas. In many applications the histogram will contain object and background modes of unequal variances, violating the assumptions of the Ridler and Calvard [15] and Otsu [10] methods. A typical situation may be a wide range of object intensities on a fairly homogeneous background. Again, tests show that the Ridler and Calvard and Otsu methods actually will fail for highly unequal population sizes, although a substantial improvement is achieved by setting t0 = µ0 + 3σ in the former method. In this situation, the method of Kapur et al. very closely replicates the ideal minimum error case, whereas the Kittler and Illingworth method retains its characteristic equal error appearance. The same is true if we use the �high-tailed� Gauchy distribution instead of the Gaussian. Now the concept of �minimum error� may become somewhat meaningless for the case of very low object-to-background ratios. Because of the high tail the minimum error may be obtained by mis-classifying most of the foreground pixels. Again, the method of Kapur is closest to the ideal minimum error case, while the Kittler and Illing-
worth method is very close to the ideal equal error case.
9 Conclusion We have found that when applying eight di�erent approaches to non-contextual thresholding to binormal histograms where the distance between the two distribution means varies from 1 to 4 times the standard deviation of the distributions, and where the ratio of the a priori probabilities range from 1:1 to 100:1, a comparison with an imaginary, perfect method demonstrates that many of the thresholding methods break down for low object-to-background ratios. However, two methods seem to give reasonable results. The method of Kittler and Illingworth [8], based on obtaining a minimum classi�cation error from continuously updated estimates of the distribution parameters, always comes very close to the ideal equal error case. The entropy-based thresholding method of Kapur et al. [7] is closest to the ideal of giving a minimum total classi�cation error. The fast and often used iterative method of Ridler and Calvard always fails when the backgroundto-object ratio exceeds about 10. This is also true for the very popular sequential search method of Otsu. �For many are called but few are chosen ...� Matthew 22:14
References [1]
A.S. Abutaleb: Automatic Thresholding of Gray-Level Pictures Using Two-Dimensional Entropy, Computer Vision, Graphics, and Image Processing, Vol. 47, pp. 22-32, 1989.
[2]
O. Borgli: Detection of Surface-Faults in Roof Tiles, Thesis (in Norwegian), Department of Informatics, University of Oslo, Norway, 1991.
[3]
A.D. Brink: Grey-Level Thresholding of Images using a Correlation Criterion, Pattern Recogn. Letters, Vol. 9, pp. 335-342, 1989.
[4]
S. Cho, R. Haralick, and S. Yi: Improvement of Kittler and Illingworth's Minimum Error Thresholding, Pattern Recognition, Vol 22, pp. 609-618, 1989.
[5]
I. Chseke and Z. Fazekas: Comments on graylevel thresholding of images using a correlation criterion, Pattern Recognition Letters, Vol 11, pp. 709-710, 1990.
[16]
[6]
G. Johannsen and J. Bille: A Threshold Selection Method using Information Measures, Proc. 6th. Intl. Conf. on Pattern Recognition, Munic, 1982, pp. 140-143.
[17]
[7]
J.N. Kapur, P.K. Sahoo, and A.K.C. Wong: A New Method for Gray-Level Picture Thresholding Using the Entropy of the Histogram, Computer Vision, Graphics, and Image Processing, Vol. 29, pp. 273-285, 1985.
[8] [9]
J. Kittler and J. Illingworth: Minimum Error Thresholding, Pattern Recognition, Vol. 19, pp. 41-47, 1986.
[18]
[19] [20]
S.U. Lee, S.Y. Chung, and R.H. Park: A Comparative Performance Study of Several Global Thresholding Techniques for Segmentation, Computer Vision, Graphics, and Image Processing, Vol. 52, pp. 171-190, 1990.
[21]
[10]
N. Otsu: A Threshold Selection Method from Gray-Level Histograms, IEEE Trans. on Systems, Man, and Cybern., Vol. SMC-9, pp. 6266, 1979.
[22]
[11]
N.R. Pal and S.K.Pal: Entropy: A New De�nition and its Applications, IEEE Trans. on Systems, Man, and Cybern., Vol. SMC-21, pp. 1260-1270, 1991.
[23]
[12]
T. Pun: A New Method for Grey-Level Thresholding using the Entropy of the Histogram, Signal Processing, Vol. 2, pp. 223-237, 1980.
[13]
T. Pun: Entropic Thresholding: A New Approach, Computer Graphics and Image Processing, Vol. 16, pp. 210-239, 1981.
[25]
[14]
S.S. Reddi, S.F. Rudin, and H.R. Keshavan: An Optimal Multiple Threshold Scheme for Image Segmentation, IEEE Trans. on Systems, Man, and Cybern., Vol. SMC-14, pp. 661-665, 1984.
[26]
[15]
T. Ridler and S. Calvard: Picture Thresholding using an Iterative Selection Method, IEEE Trans. on Systems, Man, and Cybern., Vol. SMC-8, pp. 630-632, 1978.
[24]
[27]
A. Rosenfeld and P. de la Torre: Histogram Concavity Analysis as an Aid in Threshold Selection, IEEE Trans. on Systems, Man, and Cybern., Vol. SMC-13, pp. 231-235, 1983. D. Rutowitz: An Algorithm for In-line Generation of a Convex Corner, Computer Graphics Image Processing, Vol. 4, pp. 74-78, 1975. P.K. Sahoo, S. Soltani, A.K.C. Wong, and Y.C. Chen: A Survey of Thresholding techniques, Computer Vision, Graphics, and Image Processing, Vol. 41, pp. 233-260, 1988. J. Sklansky: Measuring Concavity on a Rectangular Mosaic, IEEE Trans. on Computers, Vol. C-21, pp. 1355-1364, 1972. G.T. Toussaint: On the Application of the Convex Hull to Histogram Analysis in Threshold Selection, Pattern Recognition Letters, Vol. 2, pp. 75-77, 1983. H.J. Trussell: Comments on 'Picture Thresholding using an Iterative Selection Method�', IEEE Trans. on Systems, Man, and Cybern., Vol. SMC-9, p. 311, 1979. W-H. Tsai: Moment-Preserving Thresholding: A New Approach, Computer Vision, Graphics, and Image Processing, Vol. 29, pp. 377-393, 1985. J.S. Weszka: A Survey of Threshold Selection Techniques, Computer Graphics and Image Processing, Vol. 7, pp. 259-265, 1978. R.J. Whatmough: Automatic Threshold Selection from a Histogram Using the �Exponential Hull�, Computer Vision, Graphics, and Image Processing, Vol. 53, pp. 592-600, 1991. Q-Z. Ye and P.E. Danielsson: On Minimum Error Thresholding and its Implementations, Pattern Recognition Letters, Vol. 7, pp. 201206, 1988. J.S. Weszka and A. Rosenfeld: Threshold Evaluation Techniques, IEEE Trans. on Systems, Man, and Cybern., Vol. SMC-8, pp. 622-629, 1978. Y.J. Zhang and J.J. Gerbrands: Comparison of Thresholding Techniques Using Synthetic Images and Ultimate Measurement Accuracy, Proceedings, 11th ICPR, The Hague, The Netherlands, pp. 209-213, 1992.