known about the longitudinal and developmental patterns of cognitive performance in this ... dynamic process between language and cognitive development.
Journal of Child Psychology and Psychiatry 46:3 (2005), pp 317–326
doi: 10.1111/j.1469-7610.2004.00355.x
Non-verbal cognitive development and language impairment Nicola Botting University of Manchester, UK
Background: Specific language impairment (SLI) is currently partly defined by the presence of nonverbal IQ scores in the normal range. However, not only is there a debate concerning where ‘normal thresholds’ should be, but increasing information about the presence of processing deficits in SLI have led some researchers to question the use of IQ criteria in clinical diagnosis. In particular, little is known about the longitudinal and developmental patterns of cognitive performance in this population. Method: Data from a long-term follow-up study of SLI was examined in 82 children defined at original participation as having SLI who had IQ measurements at 7, 8, 11 and 14 years. Results: Analyses revealed a significant fall between 7 and 14 years of over 20 IQ points. This fall took place mainly between 8 and 11 years but was still continuing between 11 and 14 years. Further investigation revealed different groups of children showing different developmental patterns in IQ, even after controlling for baseline measurement. These groups also showed significantly different language outcomes at 14 years. Analyses controlling for IQ at 7 were also performed that suggested a dynamic process between language and cognitive development. Conclusions: These findings appear to be in agreement with a model of impairment that views ‘Residual Normality’ as unlikely (KarmiloffSmith, 1998; Thomas & Karmiloff-Smith, 2002). The implications are therefore discussed in relation to the dynamic development of systems along with the possible cognitive mechanisms (such as working memory) that might interact with language to create an SLI profile. Keywords: Cognition, development, language disorder, longitudinal studies, non-verbal IQ, specific language impairment.
In both academic and clinical practice, the ‘specific’ characteristics of developmental disorders have been shown to be wider than first documented, with many children experiencing difficulties in areas not predicted by modular theories. One example of this is seen in ‘specific language impairment’ (SLI) where exclusionary criteria are used in its definition. The child with SLI must have significant impairment of language expression or comprehension without any obvious identifiable cause such as general cognitive delay, hearing loss or autism (DSM IV; American Psychiatric Association, 1994). However, difficulties exist with this model of description. It raises issues regarding not only the suitability of non-verbal IQ as a key diagnostic criterion in SLI (Fey, Long, & Cleve, 1994), but also about what constitutes a normal non-verbal IQ ‘threshold’ in atypical development, and the use of discrepancy criteria per se. It also assumes a lack of developmental interaction between various systems over time, a view that is being increasingly challenged as an adequate model of atypical development (Karmiloff-Smith, 1998; Thomas & Karmiloff-Smith, 2002).
Fluidity of diagnosis and developmental models Resources aimed at children with SLI (at least in the UK) find that they also provide for children with behavioural difficulties, autistic spectrum disorders (ASD) and general learning difficulties. One reason for this may be the dynamic process reflected in the development of any individual. Diagnoses tend to
capture an individual’s needs at a given point (or sometimes phase) in their development. Longitudinal studies have shown developmental disorders to change quite considerably over time, with children meeting diagnostic criteria in different ways, meeting criteria for alternative syndromes, or not meeting any recognised clinical criteria at all (see ContiRamsden & Botting, 1999 for SLI; Baird et al., 2000 for ASD). This fluidity remains a constant challenge not only to the professionals and parents managing daily routines, but also to theorists attempting to distinguish one impairment from another. Indeed, fluidity of diagnosis might be better seen as important descriptive information, accurately portraying the interactive nature of specific systems as they develop, rather than representing descriptive errors. Thomas and Karmiloff-Smith (2002) examined the concept of interactive development using modelling techniques, and challenged the assumption of ‘residual normality’ in developmental disorders. Residual Normality refers to the adult neuropsychology model, which assumes that impairment of any individual system (such as language) remains entirely independent of other systems, so that truly ‘specific’ deficits are seen. The model of SLI also implicitly assumes this pattern of difficulty, with clinical criteria emphasising language as the only affected system. This standpoint may need to be revised to encompass developmental patterns, so that more flexible descriptions can be applied. The non-verbal intelligence required to diagnose SLI is often defined as 1sd (85 IQ points), but this
� Association for Child Psychology and Psychiatry, 2004. Published by Blackwell Publishing, 9600 Garsington Road, Oxford OX4 2DQ, UK and 350 Main Street, Malden, MA 02148, USA
318
Nicola Botting
cut-off has been questioned from a number of perspectives: firstly, a child with a non-verbal IQ of 86 and a language score of 79 might not show sufficient discrepancy between the two skills to warrant a diagnosis of SLI (Bishop, 1997); secondly, children with IQs substantially lower than 85 may show patterns of language deficit that make them clinically and perhaps theoretically indistinguishable from those meeting stricter criteria (Tomblin et al., 1997); thirdly, measurement error evident in tests of language and cognition means that neither threshold values nor discrepancy criteria are ideal candidates for case definition (Lahey, 1990). More importantly, the very use of non-verbal IQ as a diagnostic criterion may raise difficulties. Whilst those with global learning difficulties can probably be distinguished from children whose primary difficulties lie in language, we need to examine further the position of IQ in this equation. If Residual Normality is unlikely in SLI (as suggested by the models of Thomas and KarmiloffSmith) then we might find ourselves in a poor position to predict the developmental path of non-verbal skills, let alone use them as criteria. Following a more developmental approach, the age of the child in question and their specific linguistic difficulties would be likely to affect diagnosis. Furthermore, the relationship between sub-systems may become important in identifying those most in need of clinical intervention. Stark and Tallal (1981) produced an important text highlighting the difficulties of selecting children as having SLI. These authors showed that of 132 children referred by clinicians as meeting SLI criteria of normal intelligence, hearing and emotional status, only 39 met objective testing criteria. Of those ‘rejected’, 50 scored below 85 on tests of non-verbal IQ and 33 others showed language test scores that were ‘too high’. The clinical opinions reported may have been ‘tapping into’ concepts ignored by static description.
Non-verbal development and SLI Developmental information gathered suggests that non-verbal IQ might change more markedly over time in those with SLI than in typically developing children. It is possible that these changes are directly related to the emergence of language skill. Only relatively recently, using longitudinal studies, has this developmental shift been noticeable: Presumably children with low IQs at older ages would be excluded from cross-sectional studies on the basis that they do not meet SLI criteria (even though they might once have done). It now appears that non-verbal IQ may drop or fluctuate substantially in groups with SLI with average decline of around 10–20 points (Krassowski & Plante, 1997; Paul & Cohen 1984; Conti-Ramsden, Botting, Simkin, & Knox, 2001a). Tomblin, Freese, and Records (1992) reported a mean fall in non-verbal
IQ of around 8 points in a subsample of their group with SLI between childhood and adulthood. Mawhood, Howlin, and Rutter (2000) found a larger drop of 14 points in a group of 17 individuals with developmental language disorders followed until adulthood. Although these authors recently reported that by midadulthood IQ had substantially improved once again (Clegg, Hollis, Mawhood, & Rutter, in press), nonverbal IQ still remained significantly below that of unaffected siblings. Paul and Cohen (1984) reported a small group of children whose non-verbal IQ fell from a mean of 99 to 63 (a 36-point drop) over a period of five or more years. However, there is some suggestion that this pattern might not apply to all children with SLI. Stothard, Snowling, Bishop, Chipchase, and Kaplan (1998) found that at 15, children who had ‘resolved’ their language difficulties were indistinguishable from a control group on non-verbal skills. Conversely, children with ‘persistent’ SLI showed non-verbal IQ scores outside the normal range. Mean non-verbal IQs from earlier stages of the study were not reported, so no direct assessment of IQ decline can be made. The relationship between non-verbal IQ and language ability is not fully understood in general, let alone clinical, populations. In particular, issues surrounding direction of influence are complex. For example, does poor language constrain non-verbal IQ or are underlying cognitive mechanisms one cause of linguistic impairment? Alternatively, do IQ tests become more dependent on verbal mediation as children develop? There have been some noteworthy studies involving populations with communication impairment. Stevens and colleagues (2000), for example, concluded via longitudinal cluster analysis that higher IQ was necessary but not sufficient for optimal language outcome in autism. Farrell and Phelps (2000) found depressed general cognitive levels in those with SLI when compared to children with typical development (even though the group with SLI met traditional IQ criteria and more than one test was used). Stark et al. (1984) showed a stable pattern of non-verbal IQ for those children in language programmes who evidenced increasing verbal ability. All these studies suggest a more dynamic developmental pattern than is generally implied. Interestingly, as well as linguistic theories of SLI, some researchers now believe that certain processing deficits may partly explain the pattern of impairment. Studies have addressed both general processing limitations (Montgomery, 2003; EllisWeismer, Evans, & Hesketh, 1999) and more specific mechanisms (such as phonological short-term memory, Gathercole & Baddeley, 1990). However, the wider and more clinically focused question of whether children show increasingly impaired nonverbal abilities (and if so, which children are most at risk in this way) has not been comprehensively addressed. Most studies regarding IQ and SLI to date have been relatively short-term, small-scale or
Non-verbal cognitive development and language impairment
cross-sectional and thus investigations are needed that combine a large enough clinical sample with sufficiently long-term longitudinal methodology in order to explore this phenomenon in more detail. Given the above context, the present investigation used a large database of children with SLI (as defined at 7 years) who were assessed at 7, 8, 11 and 14 years of age. It is important to note that the study these data represent was not specifically designed to measure IQ. Nevertheless, it is felt that important information is available from such a comprehensive dataset. Thus, in a series of analyses this article aims to examine the following questions: 1. Does non-verbal IQ show a fall over the time course of the study and if so, for how many children? 2. Are there identifiably different patterns of IQ development within the larger group, even when baseline IQ is controlled for? 3. Does IQ development from 7 to 14 relate to language outcomes at 14 years? 4. To what extent does language skill at 7 years relate to IQ development up to 14 years?
Method Participants Data from 82 children with a history of communication impairment were used in the study. They were originally contacted as part of a longitudinal study involving 242 children identified and recruited at 7 years. The children were contacted again at 8 years, in their final primary school year at 11 years and at 14 years of age and invited to participate in the project. Selection at 7 years was first described in Conti-Ramsden, Crutchley, and Botting (1997), but was a random 50% sample of all Year 2 children attending mainstream language units in the UK. Language units are small specialist classrooms usually affiliated to mainstream schools, where high staff–child ratio, regular intensive speech therapy and sometimes specialist teachers are provided for children with persistent and quite complex language difficulties usually involving deficits in understanding and producing competent language. No a priori ‘SLI’ criteria were used at selection, except that those with known current hearing loss, ASD, moderate learning difficulties or major physical causes of language deficit were excluded (since the aim was to recruit a clinically defined group with specific language difficulties). It is important to note that because all children were recruited with language difficulties aged 7, they probably represent a population with particularly severe and persistent difficulties. At recruitment, the cohort consisted of 186 boys and 56 girls (girls forming 23% of the sample). Twenty-six children in the study were additionally exposed to a language other than English at home (see Crutchley, Botting, & ContiRamsden, 1997). These children came from a wide variety of different ethnic backgrounds and their other languages included Gaelic, German, Urdu and Cantonese. For all children, English was their preferred
319
language for both speaking and understanding. The socio-economic background of the children participating in the study resembled the distribution found in the general population: 53.1% of the participants came from households earning less than the average family wage for that year. In the 8-year stage of the study (one year later), 234 of the 242 children originally assessed (97%) continued to participate, and there were 200 participants at age 11 (83%). Children not included at various stages were either not traced or did not give consent for one or more stages of the study. At 14 years of age, a smaller number of families agreed to be assessed. Lower consent rates at this age may be due to the nature of this stage of the study which involved testing other family members, and/or to increased educational and lifestyle pressures. This resulted in 82 (34%) who have IQ data available at all four stages. Statistical comparisons revealed that this sample were no different from those who were nonparticipants at the final stage on original receptive language, expressive language, IQ or socio-economic variables. All 82 participants were clinically described as having SLI at the time of recruitment. In subsequent testing, two participants were recorded as having IQs of 69. However, they were not excluded, following Tomblin, Zhang, Buckwalter, and O’Brien (1999) who highlight the bias this might present to a study assessing cognitive abilities over time. Namely, they state that normal measurement error may cause children to fall slightly above or slightly below an arbitrary threshold (in the UK educational system an IQ of 70 is used as a cut-off for general learning difficulties) and that exclusion at time of recruitment is therefore not recommended. Of these 82, eight were exposed to languages other than English at home, and 18 (22%) were girls. Table 1 summarises participant cognitive and language status at baseline (7 years of age).
Procedure Following informed written consent from families, children were visited at school and assessed individually in a quiet room or area. In nearly all cases, testing was completed on one day at the child’s pace and with normal school breaks. Testing followed the British Psychological Society (1995) ethical guidelines and children were allowed to stop at any time.
Measures IQ measures. At 7 and 8 years of age children’s nonverbal IQ was tested using Raven’s Coloured Progressive Matrices (Raven, 1986). This non-verbal cognition test presents the child with a series of patterns from which a ‘piece’ is ‘missing’. The child is instructed to look very hard at the pattern and select (from six alternative ‘pieces’ printed below the pattern) the one and only piece that can complete the pattern. The test is split into three sets of twelve patterns each. Each set begins with more simple and progresses to more complex patterns. The child’s responses were noted and afterwards scored as correct or incorrect. The total score was then compared to age-relevant population norms and an IQ score assigned.
320
Nicola Botting
Table 1 Participant details in centiles for age (language tests) and standard IQ points
Mean SD Minimum Maximum
Bus Story at 7+
TROG at 7+
Raven’s IQ at 7
18.64 19.52 5.00 87.50
20.19 20.99 .50 90.00
105.59 15.27 69.00 126.00
N ¼ 82 for all tasks. +Centiles or percentiles for age are a form of standardised score where raw scores are assigned scores for age from 0 to 100; 50th centile represents the normative mean (child performs better than 50% of the population), 16th centile is approximately equivalent to 1sd below the mean and 2.5th centile approx. equivalent to 2sd lower than expected for age.
At 11 years of age, non-verbal IQ was determined using the Block Design and Picture Completion subtests from the Wechsler Intelligence Scale for Children (WISC III; Wechsler, 1992) as in other studies (e.g., Stothard et al., 1998). At 14, a full WISC III battery was used to calculate performance IQ.
Language measures. In order to examine the interface between language and IQ, three language measures were available. At 7 and 8 years of age, the Renfrew Bus Story (Renfrew, 1991), a test of expressive language involving the retelling of a story using picture prompts, was administered to all children, as was the
Test for Reception of Grammar (TROG; Bishop, 1983), which assesses sentence-level comprehension. At 14 years of age the full Clinical Evaluation of Language Fundamentals (CELF-III; Semel, Wiig, & Secord, 1995) was administered to all participants. This includes a number of subtests assessing expressive and receptive language.
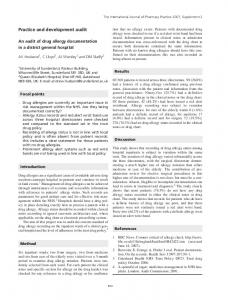
Results Aim 1 – examining the group’s development as a whole Figure 1 shows the trend for IQ over time (n ¼ 82 for all groups). Overall, a substantial drop of 23 points in mean performance IQ is observed from 7 years to 14 (repeated measures ANOVA, F(1,79) ¼ 234.43; p < .001). Three post-hoc pairwise tests show that as well as a major fall between 8 and 11 ()22.4 points; p < .001), there was a statistically significant rise between 7 and 8 years (3 points; p ¼ .022), and a significant fall between 11 and 14 ()3.2 points; p ¼ .046), although only the first of these remains significant when adjusted using Bonferroni. Overall, 55/82 children had scores that fell by more than 1sd (67%). Only one child (1.2%) showed a score that increased by more than 15 points. At 7 years of age 12% (10 children) had IQs below 85, but at 14 years, this had risen to 51% (42 children).
120
110
108.6 (sd=16.2)
100
105.6 (sd=15.3)
90
80
86.2 (sd=23.6)
IQ points
83.0 (sd=20.0)
70 7 year nvIQ
Figure 1
8 year nvIQ
11 year nvIQ
14 year nvIQ
Non-verbal cognitive development and language impairment
321
130
120
IQ change group 110
Group 4: fall below 70
100 Group 3: 90
fall to borderline Group 2:
80 fall within normal 70
Group 1: stable normal range
60 Group 5: 50
Abnormal range
PIQ at 7
PIQ at 8
PIQ at 11
PIQ at 14
Figure 2
group IQ scores over time are shown in Figure 2 and Table 2. There were only 4 children in group 1 whose non-verbal IQ score increased and of these only 2 children gained more than 10 IQ points. For the last 3 groups, no a priori degree of change (number of points) was set, so that any change that moved scores from above a threshold to below it was accepted. In actuality, only 13 of the 82 children moved fewer than 10 points, and these children were all members of group 1 (stable normal range) or group 5 (abnormal range). Predictably, the groups began with different baseline (7-year) IQ levels, which might explain the subsequent apparent differences between groups. A repeated measures ANCOVA time · group analysis was performed with 7-year IQ score as the covariant. This showed a significant group · time interaction (F (4, 76) ¼ 12.2; p < .001). Separate ANCOVAs at each assessment time revealed significant group differences in nonverbal IQ at 11 years (F (4,76) ¼ 13.9; p < .001) and at 14 years (F (4,76) ¼ 59.1; p < .001), but not at 8 years (F (4,76) ¼ 1.8; p ¼ 1.3). Separate ANCOVAs for each IQ group separately showed no differences across time for any group,
Aim 2 – different patterns of development Each case was assessed by hand and coded into one of 5 clinically motivated groups based on their changes in IQ score as follows: 1. Remains stable (moves less than 15 points) within the normal range (85 and above) or rises across ‘normal range’ categories (stable normal-range group: 20 children). 2. Falls within the normal/superior range (i.e., does not fall below 85 but falls at least 15 points ¼ 1sd) (falling normal-range group: 20 children). 3. Falls across threshold from the normal range (above 85) to borderline (between 70 and 85) (falling to borderline group: 18 children). 4. Falls across threshold from the normal range (above 85) to below 2sd (70) (falling to low IQ group: 14 children). 5. Falls or remains stable within abnormal range (started and finished below 85) (abnormal range group: 10 children). As can be seen, there were different sizeable groups who show different patterns over time. Mean
Table 2 Non-verbal IQ and CELF scores by non-verbal IQ change-group in mean (SD) standard points for age IQ group 1: 2: 3: 4: 5:
stable normal range falling normal range falling to borderline falling to low IQ abnormal range
*One-way ANOVA p < .01.
n 20 20 18 14 10
nvIQ7* 111.4 118.7 107.2 96.4 77.7
(12.1) (7.0) (9.3) (6.0) (3.7)
nvIQ8* 118.0 118.7 108.3 97.2 87.3
(14.2) (8.2) (10.5) (13.7) (14.5)
nvIQ11* 106.9 102.1 77.5 62.6 62.0
(15.5) (17.5) (12.3) (11.7) (13.8)
nvIQ14* 105.4 92.7 78.4 55.4 65.3
(13.9) (5.6) (3.8) (8.4) (10.1)
CELF14* 82.9 75.1 66.7 60.4 67.8
(17.8) (15.0) (14.1) (9.4) (12.7)
322
Nicola Botting
Table 3 Mean nvIQ and language scores by group, adjusted (using ANCOVA) for concurrent and previous scores Bus7** Non-verbal IQ group
nvIQ 14 adjusted for CELF at 14 and 7 yr
CELF14 adjusted for nvIQ at 14 and 7 yr
102.9 103.4 92.0 91.3 79.7 79.0 58.1 59.2 66.2 68.2
69.8 79.9 69.4 68.3 69.4 65.7 76.5 65.2 78.2 82.5
1: stable normal range 2: falling normal range 3: falling to borderline 4: falling to low IQ 5: abnormal range
Bus 8*
TROG7*
TROG8**
(raw percentiles (SD) for age & adjusted for 7-year nvIQ) 29.3 (28.7) 25.9 24.6 (16.7) 16.9 15.2 (13.2) 13.8 8.1 (5.7) 13.4 6.3 (4.0) 23.2
28.4 (23.8) 23.3 26.0 (25.4) 14.5 23.1 (22.5) 20.8 9.8 (16.6) 17.8 8.3 (10.3) 33.0
26.9 (26.1) 22.6 27.8 (22.8) 18.2 19.5 (17.8) 18.2 11.9 (14.3) 5.6 5.9 (5.4) 26.1
38.4 (29.9) 35.1 25.8 (19.3) 18.2 17.9 (19.6) 17.4 11.0 (8.4) 16.1 5.6 (6.7) 21.5
Significance of non-adjusted scores: *p < .05; **p < .01.
once 7-year IQ was controlled for. Thus in fact controlling for baseline IQ appears to have explained not the differences between groups, but some of the decline in scores over time.
Aim 3 – language outcome in relation to IQ Language outcome at 14 years was significantly related to both concurrent non-verbal IQ (Pearson’s r ¼ .57, p < .001) and to a lesser extent to the degree of IQ change (non-verbal IQ at 7 minus non-verbal IQ at 14; Pearson’s r ¼ .38, p < .001). CELF scores at 14 were also different across the 5 IQ groups (F (4,76) ¼ 6.0; p < .001). Tables 2 and 3 show mean language scores for each group at 14 and earlier ages respectively.
Aim 4: controlling for IQ and language influences Covarying. It was of interest to examine whether language outcome at 14 remained different after controlling for concurrent IQ and vice versa. Two separate ANCOVAs revealed that language differences disappeared when IQ at 14 was controlled (F (4,75) ¼ .66; p ¼ .62), whilst non-verbal IQ differences remained after controlling for 14-year language (F (4,75) ¼ 56.8; p < .001, df ¼ 4). See Table 3 for adjusted means. A similar analysis was performed, this time using baseline (7-year) language and IQ measures as covariates. Language function at 7 years was defined by the Bus Story and TROG tasks entered as separate covariates. Results show that 14-year IQ
scores were still different across groups, even controlling for initial language (F (4,74) ¼ 55.8, p < .001) but also that the reverse was true: 14-year language differences (as defined by CELF centile) were still evident after controlling for 7-year nonverbal IQ score (F (4,75) ¼ 3.5, p ¼ .012). A slightly different picture was seen when 7- and 8-year language scores were compared across groups. Although neither 7- nor 8-year Bus Story scores remained significant after controlling for 7year IQ, 8-year TROG scores (but not 7-year TROG) remained significantly different across IQ change groups (F (4,76) ¼ 2.9, p ¼ .029). Table 3 shows means and adjusted means by group.
Matching groups. In a different type of controlled analysis, the group of children whose IQs remained stable within the normal range (group 1 above) were individually matched on initial 7-year non-verbal IQ with children whose IQ fell who were taken from three of the other original IQ change groups: group 2 (who fell more than 15 points but remained within the normal range, i.e., >85, n ¼ 7); group 3 (who fell from the normal range into a borderline range, i.e., 70–85; n ¼ 6); and group 4 (who fell from the normal range entirely, i.e.,