Non-Visual Feedback for Pen-Based Interaction with Digital Graphs Steven A. Wall1 and Stephen A. Brewster2 Glasgow Interactive Systems Group, Department of Computing Science, University of Glasgow 17 Lilybank Gardens, Glasgow, G12 8QQ, UK. 1
[email protected] [email protected] www.tactons.org
ABSTRACT Access to simple visualisations such as bar charts, line graphs and pie charts is currently very limited for the visually impaired and blind community. Tangible representations such as heat-raised paper, and inserting pins in a cork-board are common methods of allowing visually impaired pupils to browse and construct visualisations at school, but these representations can become impractical for access to complex, dynamic data, and often require a sighted person’s assistance to format the representation, leading to a lack of privacy and independence. A system is described that employs tactile feedback using an actuated pin-array, which provides continuous tactile feedback to allow a visually impaired person to explore bar charts using a graphics tablet and stylus. A study was conducted to investigate the relative contribution of multimodal feedback (tactile, speech, non-speech audio) during typical graph browsing tasks. Qualitative feedback showed that the participants found it difficult to attend to multiple sources of information and often neglected the tactile feedback, while the speech feedback was the most popular, and could be employed as a continuous feedback mechanism to support graph browsing. Keywords: visually impaired, graphs, tactile, audio, speech, multimodal.
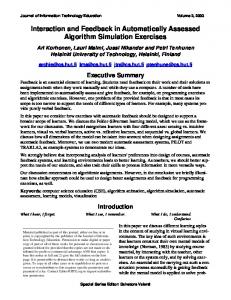
1. Introduction Access to data visualisations such as line graphs, bar charts and tabular data is highly problematic for many visually impaired people. People with low vision may find it difficult to apprehend data that is presented as a graph in a webpage, spreadsheet or other document. Lack of access imposed by current teaching materials can be a barrier to visually impaired people who wish to pursue studies in numerate disciplines, such as maths, the sciences and economics, and hence these sectors are deprived of potential students and employees from the visually impaired community. The most common techniques that are employed to allow non-visual browsing and construction of graphs in schools are raised paper diagrams and pin-boards. Heat-raised paper (Figure 1a) can be employed to generate a tangible representation of monochrome graphics, by printing a suitably formatted representation, and passing it through a special heater. Pins can be stuck in a cork board to represent data points, and joined by rubber bands in order to represent graphs and charts (Figure 1b). These “low-tech” representations are extensively used within the education of blind and visually impaired students, but suffer from several potential drawbacks.
Figure 1. (a) Raised paper bar chart, (b) pins in cork-board bar chart.
Cues that are discriminable by vision may not always be easily discriminated by touch, and care must be taken not to excessively clutter tactile diagrams with information (for example, Braille legends and labels cannot be made “small print”, like visual text, due to the limits of tactile acuity). For these reasons, the assistance of a sighted person with specialist knowledge of how to prepare and format the tactile representation is required, leading to a lack of independence and privacy for the visually impaired person. Low-tech tangible representations of data are inherently non-dynamic and of a low resolution: this can make certain data representations such as complex line graphs or pie charts difficult to produce using a pin-board approach. There is also a lack of access to digitally stored data, which is particularly salient given the vast amounts of information available over the internet, which is largely inaccessible to the visually impaired community. Tangible representations are also difficult to store and subject to wear-and-tear; a student’s work will often have to be destroyed at the conclusion of a class, so the materials can be reused by another student, which can also be very discouraging for a student wishing to achieve in a numerate discipline. Beyond the classroom, approaches to graph construction such as cork-boards and pins become entirely insufficient for day-to-day use in most professions due to their cumbersome use and lack of resolution. Screen readers are the most common accessibility aid used by visually impaired people to access information with a computer. This software converts text from the desktop (e.g. icon labels, menu items, message boxes) or from a document, such as a web page, word processor document, or spreadsheet in to a stream of synthetic speech. Tangible representations of visualisations possess several advantages over a screen reader based representation. They support rapid, non-sequential browsing of data using the whole of both hands (although this is indirect, through inference based on relative heights of bars, paths of lines, or other features, dependant on the particular representation), combined with a pictorial representation that promotes a representation of the data analogous to that employed by sighted colleagues. When seeking to create a computer-based tool to support browsing of graphs, it would be beneficial to obtain the benefits of a digital tool, while preserving the advantages of representations in tangible media. One means of achieving this may be to use virtual reality technologies such as haptic interfaces or tactile displays that allow for development of dynamic representations of data that are accessible to visually impaired people using the sense of touch. The “Tactons” project (www.tactons.org) is researching the application of tactile pin-array technology in the area of accessibility of graphs for visually impaired people. Tactile pin-arrays present dynamic information to the sense of touch using distributed mechanical deformation of the skin, usually over a small area such as the fingertips. Wall and Brewster (2006) previously described a system that employs tactile pin-array feedback for pen-based interaction with visualisations. Multimodal (haptic and audio) representations have been shown to perform better than force feedback technologies alone (Yu and Brewster, 2002). This paper investigates the use of speech feedback and sonification in conjunction with tactile pin-arrays. The aim of this study was to suggest guidelines for refining the interface, and for developing multimodal accessible solutions in general, and also to suggest areas where more empirical work is required in order to investigate combinations of tactile and audio feedback.
2. Previous research Work on using the sense of touch as an aid to computer accessibility has largely been focussed in three areas: augmentation of low-tech representations, force feedback technologies and tactile displays. 2.1 Augmenting low-tech representations Tangible diagrams have been enhanced through the use of digital technology, for example, the “Nomad” system (Parkes, 1988) used a touch tablet in conjunction with a raised paper diagram of a map. The tactile information could be supplemented with audio and speech cues that were triggered by pressing on the tablet. More recently, the T3 system has applied this technique to create teaching media, including a world atlas, where a student interacts with a tactile raised paper map in order to obtain information about countries of the world via synthetic speech (Wells and Landau, 2003). This approach combines the benefits of being able to obtain a pictorial overview of data through the sense of touch, with the ability to discern detailed information provided by synthetic speech. A drawback of these approaches is that to create new content, the tangible raised paper diagrams still need to be formatted and produced, which often requires a sighted person’s assistance. 2.2 Force feedback The first example of the use of force feedback devices to present visualisations to the blind was reported by Fritz and Barner (1996). Results from the Multivis project (www.multivis.org) showed that blind people were able to apprehend visualisations such as bar charts and line graphs presented using force-feedback devices, and answer questions regarding the data presented (Yu and Brewster, 2002).
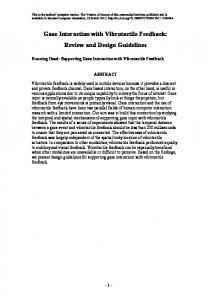
One of the main drawbacks of force feedback devices is that the user is denied the rich, spatially varying cues that are obtained when exploring a tactile diagram with the whole of both hands. Perception of shape is slower and more memory intensive, as the user must integrate temporally varying cues in order to build up an impression of the scene (Jansson, 2000). Further, many of the more sophisticated force feedback devices are very expensive for an individual. 2.3 Tactile Displays Tactile displays present information to the user’s skin via one or more smaller actuators. The VTPlayer mouse (www.virtouch2.com) is a commercially available, mouse based device that incorporates two tactile arrays, each consisting of a 4 by 4 array of individually controllable pins that deliver stimulation to the fingertips (Figure 2). The pins can be raised or lowered, but do not provide any resolution between this. During standard operation, the state of the pins is controlled by the pixels directly surrounding the mouse pointer. Using a simple threshold, a dark pixel corresponds to a raised pin, and a light pixel corresponds to a lowered pin. The user rests their index and middle fingers on the arrays while using the device like a standard mouse, and can feel a tactile representation of images. In this fashion, a blind user could potentially interpret the tactile cues and use them to navigate about a desktop environment, document or user interface.
Figure 2. The VTPlayer tactile mouse (www.virtouch2.com). The mouse incorporates two, 4-by-4 tactile pin-arrays, on which the index and middle fingers are placed during operation.
Jansson and Pedersen (2005) studied the performance of visually impaired users browsing a map with the VTPlayer. They observed that tactile information which indicated the crossing of borders on the map had no effect on performance in a navigation task, when used to supplement audio cues. The visually impaired users had many problems using the mouse. Mouse use is very difficult without any contextual information on target location when moving. The tactile arrays are too small to allow movement planning, further, in the absence of continuous visual feedback, the effects of unintentional rotations or lifting of the mouse go un-noticed. Wall and Brewster (2006) also observed in studies with the VTPlayer that the size and resolution of the array was too small to allow the users to plan their movements in a manner analogous to that of a sighted user using visual information. Jansson et al. (2006) conducted a second map-browsing study with the VTPlayer, which investigated the effect of providing textures (patterns of raised and lowered dots) within the borders on the map. They found that provision of texture had a significant effect, which was detrimental on the time to attain targets, surmising that the textures interfered with detecting crossing of borders.
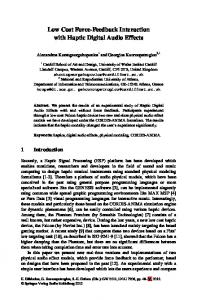
3. System Design and Description 3.1 System Overview Following requirements conducted with visually impaired students at the Royal National College in Hereford, UK, a prototype system for exploring visualisations with a tactile pin-array was developed and evaluated (Wall and Brewster, 2006). The prototype system (Figure 3) uses a Wacom Intuos-2 graphics tablet for user input. The user provides input to the system using the tablet’s stylus with their dominant hand, by moving the stylus on the active surface of the tablet, which controls a pointer in the application software. A VTPlayer mouse is used to provide continuous tactile feedback using the device’s pin-arrays, but the mouse input is disabled, hence the user rests their non-dominant hand passively on the mouse, with the index and middle finger on the VTPlayer’s tactile displays. The VTPlayer’s pin-arrays provide tactile feedback to inform the user whether or nor they have the pen positioned over a bar. Audio output is provided by synthetic speech feedback and sonification.
Figure 3. The user browses the graph using the graphics tablet for input with the dominant hand, and the VTPlayer tactile mouse for output with the non-dominant hand. 3.2 Graphics Tablet Previous research has identified that the majority of visually impaired users were uncomfortable with using a mouse as a pointing device. Therefore, input is provided by a Wacom graphics tablet with stylus (www.wacom.com). The stylus is held with the dominant hand and used to control a pointer in the application, while the non-dominant hand is rested passively on the displays of the VTPlayer. The graphics tablet operates as an absolute positioning device, which allows the user to more effectively employ proprioception as a means of continuous feedback, compared to when using a mouse. By moving the stylus to point at the same physical location on the tablet, the application will receive the same co-ordinates as an input. This is not the case with a mouse, which can be unintentionally lifted or rotated, creating an inconsistent mapping between the physical and virtual spaces. When exploring a simple bar chart, the X and Y axes are a constant point of reference for the user, therefore the tablet was augmented with tangible X and Y axes, providing an unambiguous position reference which the user could quickly identify to guide and direct their subsequent exploration of the graph. Creating a physical representation of the graph’s axes allows the user to quickly locate and disambiguate them from the graph’s data. 3.3 Tactile Feedback The software application takes a file containing a list of values and corresponding labels as input, and renders a graphical representation of a bar chart (Figure 4a). The VTPlayer renders tactile information based on the corresponding pixel information surrounding the mouse pointer, as the user explores the graph by moving the stylus. The pins of the device are raised as the stylus moves over a bar and lowered when the stylus is not over a bar. The bars are not patterned so as not to unnecessarily clutter the tactile representation with shapes and textures, which are confusing for users (Wall and Brewster, 2006, Jansson et al., 2006). The status of the VTPlayer pins can therefore be employed for navigational purposes (“Am I on a bar?”) or to estimate values of bars indirectly (“How high is the bar?”).
Figure 4. (a) Representation of a graph within the software, and (b) raised paper version.
3.4 Speech Feedback The stylus can also be used to instantiate speech feedback by tapping the tip on the surface of the tablet. This triggers some contextual speech feedback that tells the user whether they are (a) outside the graph,
and if so, in which direction, (b) on a bar, and the label and value of the bar, (c) above a bar, and the name of the bar, or (d) in-between two bars, in which case the name of both bars are given. Preferences for parameters of the speech, such as speed, or the voice that is used, can be set by the user through the windows control panel. 3.5 Sonification By clicking the stylus button, users can hear a sonification of the data. For each bar in the graph, in order, from left to right, a MIDI piano note is played, with the pitch proportional to the data value. The purpose of this was to allow the user to obtain a quick, auditory overview of the graph (e.g. where particularly high or low areas were), such that this could be used to subsequently direct their querying of the data values. The notes were played sequentially at 200 millisecond intervals using the general MIDI acoustic grand piano instrument (instrument 0). The highest value in the graph corresponded to MIDI note 100, the lowest value in the graph corresponded to MIDI note 35, as recommended by Brown et al. (2003), with the rest of the notes scaled linearly in-between.
4. Evaluation In order to evaluate the visualisation system, a usability evaluation was conducted with visually impaired computer users at RNC Hereford, in November 2005. The purpose of the evaluation was to gather feedback from the users in order to identify guidelines to further refine the design. As the system was at a prototype stage, evaluations were qualitative, using a think-aloud methodology and post-hoc interviews with participants. Specifically, we were interested in finding out about how the participants would use the different output modalities of speech, tactile and non-speech audio feedback to help them navigate and comprehend the visualisation, using a series of probe questions. 4.1 Participants Ten visually impaired participants took part in the evaluation, nine were students at RNC and one was a member of staff at the college. Some of the subjects were congenitally blind, while others were adventitiously blind. The subjects had various levels of residual vision. Due to the limited subject pool we decided not to control for these factors in the evaluations. The evaluation lasted approximately one hour per participant. 4.2 Experimental Procedure The participant was then introduced to the graphics tablet and the VTPlayer tactile pin-array, and the experimenter explained how to use the devices and how to interact with the system. The participants then undertook a training exercise intended to give them some insight in to how the tablet and tactile display system worked together. The training introduced the participant to the representation of graphs, using both the tactile pin-array and audio feedback. This was introduced by way of analogy to a raised paper diagram. The participant was handed a raised paper version of a bar chart consisting of twelve bars. The representation of the graph did not have any labels or legends, and was exactly as the representation appeared in the application software (Figure 4b). The experiment itself used example graphs with verbally delivered probe questions from the experimenter in order to encourage the participant to use the tools and techniques available to them, and to stimulate their opinion on the relative contribution of the different interface components. Analysis was based on user comments at this stage, as the interface was still in a prototype stage. Four graphs were shown to the participants, and the corresponding questions were as follows. Graphs were based on meteorological data (www.worldclimate.com): 1.
2.
3.
Average temperature per month (in degrees centigrade) in Bangkok: Describe the overall shape of the graph (rises to a peak in July and then decreases), what are the hottest and coolest months (July and January)? Average rainfall (mm) for various cities of the world in April (12 cities): Which has the most rain out of Brisbane, Geneva and Milan? (Brisbane) Is it wetter in Christchurch or San Francisco? (Christchurch) Which city has the highest rainfall overall? (Auckland) If there was twice as much rain in Copenhagen, would it be wetter than Geneva? (Yes). Average rainfall (mm) per month in Brisbane: Describe the general trend of the graph (Starts high in January, decreases to a minimum in August and September before increasing again up to December). What were the highest and lowest months for rainfall? (January and September, respectively).
4.
Average rainfall (mm) for various cities of the world in October (12 cities): Which has the most rain out of Brisbane, Copenhagen and Paris? (Brisbane) Is it wetter in Amsterdam or Venice? (Amsterdam) Which city has the highest rainfall? (Milan) If there was twice as much rain in Budapest would it be higher than Brisbane? (No)
Finally, the participant took part in a post-hoc interview with the experimenter. With the participant’s consent, the entire training and evaluation process was recorded using a portable MP3 player with built in microphone. The experimenter also made notes during the evaluation of user behaviours and strategies that were observed.
5. Results and discussion. The recordings of each participant were transcribed and analysed in order to derive common preferences and recommendations for improving the usability of the interface. The key findings were as follows: 5.1 Speech feedback was the most preferred modality of the participants. All the participants relied extensively on the use of speech feedback in order to answer the questions. Three participants openly remarked that this was because they were very familiar with speech representations due to prior experience with screen readers. Two of these three participants also commented positively on the fact that the speech gave them an exact value to several decimal places, which would be difficult to estimate when using a tactile diagram on raised paper. •
“I did that because I knew the speech was there … that’s just what I’ve been doing for so long”, P1
•
“… you can obtain that information a lot faster with the speech than you could before (without speech) because it was sometimes difficult to feel it when there was only a slight difference”, P2
•
“… you’ve got the height there with the speech, you just know it, you’re just obtaining the amount and the highest bar absolutely in one, immediately.”, P2
•
“…having the facility of speech… I’m taking advantage of that and relying on it to its full potential” – P6
As requesting the speech information was such a common action, the means of obtaining the information (tapping the pen) had to be efficient and free of errors. Five of the ten participants wanted the option to receive this information automatically while browsing the graph, without having to tap the pen or click a button. Lifting the pen to tap occasionally caused errors in positioning when placing the pen back down. Similarly, clicking the stylus button occasionally caused the pen to slip on the surface of the tablet. •
“I still think for someone like me it’d be better to get speech straight away rather than tap the pen or press a button”, P9
5.2 More control is needed over the sonification. In comparison to the speech feedback, the participants did not often use the sonification voluntarily. Five participants highlighted a lack of control over the sonification and that it played too fast for them to be able to apprehend the information. This made comparison between values difficult. It was often the case that a participant would want to compare a subset of the values, but would have no option to do so, without having to listen to the entire sonification again. •
“… and then you could think about it a little bit, but it’s (imitates sonification in exaggerated manner), and it takes about 2 seconds … where as with the speech you can do it in your own time. So you’re losing the control over how fast you want the information.”, P2
•
“It would be better if you could control the speed, this would give you an overall view at that speed, but if you slowed it down you could pick out the specific months”, P7
•
“I think it was a little bit too fast because I got a bit confused. I was able to get a good picture of how they changed, but I think I would be able to get a better picture of where the changes were if it was a bit slower.”, P8
Four participants specifically stated that they thought playing the notes in response to their movements with the pen (e.g. when they move over a bar, play the corresponding note) would allow them to control the speed of the presentation, and also to select a subset of the values to explore more easily. •
“it’s such a quick sound, it’s not sort of accurate, but if I could go over it and only make one note per bar it would be easier that way”, P6
•
“ … if you could move your pen like this and you could move across and go (imitates sonification) … to get more control over the speed of the notes, and if you weren’t sure of the difference between the two then you could quickly check by putting the pen on those two. You choosing the notes would make it sink in better because you’re actually making the sound happen”, P8
5.3 Tactile feedback was often neglected by the users. Four of the participants often forgot to place their non-dominant hand on the tactile displays of the VTPlayer. When probed by the experimenter about this, it was most often the case that the participants found it difficult to attend to multiple sources of information. •
“When you’re using the mouse and the speech and the pen it’s a lot to take in at once”, P2
•
Experimenter: “I notice you haven’t got your hand on the tactile?” P3: “I was too busy listening”.
•
“I was so focussed on here I wasn’t paying attention to the mouse”, P7
The speech feedback gave enough contextual information to allow the participants to navigate without using the tactile feedback. Participants were able to explore the graph and apprehend the information needed to answer the questions by relying on the speech feedback to control the pen movement. Essentially, the speech was used as a means of continuous feedback to control the pointer. •
“… the good point is that the speech was guiding me all the time and giving me several lots of information”, P1
One participant suggested that mounting the tactile feedback in the pen might free them from having to attend to too many separate sources of information. This would also free the non-dominant hand and allow it to be used for place-marking, guidance, or to gain more stability with the pen. •
“I was thinking, well you’re holding the pen, the nib, if you’re holding the nib when you reach the top of the graph, all of a sudden the nib comes up, ‘right that’s the top’ … well, yes, you’d feel it in some way on your finger … if you could incorporate it in to the pen you wouldn’t need two separate devices.”, P7
5.4 Obtaining multiple data labels using speech was error prone and time consuming.. When working with nominal data on the X-axis (for example, the cities of the world in questions 2 and 4) the participants would often explore all the bars in a graph before attempting to answer a question. This could be quite a time consuming task and prone to errors, due to the number of movements of the stylus and taps that were required to access the speech information. The experimenter noted that it was confusing for the participant if they thought they had traversed to the next bar, but instead tapped on the same bar again, or the pen slipped and instead tapped between two bars. 5.5 Obtaining an overview of the data through tactile feedback was time consuming. Three of the participants commented that access to data through the tactile feedback was currently impossible given the absence of any scale, gridlines or markers that could be used to help estimate the values. Suggestions included displaying gridlines or scale through tactile information, or through audio, using subtle sound cues. •
“… every ten you had a dot, it was going “beep”. If you was going up the graph from the Xaxis and every sort of ten millimetres there was a piano key, you’d know where you were, wouldn’t you?” – P7
6. Conclusions and future work In summary, the multimodal output provided sufficient feedback to allow the users to interact with the system. A number of possible refinements were derived through analysis and consideration of the results of the usability evaluation.
The speech feedback was extensively used by all the participants. For all the participants, and many blind computer users, screen readers are a part of their daily life, and a familiar technology. Speech feedback can rapidly deliver exact information without the need to encode/decode in another modality. As speech is very commonly used, access needs to be quick and error free. User feedback indicates that tapping with the stylus, or clicking the stylus button might not be the most appropriate means of requesting speech information, therefore these interactions could be investigated to quantify error rates and accuracy. Speech feedback can be used to present resources such as legends, axis titles and labels for nominal data series, but these need to be implemented as “one click” actions, in order to reduce the possible errors. One possible solution would be for the user to click or gesture on the relevant axis to receive the information. The tactile pin-array feedback was neglected by the users. One solution to attempt to alleviate this would be to avoid multiple sources of stimulation and control. For example, tactile feedback could be delivered through the stylus, or by vibrating the tablet, rather than by having the user attend to a separate information source with their non-dominant hand. Tactile feedback could be used to provide subtle cues to aid with target acquisition and error retrieval (e.g. detecting slip-off target errors). In future work we will investigate and quantify the role of tactile feedback in non-visual target acquisition tasks. Tactile feedback can also be better supported and given context by employing tangible media, such as the tangible X and Y axes in the application as described. Tactile display provides dynamic feedback, but tangible media can be used to give context and meaning through “the bigger picture”, as it can be rapidly explored with the entire hand. As an example, tangible grid lines could be employed on the graphs to communicate scale, provide navigation aids, and to allow the user to use the dynamic tactile feedback to estimate bar heights. Allowing more personalization and control may make the sonification more usable. Being able to control the speed of delivery and being able to filter the information to make comparisons more easily were the most common requests. Supplementing proprioceptive and kinesthetic feedback with audio feedback, by playing the notes in response to the users movement may support apprehension of data through this technique. This will be implemented and tested in a future version of the system. These guidelines will be employed to develop further iterations of the prototype system, and may be useful to designers developing multimodal solutions for other accessible applications, such as web browsing or gaming.
7. References L M Brown, S A Brewster, R Ramloll, M Burton and B Riedel (2003), Design guidelines for audio presentation of graphs and tables, Proc. ICAD 2003 Workshop on Auditory Displays in Assistive Technologies, Boston, pp. 284-287. J P Fritz and K Barner (1996), Design of a haptic graphing system, Proc. 19th RESNA Conference, Salt Lake City. G Jansson (2000), Basic issues concerning visually impaired people's use of Haptic displays, Proc. 3rd International Conference on Disability, Virtual Reality and Associated Technologies, Alghero, Sardinia, Italy, pp. 33-38. G Jansson and P Pedersen (2005), Obtaining geographical information from a virtual map with a haptic mouse, Proc. XXII International Cartographic Conference (ICC2005), A Coruna, Spain, Available on conference CD-ROM. G Jansson, I Juhasz and A Cammilton (2006), Reading virtual maps with a haptic mouse: effects of some modifications of the tactile and audio-tactile information, The British Journal of Visual Impairment, 24, 2, pp. 60-66. D Parkes (1988), "Nomad": An audio-tactile tool for the acquisition, use and management of spatially distributed information by visually impaired people, Proc. of the Second International Symposium on Maps and Graphics for Visually Impaired People, London, pp. 24-29. S Wall and S A Brewster (2006), Feeling what you hear: tactile feedback for navigation of audio graphs, Proc. of ACM CHI 2006, Montreal, Canada, pp 1123-1132. L R Wells and S Landau (2003), Merging of tactile sensory input and audio data by means of the talking tactile tablet, Proc. Eurohaptics 2003, Dublin, Ireland, pp.414-418. W Yu and S A Brewster (2002), Comparing Two Haptic Interfaces for Multimodal Graph Rendering, Proc. of IEEE VR2002, 10th Symposium on Haptic Interfaces for Virtual Environment and Teleoperator Systems (Haptics 2002), Florida, USA.