Nondestructive evaluation (NDE) of wood materials has a long history of application in the wood products ... costly scanning techniques (Benson-Cooperet al.
NONDESTRUCTIVE EVALUATION FOR SORTING RED MAPLE LOGS Xiping Wang Robert J. Ross David W. Green USDA Forest Service Forest Products Laboratory One Gifford Pinchot Drive Madison, WI 53705-2398
Karl Englund Michael Wolcott Washington State University Pullman, WA 99163 ABSTRACT Existing log grading procedures in the United States make only visual assessments of log quality. These procedures do not incorporate estimates of the modulus of elasticity (MOE) of logs. It is questionable whether the visual grading procedures currently used for logs adequately assess the potential quality of structural products manufactured from them, especially those in which MOE is of primary concern. The purpose of this study was to investigate the use of stress wave NDE techniques to sort red maple logs for the potential quality of lumber obtained from them. One hundred seven red maple logs were nondestructively evaluated using longitudinal stress wave tech niques and sorted into four stress-wave grades. The logs were then broken down into cants and lumber. The same procedure was used to obtain stress wave times in cants and lumber. The lumber specimens were then dried and graded using a transverse vibration technique. The results of this study show that good relationships exist between stress wave times measured in logs, cants and the lumber produced from the logs. It was found that log stress-wave grades have a positive relationship with the resulting lumber grades. Logs with high stress-wave grades produce high-grade lum ber. These findings indicate that the longitudinal stress wave technique could be used in sawmills to sort logs/cants for the production of high MOE products.
INTRODUCTION Nondestructive evaluation (NDE) of wood materials has a long history of application in the wood products industry. Visual lumber grading is perhaps one of the earliest NDE forms. Visual assessment of a piece of lumber requires the grader to estimate a strength ratio on the basis of observed external defects. The ratio is used to estimate the strength of lumber relative to a similar piece without defects. The estimation is entirely subjec tive and is governed by the judgment of the grader. Furthermore, the value assigned to clear lumber of compa rable size is only an estimated minimum based on tests of small, clear specimens. Machine stress rating (MSR), a non-visual NDE technique, offer an opportunity to eliminate both of these limitations. As currently practiced in North America, MSR couples visual sorting criteria with nondestructive measurements of the stiffness of a piece of lumber to assign it to an established grade based on a pre-established strength-MOE relationship (Galligan et al. 1977). Annually, nearly 900 million board feet (BF) of softwood lumber is graded in this manner (Ross et al. 1998). Similarly, laminated veneer lumber production facilities use
Hardwood Symposium Proceedings
95
May 11-13, 2000
stress wave NDE techniques to sort incoming veneer into strength categories, which are established through empirical relationships between stress wave velocity and strength (Sharp 1985). Although research efforts have paved the way for the successful use of NDE with finished products, little effort has been expended on developing NDE techniques for use in grading or sorting logs for structural quality. Existing log grading procedures in the United States make only visual assessments of log quality (Green and Ross 1997). These procedures do not incorporate estimates of the modulus of elasticity (MOE) of the wood in logs. It is questionable whether the visual grading procedures currently used for logs adequately assess the potential quality of structural products manufactured from them, especially those in which MOE is of primary concern. In addition, the research that has been conducted on log NDE has focused on the use of relatively costly scanning techniques (Benson-Cooperet al. 1982, Burgess 1984, Chang et al. 1987, Funt and Bryant 1987, Holoyen and Birkeland 1987, Taylor et al. 1983). which can have limited applications in the field. Techniques that have been investigated include NMR and x-ray-based tomography. In recent years, some research has been conducted to investigate the feasibility of using longitudinal stress wave/ vibration techniques for evaluating log quality. Aratake et al (1992) utilized longitudinal vibration characteris tics to estimate the quality of lumber obtained from 59 Sugi logs and observed a strong relationship between the natural frequency of logs and log MOE. Ross and others examined the relationship between log measurements and the quality of lumber obtained from 95 balsam fir logs and 98 eastern spruce logs (Ross et al. 1997). They observed useful relationships, with the relationship being exceptionally strong for eastern spruce logs. Green and Ross (1997) described the results from a series of studies using the same technique with Douglas-fir, westem hemlock, and southern pine logs in which comparable results were obtained. The objective of this study was to investigate the use of longitudinal stress wave NDE techniques to sort red maple logs based on the potential structural quality. Specific objectives were to 1) examine the relationships between the stress wave times measured in logs and corresponding cants and lumber; and 2) determine if a positive relationship exists between log stress wave grades and the grades of lumber obtained from the logs.
MATERIALS AND METHODS One hundred seven red maple logs were evaluated at a sawmill in Buchanan, West Virginia. For each log, longitudinal stress wave transmission time was determined using the experimental setup shown in Figure 1. The setup consisted of a specially equipped personal computer, a hand-held hammer, and an accelerometer fixed to one end of the log. A stress wave was induced in the log through a hammer impact on the opposite end, and the resulting stress wave was recorded in the computer. A detailed description of the instrumentation and analysis procedures used is given by Ross et al. (1994), and a discussion of the application to large wood specimens is included in Schad et al (1995).
Figure 1. Experimental setup for stress wave measurement.
Hardwood Symposium Proceedings
96
May 11-13, 2000
After testing each log, they were sawn into 6x8-in. (152x203-mm) cants. Each cant was then sawn into 2x6-in. (51x152-mm)lumber. Special care was taken to ensure that individual lumber specimens could be traced to the cant and the log from which they were sawn. Stress wave transmission times in cants and lumber were then determined in green condition. After stress wave tests, the green lumber was placed in a dehumidification kiln and dried to approximately 12 percent moisture content. Stress wave time in lumber was also obtained in dry condition. Flatwise MOE was then determined for each dry lumber specimen using a transverse vibration NDE technique (Ross et al. 1991).
RESULTS AND DISCUSSION Stress wave transmission times have been recognized as good indicators of wood strength and stiffness. In this paper, the stress wave times (SWT) measured in red maple logs and corresponding cants and lumber were reported on the unit per length basis (time/length). Therefore, lower SWT, that is higher stress wave speed, indicates higher strength and stiffness. The SWT of logs ranged from 77.3 to 108.2 µs/ft with an average of 88.1 µs/ft, which was about 3 percent higher than that of cants and green lumber. The SWT value for lumber was the average value of all four pieces of lumber obtained from each cant. It was found that the SWT of green lumber was very close to that of cants. For cants, SWT ranged from 75.4 to 104.3 µs/ft with an average of 85.6 µs/ft. For green lumber, SWT ranged from 72.6 to 105.7 µs/ft with an average of 85.1 µs/ft. However, due to the loss of moisture content, the SWT measured on dry lumber decreased about 18 to 20 percent compared with that measured in green lumber, cants, and logs. Regression analyses were also conducted to compare SWT values for logs and the corresponding cants and lumber obtained from them. Specifically, stress wave times were compared for logs and cants, cants and lumber, and logs and lumber. Results obtained from those analyses are summarized in Table 1. The results indicated that strong relationships existed between SWT of logs, cants, and green lumber (r=0.75 - 0.92). A good relationship was also found between cants and dry lumber. As expected, the correlation coefficient was not very high for dry lumber and logs (r=0.68). This could be caused by several important factors that were involved in the conver sion from logs to dry lumber, such as loss of moisture, removal of external materials, and drying defects. However, these relationships are strong enough to indicate that it should be possible to use stress wave time (SWT) to sort red maple logs for the production of structural products. Table 1. Regression analyses of stress wave times (SWT) for red maple logs and correspond ing cants and lumber produced from logsa. Stress wave times (SWT) inlogs, cants, and lumber (µs/ft) Y SWT in cant SWT in green lumber SWT in green lumber SWT in dry lumber SWT in dry lumber a
X SWT in log SWT in log SWT in cant SWT in log SWT in cant
Linear regression model
Correlation coefficient
Standard error of estimate
y=a+bx y = 1734 + 0.8775x y = 2413 + 0.8245x y = 742 + 0.9432x y = 4870 + 0.8297x y = 3525 + 0.9203x
r 0.82 0.75 0.92 0.68 0.80
Syx 461.2 541.8 318.4 680.6 551.0
1 µs/ft = 3.28 µs/m.
Hardwood Symposium Proceedings
97
May 11-13, 2000
Based on above results obtained from stress wave measurements, the red maple logs were sorted into four grades (G-I, G-II, G-III, and G-IV) as follows: G-I < 83 µs/ft;
G-II = 83 - 91 µs/ft;
G-III = 91 - 100 µs/ft;
G-IV > 100 µs/ft.
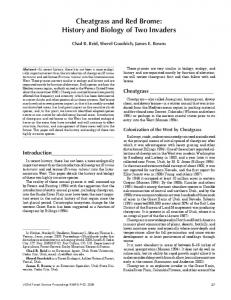
It was found that the majority (78 percent) ofthe logs fell into G-I and G-II grades. Only 15 percent of logs were in G-III grade and 7 percent of logs were in G-IV grade. Figure 2 shows the average lumber MOE for different log stress wave grades. Note that the lumber produced from G-I logs has the highest average MOE of 1.86 x 10⁶ lb/in2, followed by the lumber produced from G-II logs, with an average MOE of 1.79 x 10⁶ lb/in2, and the lumber from G-III logs with an average MOE of 1.60 x 10⁶ lb/in2. The lumber from G-IV logs has the lowest average MOE of 1.43 x 10⁶ lb/in2.
Figure 2. Average lumber MOE for different log stress wave grades.
The relationship between log stress-wave grades and lumber quality can be further illustrated by comparing log grades to lumber grades. The lumber produced from logs were therefore broken down into four grades (g1, g2, g3, and g4), based on lumber MOE determined from transverse vibration tests: g1 > 2.00 Mpsi; g2 = 1.61 - 2.00 Mpsi; g3 = 1.20 - 1.60 Mpsi; g4 < 1.20 Mpsi. Figures 3, 4, 5, and 6 show the lumber yields for four different log stress-wave grades. Note that the lumber yield is shown on the Y-axis as the number of boards produced. Seventy-one percent of lumber from G-IV grade logs (SWT > 100 µs/ft) fell into g3 and g4 grades, and no g1 lumber was produced in this log grade. In G-III
Hardwood Symposium Proceedings
98
May 11-13, 2000
grade logs (91 < SWT < 100 µs/ft), 87 percent of lumber produced was g2 and g3 grades, 7 and 6 percent of lumber fell into g1 and g4, respectively. In G-II (83 < SWT < 91 µs/ft) and G-I (SWT < 83 µs/ft) logs, the percentage of high grade lumber continuously moved up to 73 and 86 percent, respectively. Clearly, log stresswave grades have a positive relationship with the grades of lumber produced from the logs. Logs with high stress-wave grades contain high-grade lumber. If we use a log cut-off value of 91 µs/ft in this case, we can expect a 76 percent yield of g1 and g2 lumber from the logs. This indicates that a significant improvement in the mechanical performance of red maple could be achieved with a simple sort-model to segregate "high"and "low" quality stress-wave-rated logs.
CONCLUSIONS The results of this study show that good relationships exist between stress wave times measured in logs, cants and the lumber produced from the logs. Log stress-wave grades have a positive relationship with the grades of
Figure 3. Lumber yield for log stress wave grade G-IV (log stress wave time > 100µs/ft)
Figure 4. Lumber yield for log stress wave grade G-III (log stress wave time: 91 - 100µs/ft)
Figure 5. Lumber yield for log stress wave grade G-II (log stress wave time: 83 - 91µs/ft)
Figure 6. Lumber yield for log stress wave grade G-I (log stress wave time < 83µs/ft)
Hardwood Symposium Proceedings
99
May 11-13, 2000
lumber produced from the logs. It was found that logs with high stress-wave grades produced high-grade lumber. If we use a log cut-off value of 91 µs/ft in this case, we can expect a 76 percent yield of g1 and g2 lumber from the logs. Therefore, it was concluded that this longitudinal stress wave technique could be used in sawmills to sort logs/cants for the production of high MOE products.
REFERENCES
Hardwood Symposium Proceedings
100
May 11-13, 2000
Hardwood Symposium Proceedings
101
May 11-13, 2000