Nov 3, 2015 - forces. By performing active microrheology and tracking micron-sized vesicles in the cytoplasm of living oocytes, we provide unprecedented ...
Nonequilibrium Dissipation in Living Oocytes É. Fodor,1, ∗ W. W. Ahmed,2, ∗ M. Almonacid,3, ∗ M. Bussonnier,2 N. S. Gov,4 M.-H. Verlhac,3 T. Betz,2 P. Visco,1 and F. van Wijland1, 5 1
arXiv:1511.00921v1 [q-bio.SC] 3 Nov 2015
Laboratoire Matière et Systèmes Complexes, UMR 7057 CNRS/P7, Université Paris Diderot, 10 rue Alice Domon et Léonie Duquet, 75205 Paris cedex 13, France 2 Physico-Chimie Curie, UMR 168 CNRS/P6, Institut Curie, 11, rue Pierre et Marie Curie, 75005 Paris, France 3 CIRB, Collège de France, CNRS-UMR7241, INSERM-U1050, 75231 Paris, Cedex 05, France 4 Department of Chemical Physics, Weizmann Institute of Science, 76100 Rehovot , Israel 5 Department of Chemistry, University of California, Berkeley, CA, 94720, USA (Dated: November 4, 2015) Living organisms are inherently out-of-equilibrium systems. We employ new developments in stochastic energetics and rely on a minimal microscopic model to predict the amount of mechanical energy dissipated by such dynamics. Our model includes complex rheological effects and nonequilibrium stochastic forces. By performing active microrheology and tracking micron-sized vesicles in the cytoplasm of living oocytes, we provide unprecedented measurements of the spectrum of dissipated energy. We show that our model is fully consistent with the experimental data, and we use it to offer predictions for the injection and dissipation energy scales involved in active fluctuations. PACS numbers: 05.40.-a, 05.10.Gg, 02.50.Ey, 87.10.Mn
Perrin’s century old picture [1] where the Brownian motion of a colloid results from the many collisions exerted by the solvent’s molecules is a cornerstone of soft-matter physics. Langevin [2] modeled the ensuing energy exchanges between the solvent and the colloidal particle in terms of a dissipation channel and energy injection kicks. The key ingredient in the success of that theory was to completely integrate out the "uninteresting" degrees of freedom of the solvent whose properties are gathered in a friction constant and a temperature. In this work we take exactly the reverse stance and ask how, by observing the motion of a tracer embedded in a living medium, one can infer the amount of energy exchange and dissipation with the surrounding medium. The main goal is to quantify the energetic properties of the medium, both injection and dissipation-wise. This is a stimulating question because there are of course striking differences between a living cell and its equilibrium polymer gel counterpart, to which newly developed [3, 4] methods of nonequilibrium statistical mechanics apply. Beyond thermal exchanges that fall within the scope of a Langevin approach, ATP consumption fuels molecular motor activity and drives relentless rearrangement of the cytoskeleton. This chemically driven continuous injection and dissipation of energy adds a nonequilibrium channel that eludes straightforward quantitative analysis. In short, a living cell is not only a fertile playground for testing new ideas from nonequilibrium physics, but also one in which these ideas can lead to a quantitative evaluation of an otherwise ill-understood activity which is of intrinsic biophysical interest. Our work addresses both aspects by a combination of active microrheology, tracking experiments, and theoretical modeling. One experimental way to access nonequilibrium physics
in the intracellular medium is to focus on the deviation from thermal equilibrium behavior of the tracer’s position statistics: forming the ratio of the response of the tracer’s position to an infinitesimal external perturbation to its unperturbed mean-square displacement leads to a quantity that only reduces to the inverse temperature when in equilibrium, by virtue of the fluctuation-dissipation theorem (FDT). Earlier tracking experiments supplemented by microrheology techniques have allowed the departure from equilibrium to be analyzed in terms of this ratio in a variety of contexts [5–9] ranging from reconstituted actin gels to single cells. However the limitations inherent to this effective temperature are well-known: it bears no universal meaning as it depends on the observable under scrutiny, thus it cannot be equated to a bona fide temperature, and hence it does not connect to the underlying microscopic dynamics. Here we exploit a body of theoretical methods that have been developed over the last ten years to infer quantitative information about the nonequilibrium processes driving intracellular dynamics. Within the realm of stochastic thermodynamics [3, 4] –as it strives to extend concepts of macroscopic thermodynamics to small and highly fluctuating systems [10–12], the Harada-Sasa equality stands out as being particularly suited to our goal. Nonequilibrium systems are characterized by the dissipation of energy, which is absorbed by the surrounding thermostat via a transfer from the system to the bath. The HaradaSasa equality connects the rate of dissipated energy to the spatial fluctuations in a nonequilibrium steady-state system [13, 14]. The feasibility of measuring the various ingredients in the Harada-Sasa framework was demonstrated in model systems such as a micron-sized colloidal particle in a viscous fluid [15, 16], and then later generalized to a
2 (a)
(b)
oocyte
optical trap
collagen filaments
(c)
(d) Position (µm)
↵ = 0.58 ± 0.01 ⌧↵ = (0.10 ± 0.04) s G0 = (1.8 ± 0.3) Pa
101
G0 G00 100
100
101
102 103 Frequency (Hz)
104
Position (µm)
0.3
102 G0 , G00 (Pa)
viscoelastic medium [17]. It has also been used to quantify the efficiency of an isolated molecular motor [18]. The systems to which we apply this equality are micronsized vesicles that are present in the cytoplasm of mouse unfertilized eggs, known as oocytes. Their motion in the cell is mainly regulated by myosin-V motors on the actin network [19–21]. The use of such vesicles allows us to capture the intrinsic intracellular dynamics without using artificial external particles that may alter the environment. From a physics perspective, oocytes are also major assets since they constitute a rare example of a living cell that remains steady on the timescales of hours. They are spherical in shape, with typical radius of about 40 µm, and their nucleus is centrally located at the end of Prophase I [22]. In this paper, we directly access nonequilibrium dissipation within the cell. We first characterize the intrinsic rheology of the medium experienced by the vesicles. Then, we present a minimal microscopic model for the dynamics of the vesicles which is driven by the nonequilibrium reorganization of the cytoskeleton by molecular motor generated forces. We use our theoretical modeling and the HaradaSasa equality to predict and quantify the rate of nonequilibrium dissipated energy in our experimental system. Finally, we employ this new prediction to evaluate how nonequilibrium activity varies across the cell, and we offer interpretations about the role of molecular motors in vesicle motion. Experimental setup.—Mouse oocytes are collected from 13 week old mice and embedded in a collagen gel between two glass coverslips [23, 24]. We measure the local mechanical environment surrounding vesicles in living mouse oocytes using active microrheology [5, 25]. We use an optical tweezer to trap vesicles and apply a sinusoidal oscillating force [Fig. 1]. The resulting displacement of the vesicle due to the applied force reflects the mechanical response of the system. We deduce the complex modulus of the intracellular environment surrounding the vesicle from the generalized Stokes-Einstein relation G∗ = 1/(6πaχ) ˜ , where χ ˜ is the Fourier response function, and a is the vesicle’s average radius. We find that the intracellular mechanics exhibits a power law rheology at high frequencies, and levels off at lower frequencies, as seen in the real and imaginary parts of G∗ , respectively denoted by G0 and G00 [Fig. 1(c)]. We fit the experimental data with the function G∗ (ω) = G0 (1 + (iωτα )α ), where τα is a thermal relaxation time scale [24, 26, 27]. To experimentally quantify nonequilibrium dissipation, we must also measure the spontaneous motion of the vesicles by laser interferometry, and extract the power spectral density of the vesicles’ position [28], as is done for passive microrheology [29] [Fig. 1(d)]. These spontaneous fluctuations entangle information about the thermal and nonequilibrium forces applied on vesicles in the oocyte cytoskeleton [25]. Model.—We propose a model for the vesicle dynamics the surrounding fluctuating actin mesh that takes the observed power law behavior of G∗ into account. The
0.2
0.06 0.04 5
5.005 time (s)
5.01
0.1 0 −0.1 0
2
4 6 time (s)
8
10
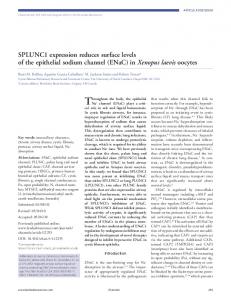
FIG. 1: (Color online) Experimental setup for measuring oocyte microrheology. (a) We embed oocytes in a collagen matrix between two glass coverslips to prevent rolling during measurement. (b) We use optical tweezers to trap intracellular vesicles and perform active microrheology to measure local mechanical properties [5]. (c) Real (G0 ) and imaginary (G00 ) part of the complex modulus, measured from active microrheology. Data at 10 Hz is used in [21]. (d) We use laser tracking interferometry to track spontaneous vesicle motion with high spatiotemporal resolution (10 nm, 1 kHz) [28].
model has itself been previously introduced in [30], but it is generalized here to encompass strong memory effects [31]. The underlying physical picture is that the vesicle is caged in the cytoskeleton [Fig. 1(b)], modeled as a harmonic trap of constant k , while nonequilibrium activity induces rearrangements of the cytoskeletal network resulting in a displacement of the cage. In a medium characterized by a memory kernel ζ , we then describe the one dimensional position x of a vesicle with two coupled generalized Langevin-like equations involving the center of the cage x0 : dx dx0 = −k(x − x0 ) + ξ , ζ ∗ = kτα vA , (1) dt dt where ∗ denotes the convolution product, ξ is a zero mean Gaussian colored noise with correlations hξ(t)ξ(t0 )i = kB T ζ(|t − t0 |) as provided by the FDT [32], and T is the bath temperature. The cage motion is given by the active burst vA : a zero mean stochastic process representing the random vesicle motion driven by cellular activity [21, 31]. In our further analysis, we consider that this process has a single timescale τ that governs its decorrelation: hvA (t)vA (0)i = kB TA e−|t|/τ /(kτα τ ), where, by analogy with standard Langevin equation, we have defined an active temperature TA associated to the amplitude of this process. Notice that TA is a scalar quantity which quantifies the amplitude of the active fluctuations. We choose the memory kernel ζ to recover the observed behavior of the
ζ∗
3 measured G∗ by adopting a power law decay ζ(t) = α k (τα /t) Θ(t)/Γ(1 − α), where Γ is the Gamma function, Θ is the Heaviside function, and α < 1. From the generalized Stokes-Einstein relation, we derive that h i ∗ ˜ G (ω) = k + iω ζ(ω) /(6πa) [33], where the superscript tilde denotes a Fourier transform [24]. This expression has exactly the same structure as the phenomenological function we use to fit G∗ with k = 6πaG0 . Note that our approach can be extended in a straightforward manner to other kinds of rheology. Effective temperature.—We define a frequency dependent “effective temperature” as Teff (ω) = 00 ˜ ˜ −ω C(ω)/ [2kB χ ˜ (ω)] [7, 8, 34], where C and χ ˜00 are the Fourier position autocorrelation function and the imaginary part of the response function, respectively. We compute this effective temperature in terms of the microscopic parameters [24] TA 1 � . (2) Teff (ω) = T + πα 3α−1 (ωτα ) sin 2 1 + (ωτ )2 The high frequency value collapses to the bath temperature as for an equilibrium behaviour and constitutes a useful benchmark [7]. It also diverges at low frequency as a result of nonequilibrium activity, with a coefficient depending on both the material properties {α, τα } and the active temperature TA . This interplay between mechanics and activity reflects the fact that the nonequilibrium processes operating in the system drive motion of the cytoskeletal cage, which in turn affects the vesicles’ dynamics. Dissipation spectrum.—A quantification of direct physical relevance is the work done by the vesicle on the thermostat [35] –this is the mechanical energy dissipation. It is proportional to the rate at which the vesicle exchanges energy with the surrounding environment [36]. The mean rate of energy dissipation thus reads Jdiss = hx(ζ ˙ ∗ x˙ − ξ)i, where x˙ = dx/dt is the vesicle’s velocity [35, 37]. It equals the balance between the mean power dissipated by the particle via the drag force ζ ∗ x˙ , and the power injected by the equilibrium thermal force ξ . These are equal in the absence of nonequilibrium drive, reflecting the fact that the vesicle releases and absorbs on average the same amount of energy from the thermostat. The dissipation rate is proportional to the mean rate of entropy production which characterizes the irreversibile properties of the dynamics [24]. The Harada-Sasa equality connects the spectral density I of mechanical energy dissipation to C˜ and χ ˜00 in a viscous fluid [13, 14]. In the case of a complex rheology, we express it as I = 2kB (Teff − T )/ [1 + (G0 /G00 )2 ] [24, 38]. This relation allows us to precisely identify the dissipation rate with the nonequilibrium properties of the vesicles’ dynamics, since I vanishes at equilibrium. Within our model, the dissipation spectrum is [24] � 1−α (ωτα ) sin πα 2kB TA 2 I(ω) = � α 2α 2 . πα 1 + 2 (ωτα ) cos 2 + (ωτα ) 1 + (ωτ ) (3)
There is no nonequilibrium dissipation when TA = 0 as expected, while in general it depends on both mechanics and activity as for Teff . By integrating the dissipation spectrum over the whole frequencyR range, we can deduce the total dissipation rate Jdiss = dωI(ω)/(2π). By contrast to Teff , the dissipation spectrum not only quantifies the deviation from equilibrium properties, it is also related to the energy injected by the nonequilibrium processes. Energy conversion.—In our theoretical framework, the nonequilibrium drive is embodied by the kx0 force applied on the vesicle. The dissipation rate precisely equals the mean power of this force, reflecting the fact that the mechanical energy dissipated by the vesicle is also the energy provided by the nonequilibrium processes driving the vesicle’s motion [24]. This motion results from the displacement of the confining cytoskeletal cage, which is due to the active reorganization of the local environment. We denote by Jenv the rate of energy injected by the nonequilibrium processes in the environment leading to the cytoskeleton rearrangement. In our model, it is given by the mean power injected by the force kτα vA to the cage: Jenv = hx˙ 0 kτα vA i, where x˙ 0 = dx0 /dt. This can be computed in terms of the microscopic parameters Jenv = kB TA /τ (τα /τ )1−α [24]. We define the average amount of energy provided by the nonequilibrium processes that is transmitted from the cytoskeletal cage to the vesicle as the power conversion rate ρ = Jdiss /Jenv , which is independent of TA . This ratio quantifies the proportion of energy injected by the nonequilibrium processes into the medium that is effectively dissipated through active motion of the vesicles. In that respect, it provides a new quantification of how efficiently this energy powers motion within the cytoplasm. We understand such energy transmission as the conversion of the active stirring of the cytoskeleton network into the active dynamics of the intracellular components. Quantification of the activity.—We exploit our theoretical predictions to quantify the experimental measurements of nonequilibrium dissipation inside living oocytes. We extract the data for the effective temperature and the dissipation spectrum from a combination of active and passive microrheology. We observe that the experimental effective temperature diverges at low frequency, as a clear evidence that nonequilibrium processes drive the intracellular dynamics in this regime [Fig. 2(a)]. It reaches the equilibrium plateau at high frequency as expected. Deviation from thermal equilibrium was already reported in other living systems [6, 9, 31]. We use our analytic prediction in Eq. (3) to fit the dissipation spectrum data. As we have already quantified the viscoelastic properties, the remaining two free parameters are the ones characterizing the properties of the nonequilibrium processes, namely the active temperature TA , and the mean persistence time τ . Our best fit is in very good agreement with the measured dissipation spectrum [Fig. 2(b)]. The extracted value of the active temperature TA = (6.2 ± 0.5)T is larger than the bath temperature T . By
4 14 10
(a)
8
I/(kB T )
Teff /T
(b)
Exp. data Prediction
12
6 4 2 0
1
0.1
τ = (0.34 ± 0.04) ms
Thermal 100
TA = (6.2 ± 0.5)T
101
102
103
100
(c)
Nuc
Mid
Cor
101
102
103
Frequency (Hz) 6
2
(d)
ρ (10−3 )
12 10 8 6 4 2 0
Jdiss /kB T (102 Hz)
TA /T
Frequency (Hz)
4 2 0
Nuc
Mid
Cor
(e) 1
0
Nuc
Mid
Cor
FIG. 2: (Color online) (a) Effective temperature Teff and (b) dissipation spectrum I as functions of frequency (◦), and their best fitting curves from Eqs. (2) and (3), respectively (solid lines). The horizontal dashed line in (a) is the prediction for a thermal equilibrium system in the absence of activity, for which the dissipation spectrum equals zero. The deviation of Teff from this prediction at low frequency is the hallmark of nonequilibrium activity. The experimental data is averaged over the whole oocyte. (c) Active temperature, (d) dissipation rate, and (c) power conversion rate estimated from the best fits of Teff and I at three locations within the cytoplasm: near the nucleus (Nuc), near the cortex (Cor), and in the region in between (Mid).
contrast to Teff , the active temperature is frequency independent, and it quantifies the amplitude of the active fluctuations. Hence, our estimation reveals that the fluctuations due to the nonequilibrium rearrangement of the cytoskeleton have a larger amplitude than the equilibrium thermal fluctuations dominating the short time dynamics. The time scale τ = (0.34±0.04) ms that we obtain is of the order of the power stroke time of a single myosin-V motor [39, 40]. This teaches us that the nonequilibrium processes driving the vesicle dynamics are related to the microscopic kinetics of the molecular motors. It is consistent with the fact that nonequilibrium processes are dominant at a higher frequency in our system than in others which were mainly driven by myosin-II [5, 6], for which the power stroke time is about 0.1 s [41]. We compare our analytic prediction for Teff in Eq. (2), for which we use the parameter values {α, τα , TA , τ } extracted from the previous fits, with the experimental data [Fig. 2(a)]. The perfect agreement corroborates the consistency of our model, showing that the extracted active parameters are indeed relevant to characterize the nonequilibrium processes. From the best fit parameters, we directly estimate the dissipation rate Jdiss = (360 ± 110) kB T /s, as well as the power conversion rate ρ = (1.7 ± 0.8)10−3 . We find that the conversion of energy from the cytoskeletal network to the vesicle is very low. This suggests that a major propor-
tion of the nonequilibrium injected power is dedicated to the network rearrangement, and not necessarily to vesicle dynamics per se. In other words, the injected energy tends to go mostly into elastic stresses, and only a small fraction ends up in kinetic energy [42]. It has been reported that a single myosin-V motor does about 3 kB T of work during one power stroke [43], from which we deduce that it dissipates approximately 104 kB T /s into the intracellular environment. This result is to be compared with our estimation of Jenv = (2.0 ± 0.5)105 kB T /s. We infer that the power injected by the nonequilibrium processes into the environment represents approximately the activity provided by 20 myosinV motors. Assuming that the nonequilibrium processes in oocytes are indeed mainly regulated by myosin-V activity, we infer that 20 is the typical number of motors involved in the nonequilibrium reorganization of the cytoskeletal cage in the vicinity of a vesicle. Variability across the oocyte.—One of the main advantages of our energetic approach lies in the ability to compare the same physical quantities across a large variety of living systems, or in different locations of the same system. We consider three concentric shells within the oocyte cytoplasm located near the nucleus, near the cortex, and in between these two regions. Each shell has a radial extension of about 10 µm. We use our analysis to quantify TA , Jdiss , and ρ in the three regions [24]. Our results hint that nonequilibrium activity is increased near the middle of the cell, and slightly decreased near the nucleus, as quantified by TA and Jdiss [Figs. 2(c-d)]. This suggests that living oocytes locally regulate the nonequilibrium activity throughout their cytoplasm by injecting different amounts of energy. Note that the relative variation of J and TA are similar, showing the close relation between these quantities as highlighted in Eq. (3). In comparison, the variation of ρ does not exhibit a clear trend across the oocyte [Fig. 2(e)]. Conclusion.—We quantified the amount of mechanical energy dissipated by the intracellular dynamics. Our analysis utilizes a minimal model describing the effect of the nonequilibrium stochastic forces in living systems with complex rheology. On the basis of recent advances in stochastic thermodynamics, we are able to extract the spectrum of energy dissipation in living mouse oocytes. We find the predictions of our model to be in excellent agreement with the experimental results, thus allowing us to quantify the main properties of the nonequilibrium dynamics: the amplitude and typical time scale of active fluctuations, the amount of dissipated energy, and the rate of energy transmitted from the cytoskeletal network to the intracellular components. The extracted parameters provide a quantitative support to the experimental picture that the nonequilibrium processes are mainly driven by myosin-V activity [19–21, 31]. The use of general principles in stochastic energetics, together with a minimal microscopic model, makes the results of our study highly relevant to a large variety of active processes in biology and soft matter.
5 We warmly thank Gavin Crooks for a critical reading of the manuscript and FvW acknowledges the support of the UC Berkeley Pitzer Center for Theoretical Chemistry. WWA thanks the PGG Fondation and Marie Curie Actions.
∗
These authors contributed equally to this work [1] J. Perrin, Comptes rendus hebdomadaires des séances de l’académie des sciences 147, 530 (1908). [2] P. Langevin, Comptes Rendus de l’Académie des ciences 146, 530 (1908). [3] K. Sekimoto, Stochastic Energetics, Lecture Notes in Physics (Springer, Berlin, Heidelberg, 2010). [4] U. Seifert, Reports on Progress in Physics 75, 126001 (2012). [5] D. Mizuno, C. Tardin, C. F. Schmidt, and F. C. MacKintosh, Science 315, 370 (2007). [6] F. Gallet, D. Arcizet, P. Bohec, and A. Richert, Soft Matter 5, 2947 (2009). [7] E. Ben-Isaac, Y. K. Park, G. Popescu, F. L. H. Brown, N. S. Gov, and Y. Shokef, Phys. Rev. Lett. 106, 238103 (2011). [8] J. Prost, J.-F. Joanny, and J. M. R. Parrondo, Phys. Rev. Lett. 103, 090601 (2009). [9] T. Betz, M. Lenz, J.-F. Joanny, and C. Sykes, PNAS 106, 15320 (2009). [10] S. Tusch, A. Kundu, G. Verley, T. Blondel, V. Miralles, D. Démoulin, D. Lacoste, and J. Baudry, Phys. Rev. Lett. 112, 180604 (2014). [11] S. Muy, A. Kundu, and D. Lacoste, The Journal of Chemical Physics 139 (2013), 10.1063/1.4821760. [12] S. Shinkai and Y. Togashi, EPL 105, 30002 (2014). [13] T. Harada and S.-i. Sasa, Phys. Rev. Lett. 95, 130602 (2005). [14] T. Harada and S.-i. Sasa, Phys. Rev. E 73, 026131 (2006). [15] S. Toyabe, H.-R. Jiang, T. Nakamura, Y. Murayama, and M. Sano, Phys. Rev. E 75, 011122 (2007). [16] B. Lander, J. Mehl, V. Blickle, C. Bechinger, and U. Seifert, Phys. Rev. E 86, 030401 (2012). [17] J. M. Deutsch and O. Narayan, Phys. Rev. E 74, 026112 (2006). [18] S. Toyabe, T. Okamoto, T. Watanabe-Nakayama, H. Taketani, S. Kudo, and E. Muneyuki, Phys. Rev. Lett. 104, 198103 (2010). [19] Z. Holubcová, G. Howard, and M. Schuh, Nature cell biology 15, 937 (2013). [20] M. Schuh, Nature cell biology 13, 1431 (2011).
[21] M. Almonacid, W. W. Ahmed, M. Bussonnier, P. Mailly, T. Betz, R. Voituriez, N. S. Gov, and M.-H. Verlhac, Nat Cell Biol 17, 470 (2015). [22] M. Łuksza, I. Queguigner, M.-H. Verlhac, and S. Brunet, Developmental Biology 382, 48 (2013). [23] M.-H. Verlhac, J. Z. Kubiak, H. J. Clarke, and B. Maro, Development 120, 1017 (1994). [24] See supplemental material. [25] W. W. Ahmed, É. Fodor, and T. Betz, BBA - Molecular Cell Research 1853, 3083 (2015). [26] T. G. Mason, Rheol. Acta 39, 371 (2000). [27] D. Wirtz, Annual Review of Biophysics 38, 301 (2009). [28] F. Gittes and C. Schmidt, Optics Letters 23, 7 (1998). [29] D. Mizuno, D. A. Head, F. MacKintosh, and C. Schmidt, Macromolecules 41, 7194 (2008). [30] É. Fodor, M. Guo, N. S. Gov, P. Visco, D. A. Weitz, and F. van Wijland, EPL 110, 48005 (2015). [31] W. W. Ahmed, E. Fodor, M. Almonacid, M. Bussonnier, M.-H. Verlhac, N. S. Gov, P. Visco, F. van Wijland, and T. Betz, ArXiv e-prints (2015), arXiv:1510.08299 . [32] R. Kubo, Reports on Progress in Physics 29, 255 (1966). [33] T. G. Mason and D. A. Weitz, Phys. Rev. Lett. 74, 1250 (1995). [34] L. F. Cugliandolo, J. Kurchan, and G. Parisi, J. Phys. I France 4, 1641 (1994). [35] K. Sekimoto, Journal of the Physical Society of Japan 66, 1234 (1997). [36] C. Bustamante, J. Liphardt, and F. Ritort, Physics Today 58 (205), 10.1063/1.2012462. [37] K. Sekimoto and S.-i. Sasa, J. Phys. Soc. Jpn. 66, 3326 (1997). [38] É. Fodor, K. Kanazawa, H. Hayakawa, P. Visco, and F. van Wijland, Phys. Rev. E 90, 042724 (2014). [39] G. Cappello, P. Pierobon, C. Symonds, L. Busoni, J. Christof, M. Gebhardt, M. Rief, and J. Prost, Proc. Natl. Acad. Sci. U.S.A. 104, 15328 (2007). [40] W. W. Ahmed, É. Fodor, M. Almonacid, M. Bussonnier, M.H. Verlhac, N. S. Gov, P. Visco, F. van Wijland, and T. betz, under review . [41] M. J. Tyska and D. M. Warshaw, Cell Motility and the Cytoskeleton 51, 1 (2002). [42] E. Ben-Isaac, É. Fodor, P. Visco, F. van Wijland, and N. S. Gov, Phys. Rev. E 92, 012716 (2015). [43] K. Fujita, M. Iwaki, A. H. Iwane, L. Marcucci, and T. Yanagida, Nature Communications 3 (2012), 10.1038/ncomms1934.