Tsang and Tsang (1978) developed a semi-analytic solution for pressure transients during cold water injection tests. O'Sullivan and Pruess (1980) and Garg.
Proceedings Ninth Workshop Geothermal Reservoir Engineering Stanford University, Stanford, California, December 1983 SCP-TR-74
NONISOTHERMAL INJECTIVITY INDEX CAN INFER WELL PRODUCTIVITY AND RESERVOIR TRANSMISSIVITY
Omar Sigurdsson, Gudmundur S. Bodvarsson' and Valgardur Stefansson
Orkustofnun, Grensasvegur 9, 108 Reykjavik, Iceland. ABSTRACT In geothermal wells injection tests are commonly used to obtain well and reservoir data. These tests are typically conducted in a'series of step rates followed or preceded by a complete shutin. Usually the temperature of the injected fluid is different from that of the reservoir fluid. Because of the strong temperature dependence of fluid viscosity and to a lesser extent, fluid density, nonisothermally related pressure responses must be considered. The nonisothermal injectivity index obtained from these tests depends on the mobility ratio of the cold region to the hot reservoir and the extent of the cold spot. This paper proposes a method of estimation of the apparent viscosity which accounts for these effects and relates the nonisothermal injectivity index to the isothermal injectivity index.
reservoirs and illustrated t.he effect of the temperature dependent fluid properties, viscosity and density. Tsang and Tsang (1978) developed a semi-analytic solution for pressure transients during cold water injection tests. O'Sullivan and Pruess (1980) and Garg (1980) discussed the analysis of injection and falloff tests in two-phase geothermal reservoirs. These studies demonstrated that the pressure transients during injection tests can be used to determine the transmissivity of the reservoir. In recent studies by Benson and Bodvarsson (1982) and Benson (1982) methods for calculating the skin factor and reservoir properties from nonisothermal injection tests were developed and the conditions in which the pressure transients behaved like a composite reservoir or moving front dominated problem for both single- and step-rate tests discussed. In the present study their work is extended by relating the nonisothermal injectivity to the reservoir transmissivity.
INTRODUCTION FORMULATION OF THE PROBLEM In geothermal wells injection tests are commonly used to obtain well and reservoir data. The temperature of the injected fluid is invariably different from the temperature of the in situ reservoir fluid. Since fluid mobility, k/p, plays the major role in pressure transient behavior, the s t r o n g temperature dependence of fluid viscosity and to a lesser extent, fluid density, has a large impact on the test. The dynamic viscosity of water changes by an order of magnitude between 20 'C and 300 'C, the major changes ocurring between 20 'C and 100 'C. However, the decrease in fluid density from 20 'C to 300 'C is approximately 30%. To interpret such tests the nonisothermally related pressure transient must be considered.
Injection of cold water is frequently used as a testing procedure for geothermal wells, as for example in completion tests at the end of drilling. Injection tests are typically conducted in a series of step rates followed or preceded by a complete shutin. Since the duration of each step is seldom very long, usually few hours, stabilized time is mually not reached. The observed pressure is therefore transient and the injectivity so obtained only an approximation. Now consider the system illustrated in Figure 1. It is that of a single well at the axis of a radial system of two concentric regions which can have different properties. Defining nondimensional time, radius and pressure as:
Several authors have discussed the interpretation of pressure transients during cold water injection into hot reservoirs. In particular, Bodvarsson and Tsang (1980) and Mangold et. al. (1981) considered the behavior of nonisothermal pressure transients in geothermal
k. t
. (1) ... ( 2 )
+ Lawrence Berkeley Laboratory, Berkeley, California __-________--_______--_------_____-----------
References and illustrations at end of paper.
-211-
written as: 2
-
PD1 = 1 { - Ei(2
rD + Ei(-
-)
4tDR
4tDR
)
'61 Ei(-
1 )I
-
1
....(14)
4YtDR Then the flow equations in the two regions are:
For a large time this may be approximated as: 1
-a2pD1 +-=-
a ri
aPDl
aPDl
rD arD
atDR
.... ( 5 )
-
'q 1 R 2 + 4nk hp I l n ( r )
P 1 = Pi
apD2
-
apD2
(15)
4YtDR
In real space Eq. 15 becomes:
and
-a2pD2 +--
1 1.781 +3 ln(-)}
2
InkD)
PD1 = 2
+
1
. .. .(6)
where
* . . . (7)
For an isothermal homogeneous geothermal system the pressure at the well during injection can be written as:
Initial conditions are P 1 and P2 are Pi everywhere so: PDl(rD,O)
=
D2 (rD , O ) = 0
P
....(8)
There are three boundary conditions to consider; the inner boundary, the discontinuity and the outer boundary. At the inner boundary the condition is: lim r -aPDl = D ar, rD-@
,
P
wf
=
P . + Bq 1
where C is a constant governed by the pore structure of the porous medium, the radius and the condition of the well. The quadratic flow rate term accounts for the non-Darcy's flow effects. Assuming these effects to be negligible for the purpose of this study, the injectivity index can be expressed as:
.... (9)
1
1
=
'wf At the discontinuity, the flux and pressure must be continuous so: 'D1
-aPDl -
ar D
... . (10)
= 'D2
-6-
apD2
.... (17)
+ Cq2
4
- i'
.... (18)
= B 1
Because of the relatively short duration of each injection step in the test, the pressure at the well is considered to be transient. Then B can be approximated as:
.. ..(11)
arD
where
. ... (12)
For homogeneous rock properties and single phase condition, Eqs. 16 and 17 along with Eq. 19 yield:
Here, only the infinite outer boundary case is considered. Then the outer boundary condition is: 2'1'
( -
.... (13) RESULTS Following the procedure of Horne et. al. (1980) the long time solution fcr PD1 can be
)
2.246kt
11
... (20)
PZP 1
Eq. 20 is a root solving problem to find the apparent viscosity which will represent the nonisothermal effect in a conventional manner. Figures 2 - 4 show how this apparent viscosity is related to the position of the thermal front
-212-
and the duration of the injection steps for the properties listed in table I. Thus the nonisothermal injectivity index is for engineering purposes approximately related to the isothermal injectivity index as:
'IISOTH
" ( -
!'a", pap2
)
'INONISOTH
(21)
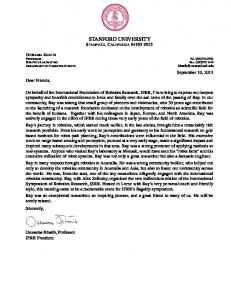
DISCUSSION Figure 5 has been constructed using the data in table I and the apparent viscosity relative to the cooled radius. It shows the transmissivity of the hot reservoir as a function of the injectivity depending on the size of the cooled radius. Figure 5 could equally well have been constructed from a rearrangement of Eq. 16. Figure 5 shows that when the nonisothermal injectivity and the size of the cooled zone are known ( see Benson, 1982 ) , the transmissivity of the reservoir can be determined. If the transmissivity and the nonisothermal injectivity are known, the size of the cold spot can be estimated. It is also possible to project the well productivity as its temperature recovers from the injection and the cold zone diminishes. Here it is assumed that the reservoir transmissivity does not change between injection and production. However, as Grant (1982) has pointed out, the injection transmissivity is in many instances observed to be several times greater than that for production. This might be due to an increase in permeability with injection either because of hydraulic fracturing or thermal contraction of rock and opening of fissures. It has been pointed out (Benson and Bodvarsson 1982, Benson 1982) that the presence of a cooled zone around the well acts as an apparent positive skin. Hence, the presence of a positive skin will shift the curves on Figure 5 up and to the left while the presence of a negative skin will shift them down and to the right. Of particullar interest is the effect of fractures, since transmissivity or injectivitj is usually dominated by natural fractures in geothermal. systems. The presence of fractures will contribute to a negative skin, but the extent of a cooled zone is much greater at the . fracture feed points than.in the rock matrix. How these effects counteract each other is not fully known, but numerical studies indicate that the heat transfer from rock matrix to fissures significantly changes the radius of the zone occupied by the cold injection fluid (Bodvarsson and Tsang 1982). EXAMPLES simulated nonisothermal step rate injection test was run on the numerical simulator, PT (Pressure - Temperature) (Bodvarsson 1981).
A
The test consisted of three six-hour steps with injection rates of 0.10, 0.15 and 0.20 kg/s/m of 20 'C fluid into a 300 'C reservoir followed by a complete shutin. The reservoir properties used for the simulation are given in table I. The reservoir is a liquid saturated homogeneous porous medium. No cold spot exists around the well prior to injection. The observed injectivity at the end of each step is shown in Figure 6, which is similar to Figure 5. Since the transmissivity of the hot reservoir is constant during the test, one can see that the decrease in injectivity is a result of an increasing cold spot around the well. The size of the cold spot as determined by the transmissivity and the injectivity for each step is in good agreement with the location of the thermal front according to the simulator which is shown in Figure 6. Assuming that the isothermal injectivity is identical to the well productivity, the production index can be estimated by extrapolation,using Figure 6, as the well warms up. The transmissivity and the injectivity index for a few of the wells in the Krafla geothermal field are plotted in Figure 7. The Krafla geothermal reservoir is fracture dominated so an average skin factor of s = -5 is assumed for the field. Following the methodology developed by Benson and Bodvarsson 1982, and Benson 1982, the size of the cold spot around the wells due to drilling and injection testing is estimated to be 2 to 3 m on the average. However, since the reservoir is fracture dominated, the distance to the thermal front can be considerably greater in the fractures or around the feed points in the wells. On the other hand the distance to the thermal front in the nearly impermeable rock matrix, between the feed points in the wells, can be of the order of a few cm and is controled by the thermal conduction of the rock matrix. The size of the cold spot as obtained from Figure 7 when the data is plotted according to the methodology of this paper is therefore some weighted average of these two distances. It seams therefore that the existence of a cold spot around the feed points in a well in a hot fractured reservoir has very litle effect on the relationship between transmissivity and injectivity. Other factors such as the skin effect are problably dominating the effect of the cold invasion zone in fracture dominated reservoirs. CONCLUSIONS Through theoretical considerations an apparent viscosity has been established which relates the nonisothermal injectivity index, obtained from nonisothermal step rate tests, to the isothermal injectivity index. Thus it is possible to use the nonisothermal injectivity index to estimate the reservoir transmissivity and infer the well productivity.
-213-
NOMENCLATURE
3.
Bodvarsson, G. S . and Tsang, C. F.: "Thermal Effects in the Analysis of Fractured Reservoirs," 3rd Invitational Well Testing Symposium, Lawrence Berkeley Laboratory Report, LBL-12076, Berkeley, California (March 1980).
4.
Bodvarsson, G. S . : "Mathematical Modelling of the Behavior of Geothermal Systems Under Exploitation," Ph. D. dissertation, University of California, Berkeley, 1981.
5.
Bodvarsson, G. S . and Tsang, C. F.: "Injection and Thermal Breakthrough in Fractured Geothermal Reservoirs," J. Geophys. Res., v. 87, No 82 (Feb. 1982) 1031-1048.
ct = total system compressibility, Pa-' Cr = specific heat capacity, J/kg'C h
= thickness, m
11 = injectivity index, kg/sPa k
= permeability, mL
P
= pressure, Pa mass flow rate, kg/s
q
r
= radius, m
R
= radius of cold spot, m
t = time, T
s
'c
= temperature,
dynamic viscosity, Pa
p
s
6. Garg, S. K.:
"Pressure Transient Analysis for Two-Phase (Water/Steam) Geothermal Reservoirs," SOC. Pet. Eng. J. (June 1980) 206-214.
3
p
= density, kg/m
@
= porosity
A
= thermal conductivity, W/m'C
7. Subscripts a
= apparent
c
= cold
D
=
i
= initial
dimensionless 8. Horne, R. N., Satman, A. and Grant, M. A.: "Pressure Transient Analysis of Geothermal Wells with Phase Boundaries," paper SPE 9274 presented at the SPE 55th Annual Fall Technical Conference and Exhibition, Dallas, Texas (1980).
inj = injection r
= rock
w
= well
wf = well flowing 1
Grant, M. A.: "The Measurement of Permeability by Injection Tests," Proceedings 8th Workshop on Geothermal Reservoir Engineering, Stanford University, Stanford, California (Dec. 1982).
9. Mangold, D. C., Tsang, C. F., Lippmann, M. J. and Witherspoon, P. A.: "A Study of Thermal Discontinuitv in Well Test Analysis," J. Pet. Tech. (June 1981) 1095-1105.
= inner (cold) region
2 = outer (hot) region ACKNOWLEDGMENTS
I
We thank Rafmagnsveitur Rikisins, Krofluvirkjun for permission to use data from the Krafla geothermal field.
10. 0 Sullivan, M. J. and Pruess, K.:
"Analysis of Injection Testing of Geothermal Reservoirs," Geothermal Resources Concil Transactions, vol. 4 (1980)
.
RETSRENCES 1.
Benson, S. M. and Bodvarsson, G. S.: "Non-isothermal Effects During Injection and Falloff Tests," paper SPE 11137, presented at the SPE 57th Annual Fall Technical Conference and Exhibition, New Orleans, Louisiana, 1982.
2.
Benson, S . : "Interpretation of Nonisothermal Step-Rate Injection Tests," Proceedings 8th Workshop on Geothermal Reservoir Engineering, Stanford University, Stanford, California (Dec. 1982).
11.
-214-
Tsang, Y. W. and Tsang, C. F.: "An Analytic Study of Geothermal Reservoir Pressure Response to Cold Water Reinjection," Proceedings 4th Workshop on Geothermal Reservoir Engineerinq, Stanford University, Stanford, California (Dec. 1978).
Table I. Reservoir Properties
CASE
Permeability, kr
1.0-10-l~m2
Thickness, h
1.0 m
Porosity, 4
0.20
Specific heat capacity, r' Density, Pr Thermal conductivity, 1
1000.0 J/kg'C
20°C
INTO 1 0 0 ° C
IO
R Z I O O ~ R : 7 0 m R = 5 0 m
3
2200.0 kg/m
2.0 W/m'C -9 -1 Total system compressibility,c t 1.0.10 Pa Wellbore radius, rw 0.10 m
T P
R : 3 0 m R : 2 0 m
0 X
Figure
2.
R -
1 0 m
R ;
O 5 m
Apparent viscosity as a function of the duration of the injection steps and the size of the cold spot for injection of 20 'c water into 100 'C reservoir.
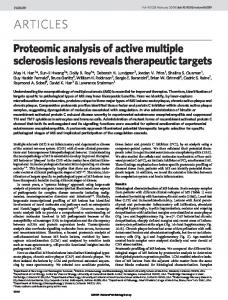
C A S E 2 0 ° C INTO 2 0 0 ° C
Figure 1.
Schematic picture of the reservoir system before and after nonisothermal injection
2R = O Irn
0 --
Figure 3 .
-215-
- .- 7 2
7
3
-I 1 r l 4 5 6 78910
Apparent viscosity as a function of the duration of the injection steps and the size of the cold spot for injection of 20 'C water into 200 'C reservoir.
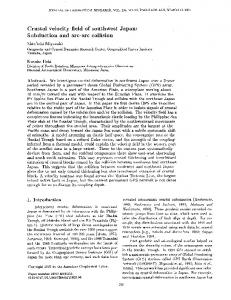
C A S E 2 O o C I N T O 3OO0C
R=100m R=70m R=50m
f
R= 30m R=20rn R-[Om
R=O 5 m
>
R = 0.1 m
i2
I
!
1
3
4
5
I
I
l
I
l
*
€ 7 8 9 1 0
Figure 6. The relationship between transmissivity and injectivity for the simulated example.
Figure 4. Apparent viscosity as a function of the duration of the injection steps and the size of the cold spot for injection of 20 ‘C water into 300 ‘C reservoir.
Figure 7 .
Figure 5.
Transmissivity as a function of the injectivity and the size of the cold spot.
-216-
The relationship between transmissivity and injectivity for a few of the wells in the Krafla geothermal field.