NONLINEAR DYNAMICS METHODS FOR ASSESSING HEART RATE VARIABILITY IN PATIENTS WITH RECENT MYOCARDIAL INFARCTION Ş.-C. MIRESCU*,**, S.W. HARDEN*** *Faculty of Biology and Geology, “Babeş-Bolyai” University, 5–7, Clinicilor Street, Cluj-Napoca,
[email protected] **Faculty of Medicine, “Iuliu Haţieganu” University of Medicine and Pharmacy, Cluj-Napoca ***Biomolecular Science Center, Burnett School of Biomedical Sciences, College of Medicine, University of Central Florida, Orlando, Florida, USA
Abstract. Heart rate variability (HRV) is defined by the fluctuating time between normal sinus beats (RR intervals) and indicates modulation of the heart rate by the autonomic nervous system. Decreased variability parameters have been studied as markers of increased pathology and a predictor of morbidity and mortality in multiple medical disciplines. The aim of the study was to assess HRV by nonlinear dynamics parameters (Poincaré plot and entropy constants) in patients with recent myocardial infarction (MI). We analyzed two groups of patients: a test group of 12 patients with recent myocardial infarction and a control group of 12 healthy subjects. For each patient, a 7 minutes ECG signal was recorded and the nonlinear dynamics parameters were calculated. Strong visual differences were found between Poincaré plots of healthy subjects and MI patients. Also, most calculated nonlinear dynamics parameters were significantly lower in MI patients. In conclusion, MI affects nonlinear dynamics parameters, revealing a statistically significant decrease in HRV. Also, visual modifications of the Poincaré plot were found. Key words: heart rate variability, nonlinear dynamics methods, Poincaré plot, recent myocardial infarction.
INTRODUCTION
Heart rate variability (HRV) is a temporal variation between sequences of consecutive heart beats. On a standard electrocardiogram (ECG), the maximum upwards deflection of a normal QRS complex is at the peak of the R-wave, and the duration between two adjacent R-wave peaks is termed as the R-R interval. The signal requires editing before HRV analysis can be performed. The signal needs filtering (artifacts can be present) and removal of all non sinus-node originating beats. The period between adjacent QRS complexes resulting from sinus node _______________________ Received: August 2012; in final form August 2012. ROMANIAN J. BIOPHYS., Vol. 22, No. 2, P. 117–124, BUCHAREST, 2012
118
Ş.-C. Mirescu, S.W. Harden
2
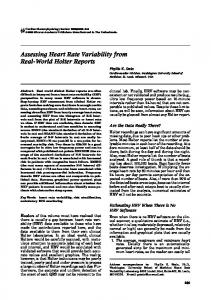
depolarizations is termed the N-N (normal-normal) interval. HRV is the measurement of the variability of the N-N interval [4]. In recent years special attention has been given to the analysis of HRV and its relation to pathology. Methods for quantifying HRV are categorized as: timedomain, spectral or frequency domain and nonlinear dynamics methods: 1. In time domain analysis, the intervals between adjacent R waves are measured over a period of recordings and a variety of statistical parameters can be calculated from these intervals. The visual result is a tachogram, which plots the heart rate frequency over time [11]; 2. The heart rate spectrum analysis is used to evaluate the contribution of the autonomic nervous system to HRV; it is a sensitive and not invasive method for evaluating the cardiovascular control system [2]; 3. Nonlinear methods are based on the chaos theory and fractals. Chaos describes natural systems in a different way because it can account for nature’s randomness and nonperiodicity. Recent data suggest that fractal analysis in comparison to standard HRV measurements seems to detect abnormal patterns of RR fluctuations efficiently [10]. The Poincaré plot is a scattergram, which is constructed by plotting each RR interval against the previous one. The Poincaré plot may be analyzed quantitatively by fitting an ellipse to the plotted shape. The center of the ellipse is determined by the average RR interval [5]. SD1 means the standard deviation of Poincaré plot perpendicular to the line-of-identity, while SD2 represents the standard deviation of the Poincaré plot along the line-of-identity (Fig. 1).
Fig. 1. The Poincaré plot. SD1 and SD2 – standard deviations of the scattergram.
3
Heart rate variability in myocardial infarction
119
HEART RATE CONTROL AND THE ORIGIN OF HEART RATE VARIABILITY
The normal rhythm of the heart is controlled by the membrane processes of the cardiac sinoatrial (SA) node, which are modulated by innervation from both the sympathetic and parasympathetic divisions of the autonomic nervous system. Acetylcholine, released by postganglionic parasympathetic terminals on the SA node, slows the rate of depolarization and discharge by binding to muscarinic cholinergic receptors. Thus, heart rate decreases consecutive to parasympathetic impulses. In contrast, norepinephrine is released by sympathetic terminals on the SA node and accelerates the cardiac rhythm. In addition to these classic neurotransmitter actions, the chronotropic state of the heart can be modulated by a variety of neuropeptides, such as neuropeptide Y, that appear to be colocalized with conventional neurotransmitters in autonomic terminals [1]. CLINICAL USES OF HRV
Heart rate variability has been used in different clinical settings, including diabetes [8], coronary artery disease [6], sudden cardiac death [3], chronic renal failure [7] and for the screening of patients with obstructive sleep apnea [9]. Modern Holter devices incorporate HRV analysis software, but it is scarcely used in clinical practice. Many studies have been performed on the HRV parameters in cardiac diseases. The novelty of this study consists in the analysis of the entropy parameters, as part of the nonlinear methods of assessing HRV. PURPOSE
The purposes of the study were: 1. to reveal a geometric pattern of HRV in patients with recent MI; 2. to compare the HRV nonlinear dynamics parameters of patients with recent MI, with the parameters of healthy, control subjects. MATERIALS AND METHODS PATIENTS
The study was performed on 12 patients who suffered a MI with at most 24 hours before examination (age 61±9 years, 7 males and 5 females). All patients were treated by percutaneous transluminal coronary angioplasty (PTCA), with one
120
Ş.-C. Mirescu, S.W. Harden
4
or more stents mounted in the affected arteries. Each patient signed an inform consent form and approval was obtained from the ethical committee of the “BabeşBolyai” University. Classical 12-lead ECG was performed, to eliminate arrhythmia or ectopic beats suspicion. The control group consisted of 10 healthy volunteers (age 33±16 years, 4 males and 6 females), with no history of chronic heart disease, diabetes or other neuropathic disorders. Brief heart examination (ECG and auscultatory) was performed for each subject. ECG RECORDINGS AND SIGNAL PROCESSING
For each patient, a three lead ECG signal was recorded (in D1 derivation), for a duration of 7 minutes (of personal manufacturing). The analog signal was filtered for artifacts and electrical noise and stored on a hard disk database, along with the patients’ personal and pathological data. The ECG recording device was conceived around an operational amplifier integrated circuit, with specific calculated gain and filter properties. For digital conversion, the sound card of a computer was used. The software used for ECG recording and beat identification was written in Python programming language. The graphical interface of the script allows visual verification of the signal and identification of the ectopic beats (Fig. 2). HRV parameters were calculated using the free software Kubios HRV Analysis.
Fig. 2. ECG recorded with the device: left – normal ECG; right – patient with ectopic beats. The dot above each R wave signifies automatic identification of a beat.
The intervals between successive R waves (beat-to-beat intervals) are stored in a text file, which is used as input data for Kubios HRV analysis. The software generates the mathematical values of the nonlinear HRV parameters and the corresponding plots (Table 1).
5
Heart rate variability in myocardial infarction
121
Table 1 Heart rate variability parameters Generic heart rate parameters Average heart rate Standard deviation of heart rate Poincaré plot parameters Standard deviation 1 (SD1) Standard deviation 2 (SD2) Entropy parameters Approximate entropy Sample entropy Detrended fluctuations alpha 1 (α1) Detrended fluctuations alpha 2 (α2) Correlation dimension (CD)
General information on heart rate A basic descriptor of HRV Short term variability Long term variability Denote irregularity of the signal Measure the correlation within the signal Measures the complexity or strangeness of the signal
Statistical processing was accomplished using Microsoft Excel and GraphPad. Student t-test was applied for comparing the two sets of parameters (p value lower than 0.05 was considered statistically significant, with a confidence interval of 95%). RESULTS GENERAL HEART RATE PARAMETERS
Patients with MI displayed a lower average heart rate than healthy subjects (p < 0.005). This might be due to the beta-blocker therapy each patient had in his therapeutic plan. Also, a decreased standard deviation of the heart rate was found in MI patients. This exhibits a lower capacity of the heart to respond to vegetative stimuli, consecutive to the disease and/or beta-blocker therapy (Fig. 3).
Fig. 3. The tachogram of the RR intervals, along 5 minutes of recording (up – healthy subject; down – MI patient).
Ş.-C. Mirescu, S.W. Harden
122
6
POINCARÉ PLOT ANALYSIS
Typical Poincaré scatter plots of healthy controls exhibit a greater dispersion than that of the MI patients. The fitting ellipses have larger areas in healthy subjects, but statistically significant differences have been found only in the long term variability – SD2 (p < 0.05). The lower heart rate in patients with MI can be also observed from the up shifting of the center of the adjusted ellipse (Fig. 4.b).
Fig. 4. Poincaré plots of normal (left) and MI (right) subjects.
Parameters of general heart rate analysis and Poincaré plot are summarized in Table 2. Table 2 General heart rate and Poincaré plot parameters HRV parameter
Control
MI*
P
Standard deviation of heart rate (per min)
83±7 5±1,5
70±8 2,25±2,9
0,002 0,001
SD1 (ms)
19±4
15±7
0,2
SD2 (ms)
64±14
44±13
0,009
Average heart rate (per minute)
*MI – Myocardial infarction patients ENTROPY PARAMETERS ANALYSIS
From the entropy parameters, only the α1 and CD exhibited significant differences in MI patients, compared to the ones obtained from normal subjects (Table 3). α2 was greater in patients with MI. Further studies will be conducted in order to find out if these values are specific for MI.
7
Heart rate variability in myocardial infarction
123
Table 3 Entropy parameters values (non-dimensional values) HRV parameter
Control
MI*
P
Approximate entropy
1.11±0.14
1.06±0.31
0.71
Sample entropy
1.26±0.27
1.5±0.39
0.16
α1
1.31±0.16
1.22±0.14
0.25
α2
0.82±0.13
1.07±0.16
0.003
Correlation dimension
2.56±1.05
0.91±0.58
0.001
*MI – Myocardial infarction patients
CONCLUSIONS
The analysis of the indices provided by both geometrical and mathematical methods showed that HRV was generally decreased in patients with MI. Apart from the acute heart condition, this decrease could also be attributed to the beta blocker therapy. As a visual method, the Poincaré plot proved to be a simple and sensitive instrument of HRV evaluation of patients with MI, compared to healthy subjects. Mathematical parameters of the Poincaré plot also describe a lower dispersion in MI patients. Despite expectations, one of the entropy parameters (the alpha 2 – detrended fluctuations) was significantly increased in MI patients, compared to the normal subjects. Further studies will be conducted in order to see if this increase is specific for MI or is generally met in acute heart conditions. This pilot-study shows how HRV analysis can be added to the cardiological examination of patients with MI, using simple instruments like an ECG amplifier, an analog-to-digital converter (the soundcard of the computer) and freely available internet software. REFERENCES 1. 2. 3. 4. 5.
BERNTSON, G., T. BIGGER, D. ECKBERG, P. GROSSMAN, P. KAUFMANN, Heart rate variability: origins, methods and interpretive caveats, Psychophysiology, 1997, 34, 623–648. BUCCELLETTI, F., E. GILARDI, E. SCAINI, Heart rate variability and myocardial infarction: systematic literature review and metanalysis, Eur. Rev. Med. Pharmacol. Sci., 2009, 13, 299–307. DOUGHERTY, C., R. BURR, Comparison of heart rate variability in survivors and nonsurvivors of sudden cardiac arrest. Am. J. Cardiol. 1992, 70, 610–615. KARIM, N., J. HASAN, S. ALI, Heart rate variability – a review, Journal of Basic and Applied Sciences, 2011, 7, 71–77. KITLAS, A., E. OCZERETKO, M. KOWALEWSKI, M. BOROWSKA, M. URBAN, Nonlinear dynamics methods in the analysis of the heart rate variability, Annales Academiae Medicae Bialostocensis, 2005, 50, 46–47.
124 6.
Ş.-C. Mirescu, S.W. Harden
8
KLEIGER, E., P. MILLER, T. BIGGER, A. MOSS, Decreased heart rate variability and its association with increased mortality after acute myocardial infarction, Am. J. Cardiol., 1987, 59, 256–262. 7. LERMA, C., O. INFANTE, H. PEREZ-GROVAS, M. JOSE, Poincaré plot indexes of heart rate variability capture dynamic adaptations after haemodialysis in chronic renal failure patients, Clin. Physiol. & Func. Im., 2003, 23, 72–80. 8. POANTĂ, L., I. DAMIAN, A. ALBU, Variabilitatea frecvenţei cardiace şi toleranţa la efort la pacienţii cu diabet zaharat tip II, Palestrica Mileniului III – Civilizaţie şi Sport, 2010, 3, 198–201. 9. ROCHE, F., J. GASPOZ, I. COURT-FORTUNE, P. MININI, V. PICHOT, D. DUVERNEY, Screening of obstructive sleep apnea syndrome by heart rate variability analysis, Circulation, 1999, 100, 1411–1415. 10. SZTAJEL, J., Heart rate variability: a noninvasive electrocardiographic method to measure the autonomic nervous system, Swiss Med. Wkly, 2004, 134, 514–522. 11. THALANGE, A., R. MERGU, HRV analysis of arrhythmias using linear – nonlinear parameters, International Journal of Computer Applications, 2010, 1, 75–80.