ORIGINAL ARTICLE Ann Clin Neurophysiol 2017;19:34-39 https://doi.org/10.14253/acn.2017.19.1.34
ANNALS OF CLINICAL NEUROPHYSIOLOGY
Normal data on axonal excitability in Koreans Ju Young Lee1, Jin Hyeok Yu1, So Young Pyun2, Sanghyo Ryu3, and Jong Seok Bae1 1
Department of Neurology, Kangdong Sacred Heart Hospital, Hallym University College of Medicine, Seoul, Korea Department of Neurology, National Police Hospital, Seoul, Korea 3 Department of Neurology, Headong Hospital, Busan, Korea 2
Received: October 11, 2016 Revised: December 13, 2016 Accepted: December 13, 2016
Correspondence to
Jong Seok Bae Department of Neurology, Kangdong Sacred Heart Hospital, Hallym University College of Medicine, 150 Seongan-ro, Gangdong-gu, Seoul 05355, Korea Tel: +82-2-2224-2206 Fax: +82-2-2224-2339 E-mail:
[email protected]
Background: Automated nerve excitability testing is used to assess various peripheral neuropathies and motor neuron diseases. Comparing these excitability parameters with normal data provides information regarding the axonal excitability properties and ion biophysics in diseased axons. This study measured and compared normal values of axonal excitability parameters in both the distal motor and sensory axons of normal Koreans. Methods: The axonal excitability properties of 50 distal median motor axons and 30 distal median sensory axons were measured. An automated nerve excitability test was performed using the QTRACW threshold-tracking software (Institute of Neurology, University College London, London, UK) with the TRONDF multiple excitability recording protocol. Each parameter of stimulus–response curves, threshold electrotonus, current–voltage relationship, and recovery cycle was measured and calculated. Results: Our Korean normal data on axonal excitability showed ranges of values and characteristics similar to previous reports from other countries. We also reaffirmed that there exist characteristic differences in excitability properties between motor and sensory axons: compared to motor axons, sensory axons showed an increased strength–duration time constant, more prominent changes in threshold to hyperpolarizing threshold electrotonus (TE) and less prominent changes in threshold to depolarizing TE, and more prominent refractoriness and less prominent subexcitability and superexcitability. Conclusions: We report normal data on axonal excitability in Koreans. These data can be used to compare various pathological conditions in peripheral nerve axons such as peripheral neuropathies and motor neuron disease. Key words: Nerve excitability testing; Threshold tracking; Normal; Axonal excitability; Korean
http://www.e-acn.org
Copyright © 2017 The Korean Society of Clinical Neurophysiology
pISSN 2508-691X eISSN 2508-6960
This is an Open Access article distributed under the terms of the Creative Commons Attribution Non-Commercial License (http:// creativecommons.org/licenses/by-nc/4.0) which permits unrestricted non-commercial use, distribution, and reproduction in any medium, provided the original work is properly cited.
Ju Young Lee, et al. Korean data on axonal excitability
INTRODUCTION The conventional nerve conduction study (NCS) has been the gold standard in diagnoses of peripheral neuropathies (PNs). NCSs are well known for their reliability, validity, and consistency for defining a pathological condition in peripheral nerves. Nonetheless, NCSs have some limitations clinically disclosing a diseased nerve. While conventional NCSs can define and localize a lesion among various peripheral nerves, they frequently show so-called clinical-electrophysiological dissociation, whereby the severity of clinical impairment is dissociated from the electrophysiological severity.1 Furthermore, the NCS has limitations in reflecting the pathophysiology of PNs and motor neuron disease (MND).2 A recently developed nerve excitability test (NET) that uses a threshold-tracking technique can provide insights into the ionic mechanisms responsible for the pathophysiology of axonal dysfunction in PN and MND.2,3 This protocol is noninvasive and less time-consuming, and so it can be used for the real-time assessment of peripheral nerve function or dysfunction.2,4 The NET allows biophysical assessments of specific ionic conductances in vivo as well as determinations of axonal excitability.2,5 Many researchers (mainly from Australia, Europe, and Japan) have provided valuable data for clarifying physiological and pathophysiological processes in various fields of clinical neurology. These studies have yielded normal values of each parameter of axonal excitability.6,7 Some studies employing this relatively new technique have also been performed in Korea,8,9 but there are no systematic normal data from multiple excitability measurements in both motor and sensory axons of Koreans. This study evaluated the adoptability of the NET to healthy Korean controls in order to provide normal data on axonal excitability for the threshold-tracking protocol in both motor and sensory axons of distal median nerves.
MATERIALS AND METHODS Subjects
52 years. None of them had clinical or electrophysiological evidence of a peripheral nerve disorder, radiculopathies, or diabetes mellitus. All subjects gave informed consent to participate in the experimental procedures, which had been approved by the Ethics Committee of Kangdong Sacred Heart Hospital.
Automated nerve excitability test An automated NET was performed using threshold-tracking software (QTRACW; Institute of Neurology, University College London, London, UK) with the TRONDF multiple excitability recording protocol. Compound muscle action potentials (CMAPs) were recorded from each muscle for stimulation of the median nerve at the wrist (3 cm proximal to the wrist crease). For the measurement of sensory axons, the sensory nerve action potential (SNAP) was measured at the distal index finger for stimulation at the wrist. The skin temperature was measured near the stimulating site, and was kept above 32°C. The protocol used to examine stimulus–response curves involved stimulus durations of 0.2 and 1.0 ms. The strength–duration time constant (SDTC) was determined by applying Weiss’ formula to the plots of threshold charge against stimulation duration; the SDTC was given by the (negative) intercept on the duration axis.10,11 The current required to produce a CMAP that was 40% of the maximum was tracked. In the threshold electrotonus (TE) studies, the membrane potential was altered using subthreshold DC polarizing currents that were 40% of the unconditioned threshold. Depolarizing and hyperpolarizing currents were used, each lasting 100 ms, and their effects on the threshold current for the test CMAP were examined. In a further test involving subthreshold conditioning currents, the test stimulus was delivered at the end of a polarizing current pulse lasting 200 ms. The intensity of the current pulse was changed systematically from 50% depolarizing to 100% hyperpolarizing in steps of 10% so as to yield a current–threshold relationship, which is analogous to a conventional current–voltage relationship. The recovery cycle (RC) of axonal excitability after a single supramaximal stimulus was measured by delivering the test stimulus at different intervals (from 2 to 200 ms) after the conditioning stimulus.
This study included 50 Korean normal volunteers (including 24 men) aged 31-67 years, with a median age of
https://doi.org/10.14253/acn.2017.19.1.34
http://www.e-acn.org
35
Annals of Clinical Neurophysiology Volume 19, Number 1, January 2017
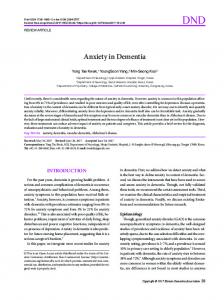
RESULTS Axonal excitability in distal median motor axons The full sequence of stimuli and excitability measurements was performed on the median motor axon for all 50 subjects. As described in the Methods section, the protocol used to obtain stimulus–response curves involved stimulus
durations of 0.2 and 1.0 ms. The obtained data are shown in Fig. 1A. Regarding TE testing, the changes in excitability occurring during and after long-duration (100 ms) subthreshold depolarizing and hyperpolarizing currents are illustrated in Fig. 1B. A subtest measuring the changes in excitability after a supramaximal conditioning stimulus recorded various parameters of RC, such as the absolute and relative refracto-
A
B
C
D
Fig. 1. Responses to excitability testing in the motor and sensory axons of the median nerve. After stimulating the wrist, the excitability of the motor axon was measured at the abductor pollicis brevis (n = 50, black circles) and that of the sensory axon was measured at the index finger (n = 30, red circles). The graphs show the strength–duration properties (A), threshold electrotonus (B), recovery cycle (C), and current–voltage relationship (D) for each group. The actual data are given in Table 1. Data are mean and SEM values.
36
https://doi.org/10.14253/acn.2017.19.1.34
http://www.e-acn.org
Ju Young Lee, et al. Korean data on axonal excitability
ry periods, the supernormal period, and the late subnormal period (Fig. 1C). The normalized threshold changes at the end of 200-ms current pulses are plotted in Fig. 1D. The threshold change was measured for each level of conditioning current, from +50% to –100% of the control threshold. The mean values of the parameters are summarized in Table 1. Although Korean data and previous data from other countries are not directly comparable, because most reports have not included raw demographic information, the most notable difference was the SDTC being higher in the Korean data than in the Japanese and Australian data.6,7 However, newer Australian data revealed a higher value of the SDTC.12 In addition, our data showed a tendency for larger changes in the threshold to both depolarizing and hyperpolarizing conditioning, and greater superexcitability.
This study has yielded normal data on axonal excitability in healthy Koreans. The increasing utility of the automated NET
means that our data can be utilized as a normal control for the comparative analysis of patients with PN or MND. We obtained some distinctive data compared to reports from other countries (e.g., slightly increased SDTC).6,7,13 However, direct comparison between our data and previous data is not possible due to differences in technical methods (e.g., in electrodes and cables) and extraneural factors (e.g., skin impedance varying with race). In practical applications, several technical factors that can alter the physiological homeostasis of humans are now known to interfere with results obtained for axonal excitability, such as temperature, serum potassium level, and hyperventilation.14-16 Unfortunately, we did not obtain blood samples while performing the NET. However, we carefully monitored the surface temperature of the stimulation site, and identified if the temperature exceeded 32°C. Additionally, the limitations of excitability measurements that need to be considered in general have been reviewed previously.17 Our study has reaffirmed that the tendency of excitability differences between motor and sensory axons within the human distal median nerve.18 It is known that large myelinated sensory axons have a greater persistent sodium current than alpha motor axons, and also exhibit inward rectification.17 This difference in excitability can explain why paresthesia develops in sensory nerves more often than does fasciculation or cramp in motor nerves in PNs.19 There are also differences in excitability between sensory axons innervating different skin regions, with slow potassium conductance and inward rectification being more prominent in median sensory axons than in sural sensory axons.20 The automated NET was developed as the first clinically usable protocol for making multiple measurements of axonal excitability in human subjects. Such measurements provide information on the biophysical properties of motor and sensory axons, and reflect principally the resting membrane potential and the effects of activation of ion channels by subthreshold changes in membrane potential or by the passage of nerve impulses. The NET yields diverse data regarding the physiological differences in the excitability properties of human peripheral nerves. As excellent monographs have already summarized, multiple excitability measurements have provided important information regarding various ionic conductance and currents relating to axonal excitability .2,3,5,21
https://doi.org/10.14253/acn.2017.19.1.34
http://www.e-acn.org
Axonal excitability in distal median sensory axons The full sequence of stimuli and excitability measurements, as described in the Methods, was also applied to the median sensory axons in all 30 subjects. The sensory and motor axons were stimulated at the same site, and the testing protocol and analysis procedure were identical to those for motor axons, as described in the previous section. Fig. 1 shows the differences in the various excitability measurements. While the recordings are not comparable between motor and sensory axons, the overall parameters were similar in the two axon types. As indicated in Fig. 1, in which black and red colors show excitability measurements of motor and sensory axons, respectively, compared to motor axons, sensory axons showed a less-steep stimulus–response curve (figure is not shown), a longer SDTC with a lower rheobase current, and smaller/larger threshold changes to depolarizing/hyperpolarizing subconditioning in TE. In RC, there was less superexcitability in sensory axons. However, these differences are not directly comparable because our protocol involved a shorter stimulation duration for the sensory study (0.1 and 0.5 ms, as against 0.2 and 1 ms for the motor axons).
DISCUSSION
37
Annals of Clinical Neurophysiology Volume 19, Number 1, January 2017
Table 1. Normal values of excitability parameters in distal median motor and sensory axons Age Sex (number of males)
Median motor axonsa (n = 50)
Median sensory axonsb (n = 30)
46.2 ± 8.9
39.6 ± 6.7
27
14
Stimulus–response and strength–duration relationships Stimulus for 50% CMAP (mA)
2.47 ± 1.05
1.78 ± 1.06
Strength–duration time constant (ms)
0.49 ± 0.01
0.52 ± 0.02
Rheobase current (mA)
1.60 ± 1.05
0.80 ± 1.06
Stimulus–response slope
4.36 ± 1.04
2.90 ± 1.10
Maximal CMAP (mV) / peak SNAP (µV)
13.6 ± 1.5
19.3 ± 5.2
71.9 ± 0.6
61.8 ± 1.6
Threshold electrotonus TEd(10-20)c (%) d
TEd(40-60) (%)
54.4 ± 0.6
52.0 ± 1.8
TEd(90-100)e (%)
50.9 ± 0.7
54.7 ± 1.9
TEd undershoot f (%)
–17.2 ± 0.5
–24.1 ± 1.8
TEd peak (%)
71.7 ± 0.6
62.0 ± 1.2
TEh(10-20)g (%)
–77.4 ± 0.8
–89.3 ± 3.3
TEh(20-40)h (%)
–96.6 ± 1.2
–114.0 ± 4.5
TEh(90-100)i (%)
–127.7 ± 2.5
–150.4 ± 10.1
TEh overshootj (%)
14.1 ± 0.7
22.5 ± 1.7
TEh slope 101-140
2.06 ± 0.04
2.70 ± 0.15
Resting I/V slope
0.50 ± 0.01
0.48 ± 0.03
Minimum I/V slope
0.25 ± 0.01
0.22 ± 0.01
Hyperpolarizing I/V slope
0.43 ± 0.02
0.38 ± 0.04
Current–threshold relationship
Recovery cycle Superexcitability (%)
–27.6 ± 1.0
–24.3 ± 1.8
Subexcitability (%)
13.1 ± 0.5
11.9 ± 1.0
Relative refractory period (ms)
3.09 ± 1.01
3.69 ± 1.03
Data are mean ± SEM values, except age and sex, which are mean ± SD values. CMAP, compound muscle action potential; SNAP, sensory nerve action potential; TEd, depolarizing threshold electronus; TEh, hyperpolarizing threshold electrotonus; I/V, current–voltage relationship. a Measurement from abductor pollicis brevis muscle after stimulating distal median motor axon at the wrist. b Measurement from index finger after stimulating distal sensory axon at the wrist. c TEd after 10-20 ms of depolarizing current. d TEd after 40-60 ms of depolarizing current. e TEd after 90-100 ms of depolarizing current. f Undershoot of TEd after termination of the current g TEh after 10-20 ms of hyperpolarizing current. h TEh after 20-40 ms of hyperpolarizing current. i TEh after 90-100 ms of hyperpolarizing current. j Overshoot of TEh after termination of the current.
Finally, the NET provides local measures of nerve function that regionally reflect the biophysical properties underlying the stimulating electrode.17 In this context, previous studies have demonstrated that even at the same
site of the same nerve, the excitability properties of motor axons can differ significantly according to the muscles that they innervate.8,13,22 Conversely, it has also been reported that axonal excitability in the same muscle recording can
38
http://www.e-acn.org
https://doi.org/10.14253/acn.2017.19.1.34
Ju Young Lee, et al. Korean data on axonal excitability
differ when stimulating different sites of the same nerve. Therefore, our data should be interpreted based on the specific situation of distal motor and sensory axons of the median nerve.
11. Z'Graggen WJ, Lin CS, Howard RS, Beale RJ, Bostock H. Nerve excitability changes in critical illness polyneuropathy. Brain 2006;129(Pt 9):2461-2470. 12. Murray JE, Jankelowitz SK. A comparison of the excitability of motor axons innervating the APB and ADM muscles. Clin Neuro-
REFERENCES
physiol 2011;122:2290-2293. 13. Jankelowitz SK, Burke D. Axonal excitability in the forearm: normal data and differences along the median nerve. Clin Neuro-
1. Bae JS, Kim BJ. Subclinical diabetic neuropathy with normal conventional electrophysiological study. J Neurol 2007;254:53-59. 2. Kuwabara S, Misawa S. Axonal ionic pathophysiology in human peripheral neuropathy and motor neuron disease. Curr Neurovasc Res 2004;1:373-379. 3. Nodera H, Kaji R. Nerve excitability testing and its clinical application to neuromuscular diseases. Clin Neurophysiol 2006;117:1902-1916. 4. Kiernan MC, Burke D, Andersen KV, Bostock H. Multiple measures of axonal excitability: a new approach in clinical testing. Muscle Nerve 2000;23:399-409. 5. Burke D, Kiernan MC, Bostock H. Excitability of human axons. Clin Neurophysiol 2001;112:1575-1585.
physiol 2009;120:167-173. 14. Kiernan MC, Cikurel K, Bostock H. Effects of temperature on the excitability properties of human motor axons. Brain 2001;124(Pt 4):816-825. 15. Mogyoros I, Kiernan MC, Burke D, Bostock H. Excitability changes in human sensory and motor axons during hyperventilation and ischaemia. Brain 1997;120(Pt 2):317-325. 16. Krishnan AV, Phoon RK, Pussell BA, Charlesworth JA, Bostock H, Kiernan MC. Altered motor nerve excitability in end-stage kidney disease. Brain 2005;128(Pt 9):2164-2174. 17. Bostock H, Cikurel K, Burke D. Threshold tracking techniques in the study of human peripheral nerve. Muscle Nerve 1998;21:137158.
6. Jankelowitz SK, McNulty PA, Burke D. Changes in mea-
18. Kiernan MC, Lin CS, Andersen KV, Murray NM, Bostock H. Clinical
sures of motor axon excitability with age. Clin Neurophysiol
evaluation of excitability measures in sensory nerve. Muscle
2007;118:1397-1404.
Nerve 2001;24:883-892.
7. Bae JS, Sawai S, Misawa S, Kanai K, Isose S, Shibuya K, et al. Effects of age on excitability properties in human motor axons. Clin Neurophysiol 2008;119:2282-2286.
19. Kuwabara S. Physiological differences in excitability among human axons. Clin Neurophysiol 2009;120:1-2. 20. Lin CS, Mogyoros I, Kuwabara S, Cappelen-Smith C, Burke D.
8. Paeing SH, Kang MR, Ahn SH, Lee MW, Pyun SY, Bostock H, et al.
Accommodation to depolarizing and hyperpolarizing currents
Relative sparing of the second lumbrical muscle in carpal tunnel
in cutaneous afferents of the human median and sural nerves. J
syndrome is not associated with regional differences in axonal
Physiol 2000;529 Pt 2:483-492.
membrane potential. Clin Neurophysiol 2016;127:905-910. 9. Bae JS, Kim OK, Kim JM. Altered nerve excitability in subclinical/ early diabetic neuropathy: evidence for early neurovascular pro-
21. Bae JS. Automated nerve excitability test by utilizing threshold tracking technique. Korean J Clin Neurophysiol 2014;16 Suppl 1:82-86.
cess in diabetes mellitus? Diabetes Res Clin Pract 2011;91:183-189.
22. Krishnan AV, Lin CS, Kiernan MC. Nerve excitability properties in
10. Mogyoros I, Kiernan MC, Burke D. Strength-duration properties
lower-limb motor axons: evidence for a length-dependent gra-
of human peripheral nerve. Brain 1996;119(Pt 2):439-447.
https://doi.org/10.14253/acn.2017.19.1.34
dient. Muscle Nerve 2004;29:645-655.
http://www.e-acn.org
39