IEEE SIGNAL PROCESSING LETTERS, VOL. 22, NO. 8, AUGUST 2015
1175
Normality and Correlation Coefficient in Estimation of Insulators’ Spectral Signature Glauco Fontgalland, Senior Member, IEEE, and Haslan J. G. Pedro
Abstract—This work aims to classify the contamination state in insulators using statistical signal processing approaches. When subjected to high voltage, insulators can radiate radio frequency signals (corona effect). The histograms, normality, and correlation coefficient statistical methods are used to estimate the pollution state in glass insulators when subjected to 8 kV. It is shown that in particular situations the histograms can be used to distinguish clean and dirty insulators. The histogram limitation analysis can be improved using the correlation coefficient and the normality or Gaussianity test. Indeed, it is shown that using these parameters into an analysis per sub-bands, it is possible to estimate the pollution state of the insulators. That is, the analysis using these tools checks if the insulators spectra under test are noticeably different from the clean one, used as reference. It is achieved eliminating the fast variation of the correlation coefficient based on the amplitude and width of the peaks. The tests were done up to the frequency of 1 GHz using measured data. Index Terms—Correlation coefficient, high voltage, histograms, insulators, normality test.
I. INTRODUCTION
T
HE electric power distribution network faces many problems, among them: the power outrages caused by defects in insulators transmission lines (TL). During its operating lifetime, the insulator is exposed to environmental pollution and weathering for many years. The accumulation of dirt leads to degradation of insulator’s insulation and therefore compromises the isolation of the TL with consequences on efficiency of the system [1]–[5]. Dirt and faulty insulators emit electromagnetic fields in frequencies greater than 50 Hz [6], [7]. In a simplified way this phenomenon can be interpreted as the ionization of air molecules surrounding the insulator surface due to the applied high electric field. As result resonances at different specific frequencies will occur. This phenomenon can produce sound, light, electromagnetic pulses and heating. Accordingly, many methods have been proposed for the detection of faulty insulators (thermal image, corona camera, ultrasonic sensors, neon lamp, electric field harmonics, microphone arrays, UHF sensors) [8]–[13].
Manuscript received November 10, 2014; accepted December 29, 2014. Date of publication January 12, 2015; date of current version January 16, 2015. This work was supported in part by Eletrobrás/CEAL Electric Power Company Contract 294/2011and by Brazilian Funding Agency CNPq under Grant 309925/ 2012-6. The associate editor coordinating the review of this manuscript and approving it for publication was Prof. Yan Lindsay Sun. The authors are with the Department of Electrical Engineering, Federal University of Campina Grande, PB, Brazil (e-mail:
[email protected];
[email protected];
[email protected]). Color versions of one or more of the figures in this paper are available online at http://ieeexplore.ieee.org. Digital Object Identifier 10.1109/LSP.2015.2390638
Indeed, the radiated signal by high-voltage (HV) insulators cover a broadband frequency of the spectrum. Most studies [6], [14]–[16] on this phenomenon have been concentrated in the region below 1 GHz. Once the insulator is under HV, its resonance frequencies are related to the geometry and physical condition of the insulator. The frequency spectrum of the insulator is called insulator’s signature. Therefore, it is possible that not all frequency bands contain the information needed to describe the insulator’s signature. The identification of the bandwidths that best represent the spectral response of the insulator is the main focus of this paper. This information is important for continuing monitoring smart grid systems, where TL critical sectors can be identified from the estimation of insulators conservation state. Moreover, once the frequency sub-bands are identified portable antennas can be built for use in aerial survey and UAS (unmanned aerial systems). In this work, we take the advantages of statistical signal processing tools such as correlation coefficient, normality test and histograms to analyze measured data. The spectrum signature was obtained when 8 kV was applied to the glass insulator, which is the voltage on the first element of a six-insulator chain of a 69 kV transmission line. II. CORRELATION COEFFICIENT In studies involving two or more variables, it is important to know the degrees of relationship between them. A measure of the degrees of relationship between two variables is called correlation coefficient. The correlation coefficient between two random variables can be measured using the Pearson Correlation Coefficient ( ) also known as Coefficient of Correlation Product Moment [17]. It is calculated using (1): (1) and are the standard deviations of the variables where and , respectively. The is a measure expressing the joint variation of two variables written as: (2) where and are the mean of each variable. The Pearson Correlation Coefficient is dimensionless and ranges from -1 to . The positive or negative values suggest the direction and the strength of the relationship between variables. A perfect correlation (-1 or ) indicates that the score of a variable can be determined exactly when they know the
1070-9908 © 2015 IEEE. Personal use is permitted, but republication/redistribution requires IEEE permission. See http://www.ieee.org/publications_standards/publications/rights/index.html for more information.
1176
IEEE SIGNAL PROCESSING LETTERS, VOL. 22, NO. 8, AUGUST 2015
score of the other. On the other hand, a zero correlation value indicates no linear relationship between the variables. However, in practice different values of may occur. Its interpretation depends heavily on the goals of the application and why it is calculated [18], [19]. The correlation coefficient can be evaluated as follows: • If , there is a weak linear correlation; • If , there is a moderate linear correlation; • If , there is a strong linear correlation; • If , there is a very strong linear correlation; The coefficient does not distinguish independent and dependent variables. Furthermore, the absolute value of is not affected by any linear transformation of or .
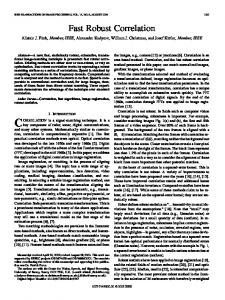
Fig. 1. Spectrum of the clean and dirty insulators in the sub-band of 30 MHz to 130 MHz. The highest peaks located around 6, 8, 9 and 10 MHz are due to local broadcasting transmission.
III. HISTOGRAMS One way to describe the distribution of a set of data is by means of histograms, which allow us to immediately see the shape or specific pattern of their distribution. The histograms provide important information about the data distribution: shape, mean and variance. Hence, it gives information on how the data are stored in any distribution. Moreover, the peaks in the histograms show the similarities between the data. This parameter can furnish valuable information about the process, while the mean does not provide a complete picture of the data. For instance, histograms can be applied in sub-intervals to enhance the image contrast [20]. When histograms are used for classification of insulators’ conservation state, the location of the mean is not always crucial to distinguish between clean and dirty insulators. Regardless of its shape and variance, the histogram can be used to indicate whether the data is different. IV. NORMALITY TEST In statistics, the normality or Gaussianity test is used in many signal processing applications [21]. It is applied to determine if a data set of a given random variable is well modeled by a normal distribution or not. The normality test avoids errors of type I and type II during the analysis by correlation. The error of type I means that there is a relationship between variables, when in fact there is no relationship. It is called false positive. The error of type II means that there is no relationship between the variables, when in fact exist relationship between them, and is called false negative. In this work, the Shapiro-Wilk test was applied for normality test [22][23]. The low error rates in this method make it one of the most effective method. The method is based on the statistic , which test if a set of samples has a specific normal distrimean that the data set bution. Small values of cannot be modeled by normal distribution, while large values can. is calculated as follows: The statistics (3)
where are the samples values, is the mean of the samples, and are the normalized best linear unbiased coefficients generated by the mean, variance and covariance. V. GENERAL INFORMATION ABOUT THE DATA The data used in this work were obtained from measurements conducted at the High Voltage Laboratory–LAT, at the Federal University of Campina Grande–UFCG, Brazil, using a spectrum analyzer. Over 300 measurements were done to ensure a significant combination of the variables (voltage levels, the antenna polarization, and frequency band). Clean and polluted insulators were used during the tests. The following parameters were used in the setup for the analysis: • Voltage level applied to the insulator: 8 kV; • Frequency Range: 30-1,030 MHz; • Ten sub-bands of 100 MHz bandwidth; • Clean Insulator: (thoroughly clean); • Dirty Insulator: (completely dirty). Fig. 1 shows the spectrum of two measured signals. The signals’ range is from 30 MHz to 130 MHz, where 2,000 samples were taken to increase the frequency resolution. The results in Fig. 1 were obtained using a horizontally polarized antenna, when 8 kV rms voltage is applied to the insulator. This voltage correspond the voltage on the first element of a six-insulator chain in a 69 kV transmission line (TL). The red line in Fig. 1 is the plot result for the spectrum of the polluted glass insulator, while the green line represents the signal from clean glass insulator. It can be seen in this first sub-band (30–130 MHz) that the dirt particles on insulator surface attenuate the signal emitted from the insulator. The highest peaks (around 6, 8, 9 and 10 MHz) are from broadcasting transmission, and not digitally filtered here. VI. RESULTS Considering the use of the approach by histograms, a significant result can be obtained in the first sub-band from 30 MHz to 130 MHz with a horizontally polarized antenna (Fig. 2). The histogram of the clean insulator presents a shape more spread than the dirty insulator. The former histogram is used as reference for this sub-band. Although considerable overlap exist, the
FONTGALLAND AND PEDRO: NORMALITY AND CORRELATION COEFFICIENT
1177
Fig. 2. Histogram of the clean and dirty insulators for the 5th sub-band (30–130 MHz).
Fig. 4. Histogram of the clean and dirty insulators for the 10th sub-band (930–1030 MHz).
Fig. 3. Spectrum of the clean and dirty insulator in the range from 930 MHz to 1,030 MHz.
shape (or variance) of the respective histograms differ. Therefore, for this case, the histograms analysis can be used to estimate the conservation state of the insulators. The results obtained with histograms in Fig. 2 were expected, since the two spectra are neatly different (Fig. 1). When the spectra of the insulators are alike, the analysis by histograms is unable to distinguish them. The 5th sub-band (930 MHz to 1,030 MHz) is shown in Fig. 3. It can be seen in Fig. 4 that the histograms are nearly overlapped, i.e., the mean and variance for both insulators are almost the same. Therefore, the histogram analysis failed to distinguish the spectral signature of the insulators. To overcome the drawback of the analysis by histograms, we combine the correlation analysis and the normality test (Shapiro-Wilk test). This is applied to the ten sub-bands, with 100 MHz bandwidth each. There is information on insulator state in all sub-bands, due to the random nature of the dirt. The technique described in this section is based on use of AS R94 algorithm [24]. A set of samples can be modeled by a normal distribution, provided the sample size is in the . Two sets of samples of size range of were chosen. One set of the data for the clean and one for the dirty insulator were used. The technique tests the two sets, and calculates the correlation coefficient if and only if both sets can
Fig. 5. Correlation coefficient between clean and polluted insulators for the 10th sub-band (930–1,030 MHz).
Fig. 6. Correlation coefficient between clean and polluted insulators for the 10th sub-band (930–1,030 MHz), with fast variation peaks of filtered.
be modeled by a normal distribution. The Pearson correlation coefficient is calculated using Matlab corrcoef function. The result is a plot of the correlation coefficient versus frequency bandwidth (Fig. 5). Five measurements were made on clean and dirty insulators. Any significant changes on the plots for the correlation coefficients in Fig. 5 (and Fig. 6) were observed, meaning that the overall weak correlation was preserved. Fig. 5 shows the correlation coefficient for the 10th sub-band, which covers the bandwidth from 930 MHz to 1,030 MHz. One
1178
can see that the correlation coefficient presents few values close to , while most of them oscillate around the weak and moderate value of the correlation coefficient (section II). This information is used to find tracks of interest (where the signature of the insulators is weak correlated), even though the spectrum plot and histograms show overlapped shapes. Indeed, this approach uses the correlation coefficient between clean and dirty insulators to classify the insulator conservation state instead of histogram and spectrum plots. Let’s keep our focus on fast peaks of the correlation coefficient, Fig. 5. They are restricted to a very narrow band or even at point frequency in the spectrum. This high correlation is due to the random nature of the signal, which makes some points highly correlated. This result was expected since the signals are both from the same glass insulator under the same HV. Therefore, it is reasonable to neglect these narrow peaks in the analysis. When the peaks are filtered, one can considerably reduce the fluctuations, keeping only the essential information in the analysis. The two conditions used to select the fast variation of to be eliminated are: the amplitude and width of the fast peaks of the correlation coefficient. By setting the minimum amplitude - based on the moderate linear correlation - and the maximum relative frequency bandwidth ( ) to the fast peaks, the algorithm scans the spectrum looking for peaks within these requirements and digitally filter them. Using the criteria described above on Fig. 5, the result is a smooth curve (less fast variations of ) where can be seen that the two sets of data (clean and polluted) are weakly correlated in this sub-band (Fig. 6). This conclusion is not possible from observation of Fig. 3 and Fig. 4 (curve plots). Using the clean insulator as reference, the selection of the sub-bands is made based on the low correlation with the dirty insulator. The few remaining frequencies with fast variation of the correlation coefficient do not have significant impact on the decision-making of the algorithm. These are frequencies where it is not possible to distinguish the conservation state between the insulators by using this approach. Accordingly, combining the statistical tools (normality test and correlation coefficient) and the proposed criteria for elimination of fast variations of the correlation coefficient, it is possible to extract information from the spectral signature of the insulator. This leads us the choice to use the whole spectrum, covered here, or select a sub-band and use portable directive antennas during aerial survey. As mentioned previously, this analysis was extended up to 1 GHz. The results for the correlation coefficient for the 6th subband (530 to 630 MHz) and its spectrum are shown in Fig. 7 and Fig. 8, respectively. For this case, the results show a large frequency range where the two signals have low correlation coefficient, i.e., they present different state of conservation (the clean one is used as reference). A visual observation of the spectrum can barely tell us any information about the insulator state of conservation. It validates once again that the presented method can efficiently be used to estimate the insulator’s conservation state.
IEEE SIGNAL PROCESSING LETTERS, VOL. 22, NO. 8, AUGUST 2015
Fig. 7. Correlation coefficient between clean and dirty insulators for the 6th sub-band (530–630 MHz), with fast variation peaks of filtered.
Fig. 8. Spectrum of the clean and dirty insulators for the 6th sub-band (530–630 MHz).
No conclusion on the insulator’s conservation state could be extracted from the 4th, 7th and 8th sub-bands (330 MHz to 430 MHz, 630 MHz to 730 MHz, and 730 MHz to 830 MHz) due to high oscillation of the correlation coefficient. VII. CONCLUSION We have presented a simple statistical signal processing method for discriminating the physical conditions of glass insulators. It is based on RF signal emitted by insulators when subjected to HV. It was also shown that the analysis by histogram is limited to the first sub-band (30–130 MHz). The present analysis using correlation coefficient together with the normality test allowed for identification of others subbands. The spectral signature of the clean insulator was used as reference. Twenty-five measure combinations were considered for statistical relevance of the results. It was shown that it is possible to smooth the variation of the correlation coefficient and extract information about the insulator state of conservation, by eliminating the fast variation peaks. The loss of information during the removal of narrow peaks can be neglected into the decision-making by the algorithm. This approach can be used to identify the conservation state of glass insulator, and contribute to the design of portable antennas for air supervision.
FONTGALLAND AND PEDRO: NORMALITY AND CORRELATION COEFFICIENT
REFERENCES [1] H. Mei, L. Wang, and Z. Guan, “Influence of sugar as a contaminant on outdoor insulation characteristics of insulators in a substation,” IEEE Trans. Dielect. Electr. Insul., vol. 19, no. 4, pp. 1318–1324, Aug. 2012. [2] F. Mahmoud and R. M. A. Azzam, “Optical monitor for contamination on HV insulators surfaces,” IEEE Trans. Dielect. Electr. Insul., vol. 4, no. 1, pp. 33–38, Feb. 1997. [3] B. X. Du, Y. Liu, and H. J. Liu, “Recurrent plot analysis of leakage current for monitoring outdoor insulator performance,” IEEE Trans. Dielect. Electr. Insul., vol. 16, no. 1, pp. 139–146, Feb. 2009. [4] K. Iwai, Y. Hase, E. Nakamura, and H. Katsukawa, “Development of a new apparatus for contamination measurements of overhead transmission line insulators,” IEEE Trans. Power Del., vol. 13, no. 4, pp. 1412–1417, Oct. 1998. [5] J. Y. Li, C. X. Sun, W. X. Sima, and Q. Yang, “Stage pre-warning based on leakage current characteristics before contamination flashover of porcelain and glass insulator,” IET Gen. Transm. Distrib., vol. 3, no. 7, pp. 605–615, Feb. 2009. [6] G. Fontgalland, E. M. Silva, and J. M. B. Bezerra et al., “On the behavior of electromagnetic interference measured from glass insulator,” in Proc. ANTEM2004/URSI, Ottawa, ON, Canada, Jul. 2004, pp. 20–23. [7] E. Moura, A. Leite, B. Albert, and G. Fontgalland, “Statistical classification of contamination in glass insulators by reading its spectrum,” Int. J. Appl. Electromagn. Mech., vol. 45, pp. 589–595, 2014. [8] Y. Cheng, C. Li, and X. Huang, “Study of corona discharge pattern on high voltage transmission lines for inspecting faulty porcelain insulators,” IEEE Trans. Power Del., vol. 23, no. 2, pp. 945–952, Apr. 2008. [9] G. C. Carter and P. B. Abraham, “Estimation of source motion from time delay and time compression measurements,” J. Acoust. Soc. Amer., vol. 67, no. 3, pp. 830–832, Mar. 1980. [10] T. Nishiura, T. Yamada, S. Nakamura, and K. Shikano, “Localization of multiple sound sources based on a CSP analysis with a microphone array,” in Proc. IEEE Int. Conf. Acoust., Speech, Signal Process, 2000, vol. 2, pp. 1053–1056. [11] T. Yamada, S. Nakamura, and K. Shikano, “Hands-free speech recognition based on 3-D Viterbi search using a microphone array,” in Proc. IEEE Int. Conf. Acoust., Speech, Signal Process., May 1998, vol. 1, pp. 245–248.
1179
[12] Y. Hu, H. Tang, and T. S. Huang, “Camera and microphone array for 3D audiovisual face data collection,” in Proc. IEEE Int. Conf. Acoust., Speech, Signal Process, Apr. 2008, pp. 2161–2164. [13] M. D. Judd, L. Wang, and I. B. B. Hunter, “Partial discharge monitoring for power transformers using uhf sensors part 1: Sensors and signal interpretation,” IEEE Electr. Insul. Mag., vol. 21, no. 2, pp. 5–14, Mar. /Apr. 2005. [14] P. J. Moore, I. E. Portugués, and I. A. Glover, “Remote diagnosis of overhead line insulation,” 2004-IEEE Power Eng. Soc. General Meeting, pp. 1831–1835, Jun. 2004. [15] A. Tungkanawanich, J. Abe, and K. Matsuura, “Location of partial discharge source on distribution line by measuring emitted pulse-train electromagnetics waves,” IEEE Power Eng. Soc. Winter Meeting, vol. 4, no. 3, pp. 2453–2458, 2000. [16] P. J. Moore, I. E. Portugués, and I. A. Glover, “Radiometric location of partial discharge sources on energized high-voltage plant,” IEEE Trans. Power Del., vol. 20, no. 3, pp. 2264–2272, Jul. 2005. [17] J. Cohen, Statistical Power Analysis for the Behavioral Sciences. Hillsdale, NJ, USA: Lawrence Erlbaum, 1988. [18] R. Taylor, “Interpretation of correlation coefficient: A basic review,” JMDS, vol. 1, pp. 35–39, Jan./Feb. 1990. [19] A. G. Asuero, A. Sayago, and A. G. Gonzalez, “The Correlation Coefficient: An Overview,” Crit. Rev. Analyt. Chem., vol. 36, pp. 41–59, 2006. [20] S. W. Jung, “Image contrast enhancement using color and depth histograms,” in Proc. IEEE Signal Process. Letters, Apr. 2014, vol. 21, no. 4, pp. 382–385. [21] L. Lu, K. Yan, H. C. Wu, and S. Yu, “Novel robust normality measure for sparse data and its application for weak signal detection,” in Proc. IEEE Trans. Commun., May 2013, vol. 12, no. 5, pp. 2400–2408. [22] S. S. Shapiro, M. B. Wilk, and H. J. Chen, “A comparative study of various tests for normality,” J. Amer. Statist. Assoc., vol. 63, no. 324, pp. 1343–1372, Dec. 1968. [23] J. P. Royston, “An extension of Shapiro and Wilk’s W test for normality to large samples,” J. Roy. Statist. Soc., ser. C, vol. 31, no. 2, pp. 115–124, 1982. [24] J. P. Royston, “Remark AS R94: A remark on algorithm AS 181: The w-test for normality,” J. Roy. Statist. Soc., vol. 44, no. 4, pp. 547–551, 1995.