ECOLEC-04558; No of Pages 11 Ecological Economics xxx (2013) xxx–xxx
Contents lists available at ScienceDirect
Ecological Economics journal homepage: www.elsevier.com/locate/ecolecon
Notes from the field: Lessons learned from using ecosystem service approaches to inform real-world decisions☆ Mary Ruckelshaus a,⁎, Emily McKenzie b,c, Heather Tallis d, Anne Guerry a, Gretchen Daily e, Peter Kareiva f, Stephen Polasky g, Taylor Ricketts h, Nirmal Bhagabati b, Spencer A. Wood a, Joanna Bernhardt i a The Natural Capital Project, Department of Biology and the Woods Institute for the Environment at Stanford University; c/o School of Environmental and Forest Sciences, Univ. of Washington, Box 352100, Seattle, WA 98195, USA b WWF-US, Conservation Science Program, World Wildlife Fund, 1250 24th St NW, Washington, DC 20037, USA c WWF-UK, Panda House, Weyside Park, Godalming, Surrey GU7 1XR, UK d The Nature Conservancy, c/o California Program, 201 Mission Street, 4th Floor, San Francisco, CA 94105-1832, USA e Center for Conservation Biology and The Natural Capital Project, Department of Biology and the Woods Institute for the Environment, Stanford University, 371 Serra Mall, Stanford, CA 94305, USA f The Nature Conservancy, 4722 Latona Ave. NE, Seattle, WA 98105, USA g Departments of Applied Economics and Ecology, Evolution and Behavior 337E Ruttan Hall, University of Minnesota, 1994 Buford Ave, St. Paul, MN 55108, USA h Gund Institute for Ecological Economics, University of Vermont, 617 Main Street, Burlington, VT 05405, USA i Department of Zoology, University of British Columbia, 6270 University Boulevard, Vancouver, BC V6T 1Z4, Canada
a r t i c l e
i n f o
Article history: Received 27 October 2012 Received in revised form 23 July 2013 Accepted 25 July 2013 Available online xxxx Keywords: Ecosystem services Human development and conservation Spatial planning PES Decision support
a b s t r a c t While there have been rapid advances in assessments of biodiversity and ecosystem services (BES), a critical remaining challenge is how to move from scientific knowledge to real-world decision making. We offer 6 lessons from our experiences applying new approaches and tools for quantifying BES in 20 pilot demonstrations: (1) Applying a BES approach is most effective in leading to policy change as part of an iterative science-policy process; (2) simple ecological production function models have been useful in a diverse set of decision contexts, across a broad range of biophysical, social, and governance systems. Key limitations of simple models arise at very small scales, and in predicting specific future BES values; (3) training local experts in the approaches and tools is important for building local capacity, ownership, trust, and long-term success; (4) decision makers and stakeholders prefer to use a variety of BES value metrics, not only monetary values; (5) an important science gap exists in linking changes in BES to changes in livelihoods, health, cultural values, and other metrics of human wellbeing; and (6) communicating uncertainty in useful and transparent ways remains challenging. © 2013 The Authors. Published by Elsevier B.V. All rights reserved.
1. Introduction There is growing science and policy attention on sustaining natural capital and the flow of ecosystem services that support human wellbeing. This attention has the potential to transform decision-making across vast resource-intensive sectors and human development efforts. Growth in knowledge of ecosystem services has been rapid, from early academic treatments (e.g., Daily, 1997; Ehrlich and Mooney, 1983) to the first global assessment of ecosystem services (MA, 2005). More recently, detailed work on definitions, metrics, and assessments have followed (e.g., Bateman et al., 2011; Bennett et al., 2009; Boyd and Banzhaf,
☆ This is an open-access article distributed under the terms of the Creative Commons Attribution-NonCommercial-No Derivative Works License, which permits non-commercial use, distribution, and reproduction in any medium, provided the original author and source are credited. ⁎ Corresponding author. E-mail address:
[email protected] (M. Ruckelshaus).
2007; Cardinale et al., 2012; Egoh et al., 2008; Ehrlich et al., 2012; Fisher et al., 2009, 2011; Mace et al., 2012; Naidoo et al., 2008; Nelson et al., 2009; Polasky et al., 2011; Raudsepp-Hearne et al., 2010; Reyers et al., 2012; Seppelt et al., 2011; Tallis and Polasky, 2011). These scientific advances have led to an explosion of interest in ecosystem services in both the public and private sectors. Numerous efforts currently are underway to make the concept of ecosystem services operational and linked with decision-making. In 2012, the Intergovernmental Science-Policy Platform on Biodiversity and Ecosystem Services was established to provide an interface between the scientific community and policy makers, and build capacity for and strengthen the use of ecosystem service science and assessments in policy making (www.ipbes.net/). National governments conducting assessments of biodiversity and ecosystem services (BES)—such as those in China, Mexico and the UK—are breaking new ground in developing approaches that work with available data, and identifying reporting indicators and other ways of communicating their findings to the public (Bateman et al., 2013; CONABIO, 2006; Daily et al., 2013; Ehrlich et al., 2012; UK NEA, 2011).
0921-8009/$ – see front matter © 2013 The Authors. Published by Elsevier B.V. All rights reserved. http://dx.doi.org/10.1016/j.ecolecon.2013.07.009
Please cite this article as: Ruckelshaus, M., et al., Notes from the field: Lessons learned from using ecosystem service approaches to inform realworld decisions, Ecological Economics (2013), http://dx.doi.org/10.1016/j.ecolecon.2013.07.009
2
M. Ruckelshaus et al. / Ecological Economics xxx (2013) xxx–xxx
On-going efforts at regional scales include those following on the sub-global assessments of the Millennium Ecosystem Assessment (Capistrano, 2005; Daily et al., 2013; Sub-global Assessment Network, 2012), and to include ecosystem services in development policies and project evaluations (Goldman et al., 2008; McKenzie et al., 2011). Such information has the potential to be helpful in a host of public-sector management and policy decisions, such as land- and water-use planning; coastal zone and marine management; regulation and permitting processes for extractive uses such as timber, fisheries, and mining; and hazard mitigation and adaptation planning, to name a few. In addition, non-governmental organizations and development banks (e.g. World Wildlife Fund (WWF), The Nature Conservancy (TNC), the World Resources Institute, Conservation International, the World Bank, InterAmerican Development Bank) are working to incorporate ecosystem services into their missions, strategies and work plans. Finally, an increasing number of businesses recognize that natural capital underpins sustainable business practices to satisfy consumer demands, secure supply chains for long-term business success, operations and risk management, and protect local communities in which companies operate (CEF and TNC, 2012; Hanson et al., 2008; Natural Capital Declaration, 2012; WBCSD, 2011). Examples of businesses taking an active interest in ecosystem services include Dow Chemical, The Coca-Cola Company, and Unilever, among others. The promise that BES assessments will change policy, management, or practice for public or private sector enterprises is not yet proven (Goldman et al., 2008; Laurans et al, 2013). Most previous applications of BES information have focused on securing single ecosystem services (e.g., fisheries, water quality and quantity) through payments, management or regulatory changes (EPA, 2009; NRC, 2005; TEEB, 2010). In spite of individual triumphs, the pace at which the theory of ecosystem service valuation is being incorporated into real decisions has been painstakingly slow, with disappointingly few success stories (Kushner et al, 2012). Indeed, little evidence has yet been offered that BES finance and policy mechanisms can be effectively replicated and scaled to yield desired outcomes. The Natural Capital Project (NatCap) was formed in 2006 under the premise that BES information can be used to inform decisions and improve the wellbeing of both people and nature. NatCap's primary goal is to transform decisions affecting the environment and human well-being by providing clear and credible ecosystem service information for decision makers. To support our work, we are developing and testing a set of standardized BES assessment tools, available in an opensource software platform: InVEST (Integrated Valuation of Ecosystem Services and Tradeoffs). InVEST is a set of models spanning terrestrial, freshwater, and marine environments, that use production functions to estimate changes in biodiversity and ecosystem services under different demographic, land-use, and climate scenarios (Arkema et al., 2013; Guerry et al, 2012; Kareiva et al., 2011; Nelson et al., 2009; Tallis and Polasky, 2009; Tallis et al., 2013). While InVEST provides a basic template designed to be used anywhere, our approach in specific cases is to co-develop applications with decision makers to ensure that inputs are tailored to local needs and data availability and that output metrics and knowledge production processes are deemed credible, relevant and legitimate by stakeholders (Cash et al., 2003; Cowling et al., 2008). We have selected decision contexts carefully. Transforming natural resource decisions requires not only credible information, but also specific enabling conditions and institutional capacity (Kahneman, 1980; Ostrom, 2005; Salzman, 2005). We select places and decision contexts to test our approach where the chances of early success and replication are high (because of strong leadership and partners; clearly defined authorities or decision-making pathways; and demonstrated interest in using ecosystem service information in decisions). In some decision contexts—such as spatial planning—the challenges with implementation are high because of many-layered authorities and interests; but the promise is also high for replicating compelling examples because of the widespread use of such planning around the world.
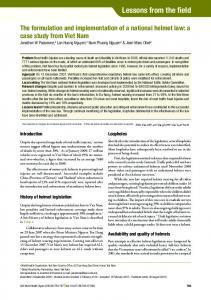
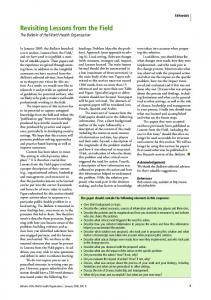
Literature and tools describing the value of BES information in realworld decisions are largely hypothetical treatments, or are based on general principles or guidelines (e.g., Hanson et al., 2008; McKenzie et al., 2011; TEEB, 2010; WBCSD, 2011). A recent review by Laurans et al. (2013) highlights how rarely the literature assesses whether BES information is used effectively in decisions, even when ‘use’ is an important research objective. We have applied, tested and refined our conceptual framework, approaches and InVEST models in a sufficient number of decision contexts, and over a long enough time period to begin to assess whether, and how, they influence decisions. The examples to date include a wide range of circumstances and ways to create change in decisions. The outcomes have also varied in terms of their success. While our simple approaches and models can work in a diverse array of decision contexts, we have also learned some of the limitations of such approaches and the kinds of questions for which simple models are not sufficient to provide information requested for informing decisions. Our aims in this paper are to offer a framework for considering how such information can inform decisions, illustrate its use to describe progress in the influence of BES values in several decision contexts, and qualitatively assess the strengths and weaknesses of this framework to date. We evaluate quantitatively the effects of BES information on decisions in just one case here for illustrative purposes, and to motivate future work assessing impact by our team and others in this field. First we define what we mean by ‘success’ in using BES information, and briefly describe the diverse decision contexts in which we are testing our approach. We then delve into a specific test case to illustrate how we work and what we are learning; and close by distilling general lessons and challenges from over 20 demonstration cases in which NatCap has engaged around the world. 2. A diversity of successes There are many specific, measurable ways to advance beyond aspirations and account for biodiversity and ecosystem services (BES) in decisions. Because it may take months to years to decades for a policy window to open that enables new technical information to influence real decisions (Kingdon, 1995), we have identified several success points along which we can track change before the ultimate goals of policy shifts and improvement in BES and human wellbeing are achieved. This approach fits with previous findings in the knowledge utilization literature: information most often has indirect influence on the long-term development of policy via impacts on who participates actively in discussions, how negotiations about an issue are framed, what goals, options, and technical knowledge are emphasized, and the visibility of a particular issue relative to others (Mitchell et al., 2006; Weiss, 1977). Fig. 1 represents a framework for detailing the ways through which BES information can successfully inform decisions and create change. The stages are based in part on the literature on joint knowledge production, knowledge utilization, and public policy, and in part on our observations and experience working in over 20 countries. Each of the four columns represents a different ‘pathway’ constituting some form of success in incorporating BES information into decisions and outcomes. Deeper impact is achieved as the process evolves from top to bottom down each pathway, and from left to right between the four pathways. Our hypothesis is that each science-policy engagement will traverse these pathways to a different extent, and the stages can be used to track progress that is not always linear. In some cases, interaction among pathways allows progress to build on work sequentially along them. Pathway 1 represents a process in which scientists, local experts, stakeholders and decision makers jointly provide data and information, produce, analyze, and disseminate results, akin to joint knowledge production (Andrews, 2002; Karl et al., 2007). Indicators of change here are relatively simple, including number of publications or communications
Please cite this article as: Ruckelshaus, M., et al., Notes from the field: Lessons learned from using ecosystem service approaches to inform realworld decisions, Ecological Economics (2013), http://dx.doi.org/10.1016/j.ecolecon.2013.07.009
M. Ruckelshaus et al. / Ecological Economics xxx (2013) xxx–xxx
PATHWAY 1: Conduct Research
PATHWAY 2: Change Perspectives
PATHWAY 3: Generate Action
Results Produced
People aware of, understand and discuss BES
Alternative choices based on BES framework
Stakeholders articulate different BES positions
Plans & policies consider BES impacts
Published
PATHWAY 4: Produce Outcomes
Enhanced & balanced BES provision
Improved outcomes for BES & human wellbeing
Disseminated Stakeholder differences made transparent and are mediated
3
New policy and finance mechanisms established
Increasing impact Fig. 1. Pathways for and levels of impact of BES information on decisions. Each of the four columns represents a different ‘pathway’ that could constitute a level of success in informing decisions. Deeper impact is achieved as the process evolves from top to bottom down each pathway, and left to right between the four pathways. Pathway 1 represents the creation of BES outputs and research results that are published and disseminated. Pathway 2 represents impacts of BES information on the attitudes, beliefs, awareness and understanding of stakeholders and decision-makers. Pathway 3 represents the influence of BES information on specific actions and the behavior of decision-makers, which may constitute commitments, procedural change, or a specific decision about funding, continuing, amending, terminating or expanding a project, program or policy. Pathway 4 represents specific outcomes in terms of developing new policy or finance mechanisms, and making measurable improvements in ecosystem service provision, biodiversity and human wellbeing.
on new knowledge and ways in which the new BES information is disseminated. Progress on Pathway 1 may catalyze impact on Pathway 2 as research builds new knowledge, understanding and awareness of BES among stakeholders and decision makers; shaping the way people think about and interact around BES issues, akin to ‘conceptual’ or ‘enlightenment’ use in the knowledge utilization literature (Weiss, 1977). Measures of change in stakeholder perspectives can come from documented shifts in written or oral language and the ways in which objectives or positions are articulated (e.g., Gregory et al., 1993; Rossi et al., 2003; Reynolds et al., 2010). Strides along Pathway 2 may lead to impact on Pathway 3 as new ways of thinking about BES lead stakeholders and decision makers to make different choices and design new policy mechanisms, considering BES impacts and tradeoffs explicitly in decisions about investments, policy, or planning processes, akin to ‘instrumental’ use (Weiss, 1979). Documented changes in BES consideration in plans or policies, or the emergence of new policy and finance mechanisms, are examples of useful metrics of tracking progress along Pathway 3. Advances along Pathway 3 in turn may lead to impact on Pathway 4 as implementation of new BES policy and finance mechanisms can lead to improved outcomes for ecosystem services, biodiversity and/or human wellbeing. Indicators of the ultimate impacts in Pathway 4 are standard BES metrics (e.g., Cardinale et al., 2012) and measures of human health, livelihoods, income, and other dimensions of wellbeing (e.g., Dasgupta, 2001; UNDP, 2013). The pathways framework thus approximates our ‘theory of change’ for the links between: 1) specific inputs and activities (joint production of BES information using simple tools in an iterative, interactive science-policy process); 2) intermediate outcomes in terms of shifting perspectives, generating awareness and buy-in; and 3) penultimate outcomes in terms of integrating the values of nature into specific policies, plans and projects. 3. A diversity of decisions The framework in Fig. 1 can be used to guide testing in qualitative or quantitative ways whether and how progress along these pathways
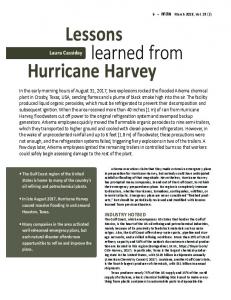
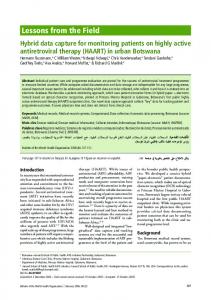
ultimately leads to improved states of biodiversity and human wellbeing. As a first step towards evaluating impact of BES information on decisions, we briefly summarize in a narrative form these pathways of change in a diversity of decision contexts in which the Natural Capital Project is applying and testing the notion that knowledge about BES values can change policy and management (Table 1; Appendix Table 1A). Appendix Table 1A provides the rationale for reported change along each impact pathway summarized in Table 1. Our demonstration sites span Africa, the Americas, Asia, and the Pacific, and involve partnerships with public- and private-sector decision-makers in terrestrial, freshwater and marine settings (Fig. 2). The generalized decision contexts in which we are applying BES analyses include: spatial planning, design of payments for ecosystem services (PES); development impacts and permitting; hazard mitigation and adaptation to climate change; restoration planning; and corporate risk management (Table 1, Appendix Table 1A, & Fig. 2). Each engagement has its own unique set of biophysical, social, economic, institutional, and political circumstances, but there are similarities across these cases and broad lessons that emerge. In general, BES information is more readily incorporated into decision contexts where models appropriate for the ES of interest already have been developed and where the decision process itself is well defined. Decision makers in spatial planning processes and PES schemes in Latin American water funds were among our first partners in developing our approach and testing the InVEST tools. Consequently, our models have been iteratively applied in several of these contexts, with clear impacts of BES information on spatial plans, PES decisions, and actions (Table 1, Appendix Table 1A; Daily et al., 2012; GoldmanBenner et al., 2012; Goldstein et al., 2012). BES information has penetrated deeply—to Pathway 4—within relatively short-term engagements over 1–2 years—such as developing a coastal zone management plan in Belize—because of the well-defined and executed planning process carried out by our government partners (CZMAI, 2012). As we elaborate in the Colombia case and general lessons below, challenges arise in spatial planning and PES design when defining alternatives for analysis (scenarios), interpreting results in multiple BES
Please cite this article as: Ruckelshaus, M., et al., Notes from the field: Lessons learned from using ecosystem service approaches to inform realworld decisions, Ecological Economics (2013), http://dx.doi.org/10.1016/j.ecolecon.2013.07.009
4
M. Ruckelshaus et al. / Ecological Economics xxx (2013) xxx–xxx
Table 1 Decision and geographic contexts where ecosystem service information generated by InVEST models is being used. Impact levels are described in the Diversity of successes section of the text. Dark gray boxes indicate evidence of impact at that level, light gray boxes indicate work towards impact at that level. The ‘To scale’ column is light gray if the Natural Capital Project or our partners are actively working to scale up from the individual case to other political contexts, and dark gray if there is evidence of impact going to scale. See Table 1A in online Supporting materials for more detailed information about each context and location.
Context
Location
Decision makers
Sumatra, Indonesia
Government
Belize
Government
Oahu, Hawaii
Government
Vancouver Island, Canada
Government, Private
Baoxing Country, China
Government
Upper Yangtze Basin, China
Government
Hainan Island, China
Government
Kalimantan, Indonesia
Government
Department of Defense: WA, VA, GA
Government
Puget Sound, Washington
Government
Cauca Valley, Colombia
Government, Private, NGO
Medellin, Colombia
Government, Private, NGO
Amazon, Brazil
Government, Private, NGO
Eastern Arc Mountains, Tanzania
Government
Beijing, China
Government
Putumayo region, Colombia
Government
Monterey & Santa Cruz Country, CA
Government
Galveston Bay, Texas
Government
Cesar Department, Colombia
Government
Virungas: DRC, Uganda and Rwanda
Government
Restoration planning
Mobile Bay, Alabama
NGO
Corporate risk management
Freeport, Texas
private
Spatial planning
PES design
Climate adaptation & Hazard mitigation
Development impacts & permitting
Impact level 1
2
3
4
To scale
metrics, and moving to the final pathway where management plans drive specific actions with measurable outcomes for people and the environment (Appendix Table 1A). Implementing spatial planning is challenging in many places. This has been the case in Indonesia where local government autonomy is high relative to the central government
and incentives strongly favor commercial revenue-generating activities such as palm oil production (Bardhan and Mookherjee, 2006; Tomich et al., 2001). Furthermore, adding BES information to newer decision contexts that have no precedent—such as marine spatial planning in Vancouver Island, British Columbia—is challenging because of novelty in both the decision process and the science to support it. Chances of success are likely stronger in cases like Belize (see Lesson 1. Include BES information as part of an iterative science-policy process), where a government agency is charged with developing the marine spatial plan and implementation is the responsibility of several agencies already vested with necessary authorities (Mitchell et al., 2006). Note that none of the 10 spatial planning cases in which we have engaged (Table 1) have achieved success in the final pathway to date. We are hopeful that many of them ultimately will, but there are significant time lags between multi-sector planning processes and measurable change on the ground, so only time will tell. Permitting decisions made by governments typically involve an impact assessment and an estimate of whether and how impacts of an activity can be mitigated. Including BES information in these welldefined decision processes is just beginning (Geneletti, 2011; Landsberg et al., 2011). In our first applications (mining in Colombia, Strategic Environmental Assessments in Sumatra and the Greater Virungas landscape in Central Africa), BES information is beginning to influence impact, permitting and mitigation assessments (Table 1, Appendix Table 1A). For example, in Colombia, The Natural Capital Project and collaborators from The Nature Conservancy (TNC) are building off of an initial analysis for mining concessions (Tallis and Wolny, 2010) and are working with the national government's Ministry of the Environment to develop a standardized BES tool to inform all of their impact assessment and permitting decisions on land and in the ocean. In central Africa, BES information was used in early stages of the Strategic Environmental Assessment required to assess the potential impacts of oil exploration in the Virungas National Park. There is great promise for broad replication in this decision context because over 190 governments apply standard approaches (Madsen et al., 2010) or processes in their permitting decisions (e.g., Strategic Environmental Assessment, Environmental Impact Assessment). Furthermore, efforts have begun for setting standards in the private lending sector with similar requirements to those in government (IFC, 2012). Similarly, including BES information in restoration planning has great potential. In our first test in a restoration-planning context (oyster reefs in the Gulf of Mexico), BES information proceeded in less than a year from results to action (Table 1, Appendix Table 1A) because basic models in our tools could be adapted to address specific needs, our TNC and local partners had a sophisticated understanding of the issues, objectives were straightforward, and there was a relatively simple and well-defined decision process for oyster reef siting and design. Incorporating climate change into planning for hazard mitigation is a relatively new enterprise for governments and the private sector. Although innovative methodologies are emerging (e.g., Jones et al., 2012; Shepard et al., 2011), it is not yet common practice to include the role of ecosystems in models assessing vulnerability or in designing alternative approaches to reduce risk to people, property, or infrastructure. We have developed simple coastal vulnerability and protection models to support these decisions (Arkema et al., 2013; Guerry et al., 2012; Tallis et al., 2013), and are working with governments and the private sector to produce relevant metrics at appropriate scales. Both private and public sector leaders increasingly are interested in incorporating such risk planning into practice (Table 1 and Table 1A in Appendix). For all of the decision contexts in which we have worked, our simple approach is not suited to answering questions about expected BES responses to human interventions over very small spatial scales. We elaborate on this and other limitations in the Colombia case and crosscutting lessons below.
Please cite this article as: Ruckelshaus, M., et al., Notes from the field: Lessons learned from using ecosystem service approaches to inform realworld decisions, Ecological Economics (2013), http://dx.doi.org/10.1016/j.ecolecon.2013.07.009
M. Ruckelshaus et al. / Ecological Economics xxx (2013) xxx–xxx
S
SS C
S Legend
P S
S
CR M
S
5
D P P
S P
D
P
S S
S–Spatial Planning P–Payment for Ecosystem Services (PES) C–Climate Adaptation and Hazard Mitigation D–Development Impacts and Permitting R–Restoration Planning M–Corporate Risk Management
Fig. 2. Geographic locations of demonstration sites where an ecosystem-services approach has been applied and tested in specific decision contexts. Decision contexts are denoted by letters (S = spatial planning; P = design of payment for ecosystem services; D = development impacts & permitting; C = climate adaptation & hazard mitigation; R = restoration planning; and M = corporate risk management).
4. Illustrative findings in Colombia: Payments for watershed services In this section, we add color to one of the cases presented in Table 1 to illustrate how we are applying and testing the use of BES information in decisions. A new mechanism for protecting watershed services— called a water fund—is steadily gaining ground in Latin America. In the Andes region, a mix of high altitude wetlands (páramo) and forests provide valuable water supply regulation (Buytaert et al., 2007) and erosion and nutrient retention that improves water quality (White et al., 2009) to the millions of people in the mountains and interAndean valleys. Water funds are being developed as a means for water users to pay upstream land managers to improve watershed management as a way to regulate water flows and provide natural filtration for water quality (Goldman-Benner et al., 2012). These payments for watershed services are created by a group of users who pay into a trust and then collectively decide how to invest in watershed management changes they believe will meet their water-related objectives (Goldman-Benner et al., 2012). One such water fund, Water For Life and Sustainability, has been created in Cali, Colombia, with support from each watershed's local environmental authority, the Cauca Valley sugar cane producer's association (ASOCAÑA), a sugar cane grower's association (PROCAÑA), The Nature Conservancy, and Vallenpaz (a peace and justice organization). Their objective is to “maintain consistent water flows necessary for drinking water, biodiversity and agriculture through a coordinated strategy.” When we were introduced to the workings of the fund in 2008, stakeholders already were well aware of the benefits they receive from nature (Fig. 1, Pathway 2). They had already committed to investing in natural capital (Fig. 1, Pathway 3), but as with other payment for ecosystem service (PES) programs, were struggling with how to best target their investments. Some stakeholders had made ad hoc investments in protection and restoration (e.g. fencing, silvopastoral practices, revegetation) in the region over the preceding 20 years. As the fund was formalized and new partners joined, they needed to decide collectively where and in how much of each activity to invest to most efficiently meet their objectives.
We started our scientific engagement with stakeholders via introduction by TNC, who has long standing relationships in the area. This initial introduction revealed different objectives among stakeholders nested within the stated joint objective of the fund. Early in our engagement, we led a broad stakeholder discussion about where investments could be made in two exemplary watersheds of the fund. We then made coarse scenarios during the meeting to reflect these options and used InVEST models over the lunch break to estimate likely improvements in erosion control as one benefit of the set of proposed investments. We used dramatic alternatives, like restoring large areas stakeholders thought were important, and protecting large areas of intact habitat versus converting all those areas to pasture. These were meant to be illustrative scenarios, and they sparked interest in the potential of using a science-based approach. The next phase of the engagement was focused on how we could use modeling to design the ideal set of investments for the fund. Left to our own research devices, we would have turned to spatially explicit models of the processes underpinning each water fund objective to complete a full optimization analysis, including feasibility of landscape transitions and costs of implementation. Such an approach was not possible due to data and capacity limitations in most water fund areas. In addition, we found that there were no quantitative objectives related to specific ecosystem services that we could use to construct an optimization. For example, there is a broad objective to maintain consistent water supplies, but there is not a corresponding specific, agreed-upon volume of water supply desired by each user group. We also learned through these conversations that water quality, especially turbidity, is an important concern. But again, there is no explicit statement of what level of turbidity is desired or acceptable under the broad objectives of the fund. Lacking these two important components for optimization (resources/data and quantitative objectives), we developed ranking models that indicate where transition from the current landscape to a new condition via a specific activity is likely to give the largest relative returns for several of the water fund's objectives: terrestrial biodiversity, erosion control, and groundwater recharge. We also used a quantitative
Please cite this article as: Ruckelshaus, M., et al., Notes from the field: Lessons learned from using ecosystem service approaches to inform realworld decisions, Ecological Economics (2013), http://dx.doi.org/10.1016/j.ecolecon.2013.07.009
6
M. Ruckelshaus et al. / Ecological Economics xxx (2013) xxx–xxx
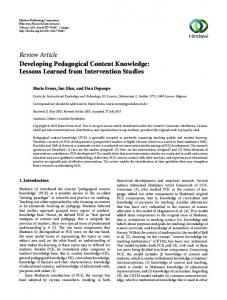
service estimation model for annual average water yield to indicate where investments will give the largest benefits in annual water supply (Kareiva et al., 2011; Tallis et al., 2013). Finally, we allocated a fixed budget among four watersheds based on area representation (e.g. a watershed with 50% of the total fund area got 50% of the total fund budget) and among activities based on the distribution of land uses in each watershed. Each budget was then allocated to the pixels ranked highest for BES provision in each watershed, using local cost data to track expenditures. Because we could not identify the amount of investment needed to reach specific quantitative goals, we instead chose five potential budget levels that bracketed the current (USD 3 million) and likely near-term future (USD 10 million) levels of investment. By choosing five budgets, we also hoped to find a budget level above which return on investment reached a plateau, signifying no further need for watershed investment. We presented the first “investment portfolios” with maps of where activities would likely provide the greatest returns in BES for a given budget level to the water fund stakeholders and experienced another misstep. Large areas where our biophysical models had indicated good possible returns in ecosystem service provision and biodiversity were inaccessible, controlled by guerilla groups. Although we had included some local knowledge on what kinds of investments would be feasible, we had not gone far enough. In a second round of portfolio development, stakeholders indicated on watershed maps those areas where they preferred to see investments in different activities, and where activities would not be possible. We included this additional local knowledge in our second round of portfolio identification, and delivered a set of maps more feasible for the fund's secretariat to implement. An example of a selected investment portfolio is shown for the Tulua watershed (Fig. 3A). This generated action (Fig. 1, Pathway 4) by the fund, which now mails the investment portfolio maps with requests for proposals to potential fund recipients. Over USD 800,000 has been invested in recommended portfolio areas to date. To answer the question of how much BES return to expect from the selected investment portfolios, we embedded each investment portfolio in the current land use/land cover map to create scenarios. Each scenario of possible future management was assessed for returns using two annual average ecosystem service models in InVEST; sediment retention and water yield (Kareiva et al., 2011; Tallis et al., 2013). It was not possible to calibrate these models, as no local data were available on sediment export rates or annual-river flows, so we reported all findings as relative biophysical changes. We found no resistance to, or confusion around the reporting of relative, biophysical estimates of return on investment. Although the InVEST models provide the option to take biophysical ecosystem service metrics to derive economic estimates of service value, we found it difficult to access economic data associated with ecosystem service values from some water users. These data are often not held centrally and in some cases are considered sensitive information by private sector investors. Estimated increases in sediment retention from the possible portfolios ranged from about 4% at the lowest budget to about 58% at the high end (average across four watersheds = 24%, example for one watershed in Fig. 3B). Because most activities that lead to erosion control increase vegetative cover, this reduction comes with a tradeoff in annual average water supply due to increased evapo-transpiration. However, at all budget levels, this tradeoff is negligible, with less than a 1% reduction in annual average water yield accompanying improvements in erosion control (Fig. 3B). Ideally, we would evaluate sub-annual water yield patterns, which are likely to show increased flow regulation and dry season flows (another water fund objective) with increased vegetation, but data limitations did not allow such an assessment. Once we showed stakeholders the results of this targeted approach, there was interest in understanding if, and how much this more dataand resource-intensive approach improved their projected returns over their previous investment approach. We used models to ask whether
Fig. 3. Results of water fund investment design in one of nine watersheds in the Water for Life and Sustainability Water Fund in the Cauca Valley, Colombia. Outputs of ranking models of likely ecosystem service change for multiple objectives were combined with stakeholder information on where investments were practical and economic data on activity costs and budget to create an investment portfolio (A). This portfolio reflects what the fund should invest in, and where, at a total fund level of $10 million. Estimated levels of annual average sediment retention increase with increasing budget levels in the same watershed (B, black squares), while annual average water yield decreases slightly (B, black circles). Sediment retention improvements from our targeted portfolio (solid black line) are about twice as high as those expected from random investments (gray dotted line).
our targeted approach can lead to greater improvements in ecosystem service delivery (Fig. 1, Pathway 5) before actions and monitoring programs were in place. This water fund and others have made investments in the past based on willingness of participants. To reflect this ‘business as usual’ approach, we kept the constraints on land use changes and stakeholder preferences in place as specified in the first round, then randomly selected portfolio sites, using the same cost data to track expenditures until each budget level was exhausted. We then embedded these more randomly selected portfolios in the current land use and land cover and assessed them with the InVEST models as above. InVEST models estimate ecosystem service delivery as the amount of good or service that actually flows to a beneficiary of interest, thus differentiating supply (all ecosystem processes and features) from service (that which is enjoyed by people). Compared to the more random approach, our targeted investment portfolios provided an estimated three-times-higher return on investment for sediment retention, on average across all watersheds and budget levels. An example of the difference in returns is shown for all budgets in the Desbaratado watershed (Fig. 3B). This very tangible estimate of ecosystem service change— economic return on investment for sediment retention service—is one indicator that can be modeled and measured in the future. TNC and others are beginning formal monitoring programs (Higgins and
Please cite this article as: Ruckelshaus, M., et al., Notes from the field: Lessons learned from using ecosystem service approaches to inform realworld decisions, Ecological Economics (2013), http://dx.doi.org/10.1016/j.ecolecon.2013.07.009
M. Ruckelshaus et al. / Ecological Economics xxx (2013) xxx–xxx
Zimmerling, 2013) to track changes in other elements of ecosystem service delivery and related components of biodiversity and human wellbeing resulting from the watershed investments, such as changes in habitat quality, species occurrence, household income and livelihood opportunities, that could accrue through the investments of the fund or their outcomes. Our engagement with the Water for Life and Sustainability water fund illustrates a common pattern in many of our projects. More often than not, stakeholders already have a general understanding or appreciation of BES values, but they lack spatially explicit information on their magnitude and how BES provision and value might change under policy interventions. Because the decision processes we enter often are iterative and ongoing, the BES analyses we provide facilitate impact along the pathways in Fig. 1 by improving the specificity of scientific information. As scientists, we lament the significant gaps in the science we are able to deliver to inform investment priorities. For example, in the water fund case, because of limitations in data or local capacity, we were unable to provide calibrated model results, sub-annual water flow analyses, or tests of whether modeled effects of restoration and protection activities are realized. Nevertheless, the water fund secretariats were guiding investments in watershed activities before we entered the collaboration, and are now incorporating the new BES information we generated into their priorities. Monitoring water quality outcomes and using the best available information to target ongoing investments allow them to keep moving, in spite of the ongoing uncertainties in the BES and human wellbeing outcomes they seek. One of the greatest challenges is in replicating and scaling up models of success. For water funds, we are testing the potential for site-based approaches to yield generalized standards of practice. The Nature Conservancy, FEMSA, the Inter-American Development Bank and the World Bank's Global Environment Facility have created the Latin America Water Funds Platform. Its intent is to develop over 30 new water funds by 2016. We have worked with the Platform to translate our science, and lessons from other water funds, into a new decision support tool called RIOS (Resource Investment Optimization System) (Vogl et al., 2013), which will be applied in all of the newly developing funds. At the same time as the Platform is rapidly expanding the influence of water funds in the region, rigorous monitoring programs are being installed to test the effectiveness of water fund investments in recovering BES and human wellbeing benefits. In the coming years, we will have clearer answers as to whether our efforts in the Cauca Valley and now across Latin America have created useful science, tools, and approaches to inform decisions and whether those decisions do indeed create improved conditions for people and nature (Fig. 1, Pathway 5). For now, those questions of ultimate impact remain unanswered. 5. Cross-cutting lessons Based on our experience in over 20 demonstrations around the world, we reflect below on 6 emerging lessons about the kinds of products and processes that are leading to progress in informing decisions, and remaining challenges posed to further advancing BES information into practice. 5.1. Lesson 1. Include BES information as part of an iterative science-policy process In our experience, the process in which BES information is embedded to engage decision makers and stakeholders is at least as important as the scientific tools and outputs. An iterative and interactive approach to define when and what kind of BES information is needed is critical to create useful, credible science and change in a decision process and outcomes. The iterative nature of developing alternative scenarios, amassing inputs for assessment tools, interpreting early results and repeating as needed is invaluable for building trust among scientists, stakeholders and decision makers; creating a mutual understanding of
7
the problem and how to use outputs to inform decisions (Fig. 1, Pathways 2–3); and providing a structured, facilitated process for repeated input and negotiation that leads to agreement on a specific policy or plan (Fig. 1, Pathway 3). An interactive science-policy process—meaningfully involving scientists, local experts, stakeholders and decision makers to produce results (Fig. 1, Pathway 1)—enhances the credibility, salience and legitimacy of BES information, increasing likelihood of use (Andrews, 2002; Cash et al., 2003; Cowling et al., 2008; Karl et al, 2007). Working to inform spatial planning in Belize (Appendix Table 1A) highlighted the importance of this iterative science-policy process. In 2010, Belize's Coastal Zone Management Authority and Institute (CZMAI) began partnering with NatCap and WWF to support their effort to create a national coastal zone management plan. NatCap and CZMAI worked together to collate existing information about habitat distribution and current and potential uses of Belize's coastal and marine areas. Without this collaboration, NatCap scientists would have missed critical local knowledge. A second key step was to co-develop alternative zoning schemes, producing scenarios that were salient to local stakeholders and that had the detail needed to provide inputs to InVEST models for exploration of likely BES outcomes. One alternative scenario—honed through several iterations by examining InVEST outputs—now serves as the cornerstone of the national Coastal Zone Management Plan that is under public review and soon expected to be signed into law. Without close collaboration between CZMAI, NatCap, and WWF, CZMAI would have had significantly less scientific capacity to inform their planning process, and NatCap would have conducted an academic exercise that would have been unlikely to find its way into the planning process. Because we participated in an iterative science-policy process, we were able to proceed through Pathways 1–4 (Fig. 1). The plan is not yet implemented, thus we do not yet have evidence of it guiding specific activities on-the-ground or changing the delivery of ecosystem services or human wellbeing (Fig. 1, Pathway 5). A downside of iterative science-policy processes is that they are time consuming. To support spatial planning in Sumatra (Appendix Table 1A), the iterative scoping, data compilation and analysis took over 2 years, which meant that final results were not available at the time that some of the district governments were developing their spatial plans. Scoping the schedule of ecosystem service assessments, and resourcing them appropriately, is critical to align with the timelines of policy decisions. The long time-scale of successful implementation can also be a barrier for academics who may need timely publications or NGOs who may need to demonstrate progress to donors. Success in a science-policy process demands sufficient capacity in both scientific and policy staff. In order for new scientific information to result in substantive change in policy or management, it is also critical that clear mechanisms exist for change. Whether a government, company, or NGO can implement change depends in part on whether effective policy or management levers exist to respond to new information, and the nature of accountability mechanisms for implementation. For example, shifts in investment policies in response to new BES information (e.g., Millennium Challenge Corporation targeting a diversity of BES in Indonesia—see Lesson 5; water fund secretariats) can be faster and easier to track accountability than are implementation of spatial plans requiring coordination among several levels of government and public–private stakeholder group support (e.g., in British Columbia, Sumatra, and China). 5.2. Lesson 2. Keep it simple for now No matter how much interdisciplinary scientists think they are oversimplifying biophysical or socio-economic processes, decision-makers typically ask for simpler, easy-to-use and understandable decision support tools that can be readily incorporated into science-policy processes. In our experience, even simple tools are plenty complicated for parameterizing and interpreting at early stages of applying BES information.
Please cite this article as: Ruckelshaus, M., et al., Notes from the field: Lessons learned from using ecosystem service approaches to inform realworld decisions, Ecological Economics (2013), http://dx.doi.org/10.1016/j.ecolecon.2013.07.009
8
M. Ruckelshaus et al. / Ecological Economics xxx (2013) xxx–xxx
There is, however, a floor for how simple the approach can be. To be useful for most decisions, tools must have the ability to estimate how changes in decisions lead to changes in BES and their values in terms of human well-being and nature. Static estimates of value, such as those based on areas of land cover types and benefits transfer methods do not suffice (Plummer, 2009). We have found that decision-makers are often best served by relatively simple models, provided they are clearly documented, published, and validation tests reveal limitations (e.g., Arkema et al., 2013; Johnson et al., 2012; Kareiva et al., 2011; Kim et al., 2012; Tallis et al., 2013; Terrado et al., 2013; Wood et al., in review). In the first years of NatCap, we discussed creating a tiered modeling approach with the simplest Tier 1 models providing mostly annual average outputs for single services, with no consideration of interactions among services or feedbacks. We started at this level of complexity and imagined later developing Tier 2 models that reflected daily time steps, allowed multi-service interaction and feedbacks and better reflected the complex interactions of socialecological systems. Although we have implemented some of these complexities in our suite of service models, our experience engaging in real-world decision contexts has shifted our focus to the development of even simpler ‘Tier 0’ models that produce relative ranking outputs, to meet demand from decision-makers. In our spatial planning engagement on the West Coast of Vancouver Island (Appendix Table 1A), for example, we initially began with a process-based model for exploring how a specific habitat in a particular location provides protection from erosion and flooding (with quantitative outputs estimating area eroded or flooded). But we quickly found that the protective services provided by coastal habitats such as eelgrass, dunes and marshes were not initially on the radar of local stakeholders and that results from this process-based model would not resonate. What decision-makers needed first was a simple screening tool to rank and highlight areas most vulnerable to coastal hazards under different scenarios of habitat presence (Arkema et al., 2013). Once we mapped the relative importance of protective role of natural habitats, many stakeholders were then interested in further modeling of vulnerable areas to understand the protective services and values of particular habitats. Thus, on Vancouver Island, and many other instances, even simple average annual or ranked outputs from BES models can help open discussions about what are often unfamiliar issues and ways to frame policy or management objectives (i.e. Pathway 2, Fig. 1). Especially in areas where local technical capacity is limited, providing simple tools to explore interactions, trade-offs, or win–win opportunities among objectives can lead to breakthroughs in returns on investments, such as what we saw in the water fund prioritizations. Furthermore, simple and transparent tools with a low barrier to entry can enable stakeholders with limited scientific capacity to actively engage in a deliberative decision making process. We still see a major role for more complex models when data and capacity allow, and expect this role to expand, but we have been surprised to learn the value and demand for robust, simple models to inform decisions in this relatively young field of practice. 5.3. Lesson 3. Empower local experts with technical tools for on-going learning We have found that our simple, open-source tool helps facilitate an iterative process because local experts can be trained to use InVEST and take authorship and ownership of on-going technical support needs. Where local scientists are able to take leadership of gathering inputs and interpreting and translating outputs, the credibility of the BES information provided to decision makers is greatly enhanced, increasing the likelihood that results (Fig. 1, Pathway 1) actually change perspectives (Fig. 1, Pathway 2) and generate action (Fig. 1, Pathway 3). Local experts also have much deeper understanding of biophysical and socio-economic conditions, and relationships with decision-makers,
and can bring this insight into the modeling, which ensures that analyses are relevant and sensitive to local issues (Cash et al., 2003). This local leadership is key to sustaining the influence of BES information in ultimate outcomes for human wellbeing and the environment (Fig. 1, Pathway 4). In places where local partners have training in our tools (e.g., for water funds in Latin America, marine spatial planning on Vancouver Island and in Belize, and for ecological zoning and PES schemes in China—see Table 1 and Appendix Table 1A for other examples), an ecosystem services approach is spreading quickly, and BES information is more rapidly being adopted in policy. For example, collaborators in China have been especially active and innovative in training new users in BES modeling tools. For the national ecosystem services assessment, the Chinese Academy of Sciences and Ministry of Environment trained over 200 people spanning 18 key state laboratories in InVEST. The number of applications, and improvements to pre- and post-processing methods, are growing rapidly throughout the country (most publications are in Chinese, e.g., Daily et al., 2013). In some places in which we have worked, there simply are not many resident scientists, and thus our ability to build local technical expertise has been limited (e.g., Virungas region in Africa). In those instances, NGO staff based in country interact with governments (see Appendix Table 1A). Research on joint fact finding (Andrews, 2002; Karl et al., 2007) suggests that generating assessments with more participation and leadership by local governments and universities, particularly early on in the analysis, can create more buy-in and ownership of the results so that policy change occurs more broadly. Local scientists ultimately are best equipped to make adjustments and improvements, and carry the work forward, and often in more interesting and promising directions than outsiders.
5.4. Lesson 4. It's not always about the money An ecosystem services approach to supporting decisions is not always and only about ascribing monetary values to environmental benefits. Having the ability to follow biophysical ecosystem service estimates through to economic values has proven to be an important conceptual advance that has opened many decision makers to discussions they previously did not consider. However, actually using the valuation models and providing estimates of monetary benefits has been less important than we anticipated. The widespread misconception that ecosystem service assessment requires economic valuation is an unnecessary barrier for both the science development side (e.g., for those who imagine their work is not relevant if they are not interested in formal monetary valuation) and on the practitioner side (e.g., for those who believe that an ecosystem services approach excludes considering the value of biodiversity for its own sake). In many of our demonstrations, decision makers are interested in examining the consequences of their actions for traditional market commodities in monetary terms along with a host of non-market benefits, typically in biophysical units, and including cultural values, and biodiversity. Conceptually, considering values of biodiversity for its own sake, in addition to ecosystem services, is completely consistent with an ecosystem services approach (Reyers et al., 2012; Satz et al., 2013). In many cases, stakeholders have expressly asked that we not attach monetary value to key benefits, such as existence value of orangutans or sacred places. Often what decision-makers want is to understand how alternative decisions might affect where BES benefits are supplied and to whom they are delivered. One way in which we have captured the ‘priceless’ values ascribed to species or places is to consider such locations as immutable in our analyses of alternative scenarios (e.g., in Hawai'i case; references in Appendix Table 1A); in other cases, we express currencies as a mix of biophysical and economic metrics across services.
Please cite this article as: Ruckelshaus, M., et al., Notes from the field: Lessons learned from using ecosystem service approaches to inform realworld decisions, Ecological Economics (2013), http://dx.doi.org/10.1016/j.ecolecon.2013.07.009
M. Ruckelshaus et al. / Ecological Economics xxx (2013) xxx–xxx
On the West Coast of Vancouver Island (Appendix Table 1A), we found that ecosystem-service outputs were useful in very different currencies: from the net present value ($) of shellfish harvested, to the spatial extent of recreational float-homes (m2), to concentration (g/m3) of fecal coliform bacteria in the water (Guerry et al., 2012). Our partners did not want to express these values in one metric (e.g., $). Indeed, the ability to produce outputs in metrics that are commonly used by regulatory agencies (e.g. fecal coliform concentrations regulated by the Province of BC), are particularly powerful. This has given local stakeholders (such as the Tla-o-qui-aht First Nation) the power to engage government agencies in new and substantive ways. In other contexts, such as PES schemes, combining monetary values across multiple ecosystem services is most useful. Our Belizean collaborators in marine spatial planning were interested in both biophysical (e.g., pounds of lobster landed, amount of beach erosion, tourism visitation rates) and monetary metrics (i.e., lobster revenues, avoided damage costs from coastal storms, expenditures by tourists) for evaluating alternative scenarios. In general, decision makers are adept at considering ‘apples and oranges’ outputs and explicitly examining tradeoffs of benefits expressed in different units. What we have learned for producing relevant valuation outputs is just because one can calculate monetary metrics does not mean that one should or must do so in order to inform decisions.
5.5. Lesson 5. Relate biodiversity and ecosystem service change to livelihoods and other wellbeing metrics A corollary of the lesson above is a broader request to trace the consequences of ecosystem change through to human wellbeing outcomes. For example, in both developing and developed country contexts in which we are working, sustaining local jobs—beyond simple income tallies—is included in the list of desired objectives. Although some studies are beginning to illuminate how local livelihoods are affected by the condition of ecosystems and biodiversity (e.g., Ferraro et al., 2011; Fisher et al., 2011; Halpern et al., 2012; Li et al., 2011; Liang et al., 2012; Naidoo et al., 2011; Pattanayak et al., 2005), quantifying how changes in ecosystems and BES lead to changes in livelihoods is hard. This issue has come up in virtually all of our engagements. For example, in Sumatra, both the Indonesian government and the Millennium Challenge Corporation (MCC) mentioned linking BES changes to livelihood and income metrics as important to achieving their poverty alleviation objectives. The results from our BES modeling in Sumatra enabled district and provincial government representatives to identify and locate specific opportunities for implementing forest carbon, restoration and watershed management projects that could provide alternative sources of income (Bhagabati et al., 2012; Barano et al., 2010; Kementerian Dalam Negeri, 2011). The MCC recently signed a Compact Agreement with the Indonesian government worth $600 million, and after being presented with the results of our ecosystem service assessment in Central Sumatra, the MCC decided that their future investments should be guided by similar information to ensure that ecosystem services are sustained to support their development objectives.1 On Vancouver Island, a key human wellbeing concern is maintaining access of First Nation communities to culturally important shellfish harvest areas. We thus included metrics indicating which communities would have access to specific shellfish areas under alternative scenarios so that the stakeholders could include that objective (along with revenues and shellfish biomass harvested) in their deliberations. These topics remain an important gap that needs addressing through new methodology development and testing (e.g., as part of HEAL, a consortium to link ecosystem change with health outcomes: www.wcsheal.org). More work in this area is sorely needed to help guide policy and management interventions for livelihoods and human health. 1
Personal communication, Sergio Feld, MCC.
9
5.6. Lesson 6. Clearly and honestly report the degree of uncertainty Applications of models such as InVEST to assess BES require many assumptions, and outputs of such models typically have considerable uncertainty (Goldstein et al., 2012; Johnson et al., 2012; Kareiva et al., 2011). We need better ways to represent uncertainty visually in maps and other outputs, without detracting from the key findings of an analysis. In most of our demonstration engagements, we discuss the usefulness and limitations of our models; and the implications for decisions of what biophysical or social processes we can, and cannot represent. However, we still have far to go in developing quickly replicable uncertainty analyses of multiple services and useful representations of such analyses that can be understood in a decision context. The discussions we have about model limitations are useful for building mutual understanding and trust, but they are not as transparent as simple, rigorous depictions of the uncertainties in our estimates. Sensitivity and robustness analyses that demonstrate how results vary with model assumptions and parameter values should become a more routine part of BES assessments. Showing whether rankings of alternatives are affected by model assumptions and parameter values can also provide useful insights on the confidence that decision-makers have about the analysis (e.g., Johnson et al., 2012). Similarly, there is great scope for more rigorous policy assessments of what kind of BES information works, and what is not as influential, in affecting choice of actions and ultimately, outcomes for ecosystems and human wellbeing (e.g., Clark, 2007; Clark et al., 2002; Satz et al., 2013; Watson, 2005). Perhaps the biggest lessons we have learned in our applications of quantitative approaches around the world is the importance of building trust with decision makers; and having the patience to iteratively produce results, refine them with input from partners who will use them, and take the time to train local scientists to be credible collaborators as the science-policy processes continue. We see already that significant strides can be made in informing decisions using simple, quantitative spatial tools within a clear decision support process to help incorporate and interpret BES information. In summary, we see great potential for more widely incorporating BES information into a host of decision contexts, from spatial planning to permitting impact assessment to PES schemes. Decisions around climate adaptation planning and corporate risk management offer exciting new policy and business arenas with huge potential to influence investments and development across the globe. It is early days for implementation of BES information in real decisions, yet progress is tangible and encouraging. Continuing the momentum depends on iterative approaches to implementation of novel policy and finance mechanisms, perhaps more than science and tool needs. Thanks to a cadre of influential leaders in public and private institutions, the demand for continued good BES science incorporated into day-to-day policy processes should continue to grow. Supplementary data to this article can be found online at http://dx. doi.org/10.1016/j.ecolecon.2013.07.009. Acknowledgments We are indebted to our many colleagues in the Natural Capital Project and partners in our demonstrations around the world for helping us learn about putting ecosystem services into practice. The authors thank James Salzman for his inspired early note taking from the ‘field’ of applied ecosystem services. Silvia Benitez, Alejandro Calvache, Jorge Leon, Juan Sebastian Lozano, Aurelio Ramos, and Stacie Wolny were instrumental in ensuring the work in the Colombia case highlighted here was of highest quality. A host of equally insightful and industrious partners have allowed us to learn as we go in our other engagements, and are listed in Appendix Table 1A. Brad Eichelberger created Fig. 2. We are grateful for support from P Bing, H Bing, V Sant, R Sant, the Moore, Packard, Winslow, Summit, Google, Rockefeller, and MacArthur foundations, the National Science Foundation, the US Department of Defense, and NOAA.
Please cite this article as: Ruckelshaus, M., et al., Notes from the field: Lessons learned from using ecosystem service approaches to inform realworld decisions, Ecological Economics (2013), http://dx.doi.org/10.1016/j.ecolecon.2013.07.009
10
M. Ruckelshaus et al. / Ecological Economics xxx (2013) xxx–xxx
References Andrews, C.J., 2002. Humble Analysis: The Practice of Joint Fact-finding. Praeger Publishers, Westport, CT (216 pp.). Arkema, K.A., Guannel, G., Verutes, G., Wood, S.A., Guerry, A., Ruckelshaus, M., Kareiva, P., Lacayo, M., Silver, J.M., 2013. People and property shielded from sea level rise and storms by coastal habitats. Nature Climate Change. http://dx.doi.org/10.1038/ nclimate1944. Barano, T., McKenzie, E., Bhagabati, N., Conte, M., Ennaanay, D., Hadian, O., Olwero, N., Tallis, H., Wolny, S., Ng, G., 2010. Integrating ecosystem services into spatial planning in Sumatra, Indonesia. The Economics of Ecosystems and Biodiversity (TEEB) Case Study. (Available at www.teebweb.org). Bardhan, P., Mookherjee, D., 2006. Decentralization and Local Governance in Developing Countries: A Comparative Perspective. The MIT Press, Boston, MA (394 pp.). Bateman, I.J., Mace, G.M., Fezzi, C., Atkinson, G., Turner, K., 2011. Economic analysis for ecosystem service assessments. Environmental and Resource Economics 48, 177–218. Bateman, I.J., Harwood, A.R., Mace, G.M., Watson, R.T., Abson, D.J., Andrews, B., Binner, A., Crowe, A., Day, B.H., Dugdale, S., Fezzi, C., Foden, J., Hadley, D., Haines-Young, R., Hulme, M., Kontoleon, A., Lovett, A.A., Munday, P., Pascual, U., Paterson, J., Perino, G., Sen, A., Siriwardena, G., van Soest, D., Termansen, M., 2013. Bringing ecosystem services into economic decision-making: land use in the United Kingdom. Science 341, 45–50. http://dx.doi.org/10.1126/science.1234379. Bennett, E.M., Peterson, G.D., Gordon, L., 2009. Understanding relationships among multiple ecosystem services. Ecology Letters 12, 1394–1404. Bhagabati, N., Barano, T., Conte, M., Ennaanay, D., Hadian, O., McKenzie, E., Olwero, N., Rosenthal, A., Suparmoko, A., Shapiro, H. Tallis, Wolny, S., 2012. A Green Vision for Sumatra: Using Ecosystem Services Information to Make Recommendations for Sustainable Land Use Planning at the Province and District Level. Natural Capital Project, WWF-US and WWF-Indonesia, Washington D.C. Boyd, J., Banzhaf, S., 2007. What are ecosystem services? The need for standardized environmental accounting units. Ecological Economics 63, 616–626. Buytaert, W., Iñiguez, V., De Bièvre, B., 2007. The effects of afforestation and cultivation on water yield in the Andean páramo. Forest Ecology and Management 251, 22–30. Ecosystems and human wellbeing, volume 4. Multiscale assessments. In: Capistrano, D. (Ed.), Findings of the Sub-Global Assessments Working Group. Millennium Ecosystem Assessment. Island Press, Washington, D.C. (381 pp.). Cardinale, B.J., Duffy, J.E., Gonzalez, A., Hooper, D.U., Perrings, C., Venail, P., Narwani, A., Mace, G.M., Tilman, D., Wardle, D.A., Kinzig, A.P., Daily, G.C., Loreau, M., Grace, J.B., Larigauderie, A., Srivastava, D.S., Naeem, S., 2012. Biodiversity loss and its impact on humanity. Nature 486, 59–67. Cash, D.W., Clark, W.C., Alcock, F., Dickson, N.M., Eckley, N., Guston, D.H., Jage, J., Mitchell, R.B., 2003. Knowledge systems for sustainable development. Proceedings of the National Academy of Sciences 100 (14), 8086–8091. CEF (Corporate EcoForum) and The Nature Conservancy (TNC), 2012. The New Business Imperative: Valuing Natural Capital. Report available at: www.corporateecoforum. com/valuingnaturalcapital/offline/download.pdf. Clark, W.C., 2007. Sustainability science: a room of its own. Proceedings of the National Academy of Sciences 104 (6), 1737–1738. Clark, W.C., Mitchel, R., Cash, D., Alcock, F., 2002. Information as influence: how institutions mediate the impact of scientific assessments on global environmental affairs. Faculty Research Working Paper RWP02-044. Kennedy School of Government, Harvard University, Cambridge, MA (Available at: http://www.hks.harvard.edu/ centers/mrcbg/programs/sustsci/activities/program-initiatives/knowledge-systems/ environmental-assessment/documents). CONABIO, 2006. Capital Natural y Bienestar Social. Comision Nacional para el Conocimiento y Uso de la Biodiversidad, Mexico (Available at: www.conabio.gob. mx/2ep/images/3/37/capital_natural_2EP.pdf). Cowling, R.M., Egoh, B., Knight, A.T., O'Farrell, P.J., Reyers, B., Rouget, M., Roux, D.J., Welz, A., Wilhelm-Rechman, A., 2008. An operational model for mainstreaming ecosystem services for implementation. Proceedings of the National Academy of Sciences 105, 9483–9488. CZMAI (Coastal Zone Management Authority and Institute), 2012. Belize Integrated Coastal Zone Management Plan. CZMAI, Belize City. Daily, Gretchen (Ed.), 1997. Nature's Services. Island Press, Washington, DC (375 pp.). Daily, G.C., Tallis, H., Guerry, A., 2012. Investing in natural capital. In: Murray, J., Cawthorne, G., Dey, C., Andrew, C. (Eds.), Enough for All Forever: A Handbook for Learning about Sustainability. Common Ground Publishing LLC, Champaign, Illinois, pp. 105–119. Daily, G.C., Ouyang, Z., Zheng, H., Li, S., Wang, Y., Feldman, M., Kareiva, P., Polasky, S., Ruckelshaus, M., 2013. Securing natural capital and human well-being: Innovation and impact in China. Acta Ecologica Sinica 33, 669–676. Dasgupta, P., 2001. Human Well-being and the Natural Environment. Oxford University Press, Oxford, UK. Egoh, B., Reyers, B., Rouget, M., Richardson, D.M., Le Maitre, D.C., van Jaarsveld, A.S., 2008. Mapping ecosystem services for planning and management. Agriculture, Ecosystems and Environment 127, 135–140. Ehrlich, P.R., Mooney, H.A., 1983. Extinction, substitution, and ecosystem services. BioScience 33, 248–254. Ehrlich, P., Kareiva, P.M., Daily, G.C., 2012. Securing natural capital and expanding equity to rescale civilization. Nature 486, 68–73 (June 7, 2012). EPA (Environmental Protection Agency), 2009. Valuing the protection of ecological systems and services. A Report of the EPA Science Advisory Board (138 pp. available at: www.epa.gov/sab). Ferraro, P., Hanauera, M.M., Sims, K.R.E., 2011. Conditions associated with protected area success in conservation and poverty reduction. Proceedings of the National Academy of Sciences 108, 13913–13918.
Fisher, B., Turner, R. Kerry, Morling, P., 2009. Defining and classifying ecosystem services for decision making. Ecological Economics 68, 643–653. Fisher, B., Polasky, S., Sterner, T., 2011. Conservation and human welfare: economic analysis of ecosystem services. Environmental and Resource Economics 48, 151–159. Geneletti, D., 2011. Reasons and options for integrating ecosystem services in strategic environmental assessment of spatial planning. International Journal of Biodiversity Science, Ecosystem Services and Management 7, 143–149. Goldman, R.L., Tallis, H., Kareiva, P., Daily, G.C., 2008. Field evidence that ecosystem service projects support biodiversity and diversify options. Proceedings of the National Academy of Sciences 105, 9445–9448. Goldman-Benner, R.L., Benitez, S., Boucher, T., Calvache, A., Daily, G., Kareiva, P., Kroeger, T., Ramos, A., 2012. Water funds and payments for ecosystem services: practice learns from theory and theory can learn from practice. Oryx 46, 55–63. Goldstein, J.H., Caldarone, G., Duarte, T.K., Ennaanay, D., Hannahs, N., Mendoza, G., Polasky, S., Wolny, S., Daily, G.C., 2012. Integrating ecosystem-service tradeoffs into land-use decisions. Proceedings of the National Academy of Sciences 19, 7565–7570. Gregory, R., Lichtenstein, S., Slovic, P., 1993. Valuing environmental resources: a constructive approach. Journal of Risk and Uncertainty 7, 177–197. Guerry, A.D., Ruckelshaus, M.H., Arkema, K., Bernhardt, J.R., Guannel, G., Kim, C.K., Marsik, M., Papenfus, M., Toft, J.E., Verutes, G., Wood, S.A., Beck, M., Chan, F., Chan, K.M.A., Gelfenbaum, G., Gold, B.D., Halpern, B.S., Labiosa, W.B., Lester, S.E., Levin, P.S., McField, M., Pinsky, M.L., Plummer, M., Polasky, S., Ruggiero, P., Sutherland, D.A., Tallis, H., Day, A., Spencer, J., 2012. Modeling benefits from nature; using ecosystem services to inform coastal and marine spatial planning. International Journal of Biodiversity Science, Ecosystem Services and Management 8, 107–121. Halpern, B.S., Klein, C.J., Brown, C.J., Beger, M., Grantham, H.S., Mangubhai, S., Ruckelshaus, M., Tulloch, V.J., Watts, M., White, C., Possingham, H.P., 2012. Achieving the triple bottom line: inherent tradeoffs among social equity, economic return and conservation. Proceedings of the National Academy of Sciences. http://dx.doi.org/10.1073/pnas. 1217689110. Hanson, C., Finisdore, J., Ranganathan, J., Iceland, C., 2008. The Corporate Ecosystem Services Review: Guidelines for Identifying Business Risks & Opportunities Arising from Ecosystem Change. World Resources Institute, Washington, DC. Higgins, J., Zimmerling, A., 2013. A Primer for Monitoring Water Funds. The Nature Conservancy, Arlington, VA. International Finance Corporation (IFC), 2012. Performance Standards on Environmental and Social Sustainability. International Finance Corporation, Washington DC. Johnson, K.A., Polasky, S., Nelson, E., Pennington, D., 2012. Uncertainty in ecosystem services valuation and implications for assessing land use tradeoffs: an agricultural case study in the Minnesota River Basin. Ecological Economics 79, 71–79. Jones, H.P., Hole, D.G., Zavaleta, E.S., 2012. Harnessing nature to help people adapt to climate change. Nature Climate Change 2, 504–509. Kahneman, D., 1980. Human engineering of decisions. In: Kranzberg, M. (Ed.), Ethics in an Age of Pervasive Technology. Westview Press, Boulder, CO. Kareiva, P., Tallis, H., Ricketts, T., Daily, G., Polasky, S., 2011. Natural Capital: Theory and Practice of Mapping Ecosystem Services. Oxford University Press, Oxford. Karl, H.A., Susskind, L.E., Wallace, K.H., 2007. A dialogue, not a diatribe: effective integration of science and policy through joint fact finding. Environment: Science and Policy for Sustainable Development 49 (1), 20–34. Kementerian Dalam Negeri (Home Affairs Ministry), 2011. Penerapan KLHA RTRW Provinsi Jambi. Kementerian Dalam Negeri, Sumatra, Indonesia. Kim, C.-K., Toft, J.E., Papenfus, M., Verutes, G., Arkema, K., Bernhardt, J.R., Guannel, G., Guerry, A.D., Ruckelshaus, M.H., Tallis, H., Wood, S.A., Beck, M., Chan, F., Chan, K.M.A., Halpern, B.S., Labiosa, B., Levin, P.S., McField, M., Pinsky, M.L., Plummer, M., 2012. Catching the right wave: evaluating wave energy resources and potential conflicts with existing marine and coastal uses. PLoS One 7 (11), e47598. http:// dx.doi.org/10.1371/journal.pone.0047598. Kingdon, John W., 1995. Agendas, Alternatives and Public Policies. Addison Wesley Educational Publishers, Inc., United States. Kushner, B., Waite, R., Jungwiwattanaporn, M., Burke, L., 2012. Influence of Coastal Economic Valuations in the Caribbean: Enabling Conditions and Lessons Learned. Working Paper. World Resources Institute, Washington D.C. Landsberg, F., Ozment, S., Stickler, M., Henninger, N., Treweek, J., Venn, O., Mock, G., 2011. Ecosystem Services Review for Impact Assessment. Working Paper. World Resources Institute, Washington D.C. Laurans, Y., Rankovic, A., Billé, R., Pirard, R., Mermet, L., 2013. Use of ecosystem services economic valuation for decision making: questioning a literature blindspot. Journal of Environmental Management 119, 208–219. Li, Jie, Feldman, M.W., Li, Shuzhuo, Daily, G.C., 2011. Rural household income and inequality under the Sloping Land Conversion Program in western China. Proceedings of the National Academy of Sciences. http://dx.doi.org/10.1073/pnas.1101018108. Liang, Y., Li, Shuzhuo, Feldman, M.W., Daily, G.C., 2012. Does household composition matter? The impact of the Grain for Green Program on rural livelihoods in China. Ecological Economics 75, 152–160. MA (Millennium Ecosystem Assessment), 2005. Ecosystems and Human Well-being: The Assessment Series (Four Volumes and Summary). Island Press, Washington, DC. Mace, G., Norris, K., Fitter, A., 2012. Biodiversity and ecosystem services: a multilayered relationship. Trends in Ecology & Evolution 27 (1), 19–26. Madsen, B., Carroll, N., Moore Brands, K., 2010. State of Biodiversity Markets Report: Offset and Compensation Programs Worldwide. Ecosystem Marketplace, Washington DC. McKenzie, E., Irwin, F., Ranganathan, J., Hanson, C., Kousky, C., Bennett, K., Ruffo, S., Conte, M., Salzman, J., Paavola, J., 2011. Incorporating ecosystem services in decisions. In: Kareiva, P.M., Tallis, H., Ricketts, T., Daily, G.C., Polasky, S. (Eds.), Natural Capital: Theory and Practice of Mapping Ecosystem Services. Oxford University Press, Oxford, pp. 339–355.
Please cite this article as: Ruckelshaus, M., et al., Notes from the field: Lessons learned from using ecosystem service approaches to inform realworld decisions, Ecological Economics (2013), http://dx.doi.org/10.1016/j.ecolecon.2013.07.009
M. Ruckelshaus et al. / Ecological Economics xxx (2013) xxx–xxx Mitchell, R., Clark, W.C., Cash, D.W., 2006. Information and influence. In: Mitchell, R.B., Clark, W.C., Cash, D.W., Dickson, N.M. (Eds.), Global Environmental Assessments: Information, Institutions and Influence. MIT Press, Cambridge MA, pp. 307–338. Naidoo, R., Balmford, A., Costanza, R., Fisher, B., Green, R.E., Lehner, B., Malcolm, T.R., Ricketts, T.H., 2008. Global mapping of ecosystem services and conservation priorities. Proceedings of the National Academy of Sciences 105, 9495–9500. Naidoo, R., Weaver, L.C., Stuart-Hill, G., Tagg, J., 2011. Effect of biodiversity on economic benefits from communal lands in Namibia. Journal of Applied Ecology. http:// dx.doi.org/10.1111/j.1365-2664.2010.01955.x. National Research Council, N.R.C., 2005. Valuing Ecosystem Services: Toward Better Environmental Decision-making. National Academies Press, Washington DC. Natural Capital Declaration, 2012. Available at: www.naturalcapitaldeclaration.org/ thedeclaration/. Nelson, E., Mendoza, G., Regetz, J., Polasky, S., Tallis, H., Cameron, D.R., Chan, K.M., Daily, G.C., Goldstein, J., Kareiva, P.M., Lonsdorf, E., Naidoo, R., Ricketts, T.H., Shaw, R.M., 2009. Modeling multiple ecosystem services, biodiversity conservation, commodity production, and tradeoffs at landscape scales. Frontiers in Ecology and the Environment 7, 4–11. Ostrom, E., 2005. Understanding Institutional Diversity. Princeton University Press Princeton, NJ. Pattanayak, S.K., Yang, J.C., Whittington, D., Bal Kumar, K.C., 2005. Coping with unreliable public water supplies: averting expenditures by households in Kathmandu, Nepal. Water Resources Research 41, W02012. http://dx.doi.org/10.1029/2003WR002443. Plummer, M.L., 2009. Assessing benefit transfer for the valuation of ecosystem services. Frontiers in Ecology and the Environment 7, 38–45. Polasky, S., Nelson, E., Pennington, D., Johnson, K., 2011. The impact of land-use change on ecosystem services, biodiversity and returns to landowners: a case study in the state of Minnesota. Environmental and Resource Economics 48 (2), 219–242. Raudsepp-Hearne, C., Peterson, G., Bennett, E., 2010. Ecosystem service bundles for analyzing tradeoffs in diverse landscapes. Proceedings of the National Academy of Sciences 107, 5242–5247. Reyers, B., Polasky, S., Tallis, H., Mooney, H.A., Larigauderie, A., 2012. Finding common ground for biodiversity and ecosystem services. BioScience 62, 503–507. Reynolds, T.W., Bostrom, A., Read, D., Morgan, M.G., 2010. Now what do people know about global climate change? Survey studies of educated laypeople. Risk Analysis 30 (10), 1520–1538. Rossi, P.H., Lipsey, M.V., Freeman, H.E., 2003. Evaluation: A Systematic Approach. Sage Publications, Thousand Oaks, CA. Salzman, J., 2005. Creating markets for ecosystem services: notes from the field. New York University Law Review 80, 870–961. Satz, D., Gould, R.K., Chan, K.M.A., Guerry, A., Norton, B., Satterfield, T., Halpern, B.S., Levine, J., Woodside, U., Hannahs, N., Basurto, X., Klain, S., 2013. The challenges of incorporating cultural ecosystem services into environmental assessment. Ambio. http://dx.doi.org/10.1007/s13280-013-0386-6. Seppelt, R., Dormann, C.F., Eppink, F.V., Lautenback, S., Schmidt, S., 2011. A quantitative review of ecosystem service studies: approaches, shortcomings and the road ahead. Journal of Applied Ecology 48 (3), 630–636. Shepard, C., Agostini, V.N., Gilmer, B., Allen, T., Stone, J., Brooks, W., Beck, M.W., 2011. Assessing future risk: quantifying the effects of sea level rise on storm surge risk for the southern shores of Long Island New York. Natural Hazards 1–19.
11
Sub-global Assessment Network, 2012. http://www.ecosystemassessments.net/about. html. Tallis, H., Polasky, S., 2009. Mapping and valuing ecosystem services as an approach for conservation and natural resource management. Annals of the New York Academy of Sciences 1162, 265–283. Tallis, H., Polasky, S., 2011. Assessing multiple ecosystem services: an integrated tool for the real world. In: Kareiva, P., Tallis, H., Ricketts, T., Daily, G., Polasky, S. (Eds.), Natural Capital: Theory and Practice of Mapping Ecosystem Services. Oxford University Press, Oxford, pp. 34–50. Tallis, H., Wolny, S., 2010. Including ecosystem services in mitigation. Report to the Colombian Ministry of the Environment, Mines and Territorial Development.Natural Capital Project, Stanford. Tallis, H.T., Ricketts, T., Guerry, A.D., Wood, S.A., Sharp, R., Nelson, E., Ennaanay, D., Wolny, S., Olwero, N., Vigerstol, K., Pennington, D., Mendoza, G., Aukema, J., Foster, J., Forrest, J., Cameron, D., Arkema, K., Lonsdorf, E., Kennedy, C., Verutes, G., Kim, C.K., Guannel, G., Papenfus, M., Toft, J., Marsik, M., Bernhardt, J., Griffin, R., 2013. InVEST 2.5.3 User's Guide. The Natural Capital Project, Stanford (available at: http://ncp-dev.stanford. edu/~dataportal/invest-releases/documentation/current_release/). TEEB (The Economics of Ecosystems Biodiversity), 2010). The Economics of Ecosystems and Biodiversity Report for Business (TEEB). (Report available at: www.teebweb.org). Terrado, M., Acuna, V., Ennaanay, D., Tallis, H., Sabater, S., 2013. Impact of climate extremes on hydrological ecosystem services in a heavily humanized Mediterranean basin. Ecological Indicators. http://dx.doi.org/10.1016/j.ecolind.2013.01.016. Tomich, T.P., van Noordwijk, M., Budidarsono, S., Gillison, A., Kusumanto, T., Murdiyarso, D., Stolle, F., Fagi, A.M., 2001. Agricultural intensification, deforestation and the environment: assessing tradeoffs in Sumatra, Indonesia. In: Lee, D.R., Barrett, C.B. (Eds.), Tradeoffs and Synergies? Agricultural Intensification, Economic Development and the Environment. CABI Publishing, Wallingford, UK. UK National Ecosystem Assessment (UK NEA), 2011. The UK National Ecosystem Assessment: Synthesis of the Key Findings. UNEP-WCMC, Cambridge. United Nations Development Program (UNDP), 2013. Human Development Report 2013: The Rise of the South. Human Progress in a Diverse World. UNDP, New York. Vogl, A., Tallis, H., Douglass, J., Sharp, R., Veiga, F., Benitez, S., Leon, J., Game, E., Petry, P., Guimeraes, J., Lozano, J.S., 2013. Resource Investment Optimization System User's Guide. The Natural Capital Project, Stanford, CA. Watson, R.T., 2005. Turning science into policy: challenges and experiences from the science–policy interface. Philosophical Transactions of the Royal Society — Biological Sciences 360 (1454), 471–477. WBCSD (World Business Council on Sustainable Development), 2011. Guide to Corporate Ecosystem Valuation. (Report available at: www.wbcsd.org/DocRoot/ gslFp45ojmeO4e1QP2ZD/WBCSD_Guide_CEV_April_2011.pdf). Weiss, C., 1977. Research for policy's sake: the enlightenment function of social research. Policy Analysis 3 (4), 531–545. Weiss, C., 1979. The many meanings of research utilization. Public Administration Review 39 (5), 426–431. White, D., Rubiano, J., Andersson, M., Garcia, J., Saenz, L., Jarvis, A., 2009. Análisis de opotunidades de inversión en conservación por ahorros en tratamiento de aguas Sitio del estudio: El Páramo de Chingaza Colombia. CIAT, Colombia. Wood, S.A., Guerry, A.D., Silver, J.M., Lacayo, M., 2013w. Using social media to quantify nature-based tourism and recreation. Scientific Reports (in review).
Please cite this article as: Ruckelshaus, M., et al., Notes from the field: Lessons learned from using ecosystem service approaches to inform realworld decisions, Ecological Economics (2013), http://dx.doi.org/10.1016/j.ecolecon.2013.07.009