Jan 6, 2009 - Edmund R. Volkerts. Received: 28 October 2008 ..... Philip P, Taillard J, Klein E, Sagaspe P, Charles A, Davies WL,. Guilleminault C, Bioulac B ...
Psychopharmacology (2009) 204:127–133 DOI 10.1007/s00213-008-1443-x
ORIGINAL INVESTIGATION
Novice drivers’ performance after different alcohol dosages and placebo in the divided-attention steering simulator (DASS) Joris C. Verster & Anne E. Wester & Maartje Goorden & Jan-Peter van Wieringen & Berend Olivier & Edmund R. Volkerts
Received: 28 October 2008 / Accepted: 10 December 2008 / Published online: 6 January 2009 # The Author(s) 2008. This article is published with open access at Springerlink.com
Abstract Rationale The divided-attention steering simulator (DASS) is designed to measure lane-keeping (i.e., a tracking task using a steering wheel) while performing a secondary visual task (responding to digits that appear in the corners of the computer screen). Some studies have already used the DASS, but the magnitude of impairment is difficult to interpret because reference values are lacking. Objective To examine the magnitude of impairment after administration of four different dosages of alcohol and placebo. Materials and methods Thirty-two healthy young adults participated in this randomized, single-blind crossover trial. Subjects received alcohol to gain a blood alcohol concentration (BAC) of 0.02%, 0.05%, 0.08%, and 0.10% or alcohol–placebo. Sixteen subjects performed a 30-min test in DASS (dual-task condition). Outcome measures were steering error, reaction time, and percentage of errors. Sixteen other subjects performed the test without performing the secondary peripheral task (single-task condition). Results Twenty-eight subjects (novice drivers; drivers’ license up to 5 years) were included in the analyses. Dose-dependent impairment was found in both the singletask condition (F(4,11) =10.86, p10 cigarettes per day), or excessive caffeine use (>5 drinks per day). (B) Single Task
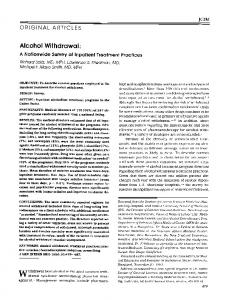
Fig. 1 Screen display of the DASS
(BACs) can be used as a historical control to illustrate and interpret research findings. Often, these BAC values correspond to the most common legal limits for driving a car, i.e., 0.02%, 0.05%, 0.08%, and 0.10%. For example, results from the on-the-road driving test in real traffic (Verster et al. 2004, 2005) are interpreted by comparing the magnitude of weaving of the car (standard deviation of lateral position) with reference values obtained with different dosages of alcohol (Louwerens et al. 1987). The advantage of this approach is that the results of a study are immediately understandable for a broad readership that is not familiar with the testing methodology. In this context, the present study examined the performance of novice drivers in the DASS under influence of four different dosages of alcohol (0.02%, 0.05%, 0.08%, and 0.10%) and placebo.
Materials and methods The study was a single-blind, randomized crossover trial comprising five test days separated by three to seven washout days. On each test day, subjects received placebo or one of four alcohol dosages (0.02%, 0.05%, 0.08%, or 0.1%). Sixteen subjects performed the DASS without the secondary task, while the other 16 subjects performed the DASS as intended, i.e., including the secondary peripheral visual search task. The study was performed between March 2007 and February 2008. The study was approved by the university hospital medical ethics committee and performed according to the ICH guidelines for Good Clinical Practice and the Declaration of Helsinki and its latest amendments. All subjects gave their informed consent prior to their inclusion in the study. Subjects Thirty-two adult healthy volunteers (21–50 years old) with an equal representation of both genders (i.e., 16 men, 16 women) were recruited. Subjects had to be social drinkers (average of seven to 21 alcoholic drinks per week) and novice drivers (up to 5 years after obtaining drivers’ license) to be included. Subjects were excluded in case of
Procedure Each test day followed a standard program of activities (see Table 1). After arrival at the institute, urine was tested (InstantView) for the presence of amphetamines (including MDMA), barbiturates, cannabinoids, benzodiazepines, cocaine, and opiates, and a breath alcohol test was performed (Dräger Alcotest 7410 Breath Alcoholmeter). Nicotine intake was screened using a breath CO monitor (Smokelyzer). In women, a urine β-HCG pregnancy test was performed (InstantView). Thereafter, subjects were trained on the DASS and treatment was administered. As soon as the desired BAC was reached, the DASS test was performed. The amount of alcohol needed to reach the desired BAC level was determined using the Widmarck formula, taking into account the gender and weight of the subject. Ethanol (99%) was mixed with orange juice up to a volume of 250 mL. The beverage was blinded by adding a taste marker (Menthae piperitae aetheroleum Ph.Eur.). Subjects consumed the beverage within 5 min while wearing a nose clip to further enhance treatment blinding. BAC measurements were made every 5 min, both after treatment and placebo administration. The DASS test started as soon as the subject reached the desired peak BAC and alcohol levels started descending. BAC was also measured after performing the DASS test. After a break, a second dose of alcohol was administered and the test day continued (results discussed elsewhere). BAC measurements continued throughout the day. At the
Table 1 Overview of a test day Relative time
Activity
0 0:10 0:15 0:30 0:45 1:15a 1:45 1:50
Subject arrives at the institute Urine drug screen (and pregnancy test in women) Breath alcohol test and smoke test DASS training session Treatment administration DASS driving test Subjective assessments Breath alcohol test/breakb
a Starting time is variable depending on BAC. The test started as soon as the desired BAC was reached b After the break, a second dose of alcohol was administered and the test day continued (results discussed elsewhere)
Psychopharmacology (2009) 204:127–133
end of the test day, subjects could return home if the BAC reached zero or the subject and investigator agreed that the subject was able to safely leave the institute by public transportation.
129
Subjective assessments Visual analog scales of mental effort and subjective driving quality were completed after the test. Subjects also rated their drunkenness on a ten-point scale.
Divided-attention steering simulator test Statistical analyses During screening, subjects were trained on the test to familiarize them with the test and achieve stable performance. Each test day, subjects were trained on the DASS (developed by Stowood Scientific Instruments, Oxford) in order to reduce learning effects (Juniper et al. 2000; Philip et al. 2003). After treatment administration, the actual test was performed in a sound-proof room. All tests comprised 30 min. The DASS is a combination of a tracking task and a peripheral visual search task, can be run on a standard PC, and has only one level of difficulty. A winding road is depicted as two drawn lines on the 19-in. computer screen and subjects are instructed to keep the front of the car within the road delineation (see Fig. 1). This can be achieved by using the steering wheel, which is fixed to the table in front of the computer screen. Subjects were seated approximately 50 cm in front of the 19-in. computer screen. Two parameters of steering error are measured: (1) the steering error relative to the center of the road (SECENTER) and (2) the steering error from the ideal curve (SECURVE). The steering error is measured in meters. In addition to this steering task, the DASS also included a peripheral visual search task that has to be performed simultaneously. In this task, digits (0–9) are presented in the four corners of the screen. Every 8–10 s, the digits change randomly. Subjects were instructed to respond as quickly as possible by pushing one of the buttons left or right on the steering wheel when a number “2” appeared on the left or right side of the screen. The digit two appeared 39 times during the 30-min test. Reaction time and percentage of errors are parameters of the secondary peripheral visual search task. In our study, half of the subjects performed only the steering component of the DASS (single-task condition), the other half performed the DASS including the peripheral visual search task (dual-task condition).
Statistical analyses were performed using SPSS. The data was tested for significance using repeated measures analysis of variance (two-tailed, p≤0.05). Within-subject factors were treatment (BAC 0%, 0.02%, 0.05%, 0.08%, and 0.10%) and treatment order. Results from the singletask and dual-task conditions were analyzed separately. Paired comparisons between different BAC levels and placebo were also conducted. Bonferroni’s correction was applied to adjust for multiple comparisons. The dependent variables were steering error (SECENTER and SECURVE), reaction time, percentage of errors, and scores on the visual analog scales. In case the data did not meet the criteria of a normal distribution, nonparametric tests were applied. Sample size was estimated based upon results of previous studies using the DASS (Juniper et al. 2000; Turkington et al. 2004). Missing values were replaced by group averages for that particular BAC value.
Results Subjects A total of 28 subjects were included in the statistical analyses. Four subjects were excluded because they were not novice drivers (possession of a driver’s license >5 years). Data from two test days was missing. One female had to vomit after BAC 0.05%, another female after BAC 0.08%. This missing data was replaced by the group average. The demographics are summarized in Table 2. The demographics of the subjects that performed the single task (N = 15) did not differ significantly from those who performed the dual task (N=13).
Table 2 Demographics
Number of subjects Male/female ratio Age BMI Years driving Kilometers per year BMI body mass index
Dual-task group (N=13)
Single-task group (N=15)
Combined (N=28)
13 6/7 23.38 (2.3) 22.60 (2.1) 2.71 (1.6) 4,191 (4,224)
15 6/9 22.47 (1.5) 22.50 (2.6) 3.48 (1.3) 4,219 (7,998)
28 12/16 22.89 (1.9) 22.55 (2.3) 3.12 (1.4) 4,206 (6,638)
130
Psychopharmacology (2009) 204:127–133
BAC levels and blinding The actual BAC levels (mean±SD) before testing matched the desired BAC for 0.02% (0.021±0.003%), 0.05% (0.05± 0.005%), 0.08% (0.08±0.003%), and 0.10% (0.10±0.004%). Mean± SD BAC after the tests were 0.011±0.004% (BAC 0.02%), 0.04±0.009% (BAC 0.05%), 0.06±0.03% (BAC 0.08%), and 0.08±0.01% (BAC 0.10%). Blinding was successful: the group who performed the single-task DASS guessed their BAC levels correctly on 41.33% and 50.77% on single-task and dual-task test days, respectively. DASS performance Data was normally distributed and no effects of treatment order were found. The results are summarized in Table 3 and Fig. 2. Dual task performance For SECENTER, an overall effect of treatment was found (F(4,9) =5.58, p