NRProF: Neural Response Based Protein Function Prediction Algorithm Quan-Wu Xiao
Hari Krishna Yalamanchili, Junwen Wang
Department of Mathematics, City University of Hong Kong, Hong Kong SAR, China. E-mail:
[email protected]
Department of Biochemistry, LKS Faculty of Medicine, The University of Hong Kong, Hong Kong SAR, China. E-mail:
[email protected],
[email protected]
sets from high-throughput experimental methods, such as The protein-protein interactions (PPI) [3] and gene expression data by clustering similar genes and proteins. The definition of a biological function itself is enigmatic in biology and highly context dependent [4-6]. This is part of the reason why more than 50% of functional annotations are ambiguous. The functional scope of a protein in an organism differs depending on the aspect under consideration. Protein can be annotated based on their mode of action i.e. Enzyme Commission (EC) number [7] (physiological aspect) or their association with a disease (phenotypic aspect). The lack of functional coherence increases the complexity of automated functional annotation. Another major barrier is the use of different vocabulary by different annotations. A function can be described differently in different organisms [8]. This problem can be solved by using ontologies, which serve as universal functional definitions. Enzyme Commission (E.C) [9], MIPS Functional Catalogue (Fun Cat) [10] and Gene Ontology (GO) [11] are such ontologies, with GO being the most recent and widely used. Many automated annotation methods uses GO for functional annotation. Protein function assignment methods can be divided into two main categories – structure-based methods and sequencebased methods. A protein’s function is highly related to its structure. Protein structure tends to be more conserved than the amino acid sequence in the course of evolution [12, 13]. Keywords: Algorithms, Artificial intelligence, Genome Thus a variety of structure-based function prediction methods annotation, Machine learning, Ontology. [14, 15] rely on structure similarities. These methods start with a predicted structure of the query protein and search for I. INTRODUCTION similar structural motifs in various structural classification Recent advances in high-throughput sequencing technologies databases such as CATH [16] and SCOP [17] for function have enabled the scientific community to sequence a large prediction. Structural alignments can reveal the remote number of genomes. Currently there are 1,390 complete homology for 80–90% of the entries in Protein Data Bank genomes [1] annotated in the KEGG genome repository and [18] even if no significant sequence similarity was found for many more are in progress. However, experimental based the two proteins [19]. However, these methods are limited by functional characterization of these genes cannot match the the accuracy of the initial query structure prediction and the data production rate. Adding to this, more than 50% of availability of the homologues structures in the structural functional annotations are enigmatic [2]. Even the well studied genomes, such as E. coli and C. elegans, have 51.17% databases. Despite of being highly accurate, the big gap between the number of sequences and their solved structures and 87.92% ambiguous annotations (putative, probable and restricts the use of structure-based methods. Therefore, unknown) respectively [2]. To fill the gap between the sequence-based methods are needed. number of sequences and their (quality) annotations, we need The main idea behind sequence-based methods is to fast, yet accurate automated functional annotation methods. compare the query protein to the proteins that are well Such computational annotation methods are also critical in characterized, and the function of the best hit is directly analyzing, interpreting and characterizing large complex data assigned to the query sequence. GO annotations are assigned The research was supported by General Research Fund (778609M) to the BLAST [20] search results for the first time by GOblet and NSFC/RGC fund (N_HKU752/10) from the Research Grants [21] which maps the sequence hits to their GO terms. Later Council of Hong Kong. on the GO terms are given weights based on the E-value of Abstract— A large amount of proteomic data is being generated due to the advancements in high-throughput genome sequencing. But the rate of functional annotation of these sequences falls far behind. To fill the gap between the number of sequences and their annotations, fast and accurate automated annotation methods are required. Many methods, such as GOblet, GOfigure, and Gotcha, are designed based on the BLAST search. Unfortunately, the sequence coverage of these methods is low as they cannot detect the remote homologues. The lack of annotation coverage of the existing methods advocates novel methods to improve protein function prediction. Here we present a automated protein functional assignment method based on the neural response algorithm, which simulates the neuronal behavior of the visual cortex in the human brain. The main idea of this algorithm is to define a distance metric that corresponds to the similarity of the subsequences and reflects how the human brain can distinguish different sequences. Given query protein, we predict the most similar target protein using a two layered neural response algorithm and thereby assigned the GO term of the target protein to the query. Our method predicted and ranked the actual leaf GO term among the top 5 probable GO terms with 87.66% accuracy. Results of the 5-fold cross validation and the comparison with PFP and FFPred servers indicate the prominent performance by our method. The NRProF program, the dataset, and help files are available at http://www.jjwanglab.org/NRProF/.
2011 IEEE International Conference on Systems Biology (ISB) 978-1-4577-1666-9/11/$26.00 ©2011 IEEE
33
Zhuhai, China, September 2–4, 2011
minimize the complexity of the corresponding image classification problem (supervised task)[28]. Our method, NRProF, is the first instance of neural response algorithm being used in the biological domain. In the current context of protein functional characterization, the top most layer represents the whole protein sequences and the subsequent layers are constituted of sequence motifs. At each layer similarity is computed between the templates of two successive layers, which were referred to as derived kernels by taking the maximum of the previously computed local kernels in a recursive fashion. Finally a mapping engine is built on the kernels derived from the neural response algorithm to map the query protein to its most probable GO term. A detailed description of the whole methodology is given in the Methods section.
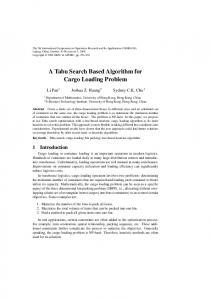
the BLAST search by Ontoblast [22]. This is further refined in GOfigure [23] and GOtcha [24] by communicating the scores from one level to the other in the GO hierarchy tree. All these methods are based on the BLAST search results; thus they fail to identify the remote homologues with a higher E-value. This problem is solved in the Protein Function Prediction (PFP) server [25], which replaces the BLAST with PSI-BLAST [26] and thus can detect remote homologues. The PFP server can predict the generalized function of protein sequences with remote homology, but with a trade-off of low specificity. FFPred [27] is the most recent protein function prediction server that builds SVM classifiers based on the extracted sequence features of the query sequence and thus it does not require prior identification of protein sequence homologues. However the server needs one SVM classifier for each GO term, which makes it computationally expensive. Furthermore, the server only provides classifiers for 111 Molecular function and 86 Biological Process categories that represent more general annotations, which limits its usage in deciphering specific annotations. The lack of annotation specificity and high complexity of the existing methods advocate the need to improvement in the automated protein function prediction. Here we present a novel automated protein functional assignment method based on the neural response algorithm [28]. The algorithm simulates the neuronal behavior of human’s image recognition, and has been successfully applied for image classification. The main idea of this algorithm is to define a distance metric that corresponds to the similarity of small patches of the images and reflects how the human brain can distinguish different images. This algorithm uses a multi-layer framework with spatial scale, and size increasing as we move from the one layer to the other in a bottom-up fashion. The bottom most layer consists of templates (sub-patches) of the images and the intermediate layers consist of secondary templates formed by the assembly of the templates in the lower layers. The whole image is in the topmost layer. For example we consider a three layered architecture of templates (patches) p, q and r (whole image), with p ⊂ q ⊂ r as shown in Figure 1. Assume Im(p), Im(q) and Im(r) as the function spaces corresponding to the similarity of the templates in the layers p, q and r respectively. Im(x) gives the similarity between any two patches in the layer x and a set m: that maps the templates from the bottom most layer to the templates in the next layer i.e. mp : p → q, and similarly mq : q → r. Having defined the layers (p,q and r) and the initial layers similarity function Im(p), the algorithm builds a derived kernel on the top of layer r in a bottom-up fashion. The process starts with the calculation of initial reproducing kernel kp on the bottom most layer p as the inner product of its functional space Im(p)×Im(p). Based on the this initial kernel kp, intermediate derived kernel kq is computed on top of the layer q and this in turn is used to compute the final derived kernel kr on the top most layer r, which can help us in the classification of the whole images in layer r. Refer to [28], for the detailed mathematical formulation of the initial and the derived kernels. The computation of kernels form the unsupervised preprocessing component and is key for the superior performance of the neural response algorithm as it can 2011 IEEE International Conference on Systems Biology (ISB) 978-1-4577-1666-9/11/$26.00 ©2011 IEEE
Figure 1. Three layer mode for image classification.
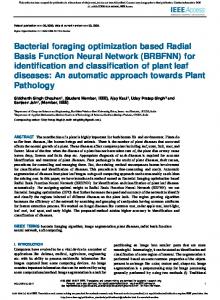
II. METHODS The neural response algorithm can be viewed as a multilayered framework as described in the previous section. Here we built a two layer model as shown in Figure 2, with the whole protein sequences in the top most layer and the templates (sequence motifs) in the subsequent layer. We used Gene Ontology (GO) vocabulary for protein functional assignment, i.e. we mapped the query protein to its corresponding GO term(s) that represent(s) the properties of the query sequence. GO terms covers three major domains: cellular component, molecular function, and biological process. We downloaded the ontology file (OBO) v1.2 from the GO resource. To demonstrate our approach, we only used the molecular function domain with a total of 8,912 GO terms. Then we extracted the proteins and their sequences belonging to each of the GO terms. To address the issues of redundancy we had used CD-HIT [29], a program that removes redundant sequences and generate a database of only the representatives. These protein sequences and their respective GO terms were used as the base dataset for our model. We only used proteins from humans because we wanted to demonstrate the ability of our method to predict/characterize the function of the proteins even if they are remotely homologous to the precharacterized proteins (human).
34
Zhuhai, China, September 2–4, 2011
A. Initial Kernel Let there be m templates (sequence motifs) q1…qm in the second layer. We need to define a non-negative similarity measure s(qi,qj) between any two motifs qi and qj. A natural condition for similarity is s(qi ,qj) ≤ s(qi ,qi) for any qi ≠ qj, which means a motif is always more similar to itself than to the others. Besides this, to ensure the validity of our algorithm, a mathematical requirement of the similarity is that for a set of motifs q1…qm, the matrix S should be a positive definite matrix. 𝑆 = �𝑠�𝑞𝑖 , 𝑞𝑗 �� 𝑛𝑖,𝑗=1
(1)
Our template library in layer 2 consists of HMM profiles from the Pfam database, thus we define the similarity between templates as profile-profile alignment scores. We had 10,257 profiles in the template library, making ~106 profile-profile alignments. To align the template HMM profiles we used HHsearch which is the most sensitive profile-profile alignment tool to date [33-35]. As a refinement for better sensitivity and to capture the remote homology between the templates, we considered the secondary structure information of the templates as well, which is considered more conserved and provides additional information [36]. We have previously used secondary structure information to improve protein sequence alignment [37] and remote homologue identification [38]. Thus we converted the HMM profiles to HHM [34] profiles containing the secondary structure information of all the match states in the HMM profiles. We employed HHsearch which uses PSI-PRED [39] to predict the secondary structure and added them to the HMM profiles. By doing this we were able to capture the remote homologues templates. ProfileProfile alignments were proved to be more sensitive than PSI-BLAST in the identification of remote similarity [40]. Thus our method has the edge over the PFP server which is based on PSI-BLAST in detecting the remote homologues.
Figure 2. Two layers of the model and their respective data sources.
We further trimmed our GO terms by screening out the terms with less than 5 proteins. The resultant GO terms form the base set for our method and their associated proteins form layer 1 in the model. For the second layer (template library), we used the sequence motifs from PROSITE [30] version20.68 and Pfam [31] version-24. The rationale behind choosing PROSITE and Pfam is that Pfam has the largest sequence coverage [3] and PROSIRE has small sequence motifs that can be useful in detecting remote homologues in the absence of a whole conserved domain. We downloaded the PROSITE patterns and Pfam domains as Hidden Markov Model (HMM) [32] files from the respective repositories. Here we built two kernels, one on the top of each layer. First an initial kernel is computed on top of the template layer, which can be used as a similarity function between the templates. Then a derived kernel is computed on top of the first layer by choosing the maximum neural response between the individual templates in layer 2 and the sequences in layer 1. Computation of the initial kernel, the neural response and the derived kernel is explained in detail in the following subsections and the overall pipeline of the methodology is shown in Figure 3.
B. Neural Response Consider a protein p in layer 1 with k template hits denoted by qp1…qpk in layer 2. PrositeScan [41] and HMMER 3.0 [32] are used to scan the protein sequences in layer 1 with the templates from PROSITE and Pfam respectively. Both PrositeScan and HMMER 3.0 were used in the local alignment mode as here we intended to capture the existence of the locally conserved patterns. Then the neural response of the protein p with respect to a motif q is given by 𝑁(𝑝, 𝑞) = max� 𝑠�𝑞𝑝1 , 𝑞� … �𝑞𝑝𝑘 , 𝑞��
(2)
Now by considering all the m motifs in the template layer the information about the protein p given the templates can be represented by an m-dimensional vector N(𝑝) = �N(𝑝, 𝑞1 ), … . N(𝑝, 𝑞𝑚 )�
Figure 3.
Our goal is to learn the similarity between the query protein pi and the proteins in the base dataset such that we can assign the query protein pi to the GO term(s) associated with the most similar protein pj. To quantize the similarity between pairs pi and pj, we encoded the pair (pi,pj) into a vector N(i,j) on which we can formulate the mapping engine to map the query protein to its most probable GO term. There
Pipeline diagram showing the control flow of the method.
2011 IEEE International Conference on Systems Biology (ISB) 978-1-4577-1666-9/11/$26.00 ©2011 IEEE
(3)
35
Zhuhai, China, September 2–4, 2011
only overcoming the threshold dependency problem but also using the ranking (true value of the f(N(i,j))) as the confidence scores for multiple GO terms associated with a single protein.
are two ways to achieve this, by taking the difference between N(pi) and N(pj) or by simply concatenating them together. As we found that the former method always gives better performance in our algorithm, we thus let
III. RESULTS We used the GO terms with no further children (leaf nodes of the GO tree) and their corresponding proteins to validate our approach. The rationale for using leaf nodes is that these GO terms are more functionally specific than the GO terms at the higher levels, i.e. no two GO terms share a common protein and thus can demonstrate the specific function prediction ability of our method. This also addresses issue of redundancy in the training set. To further fortify our argument we had also addressed the redundancy problem at sequence level by eliminating the redundant sequences that are more than 80% similar in the training set. This is done by CD-HIT [29], a program that removes redundant sequences and generate a database of only the representatives. From the extracted GO terms we enumerated all the protein pairs belonging to the same GO term and labeled them as positive dataset i.e. we assigned a label Y(i,j) as 1 and the protein pairs belonging to different GO terms were labeled as negative, Y(i,j) =0. Among such labeled pairs, we randomly selected 3000 positive pairs and 3000 negative pairs and used these labeled protein pairs to train and validate our method. After training the final mapping function, f(N(i,j)) produced a value between 0 and 1 corresponding to the similarity between the proteins i and j in the validation set. Upon applying the threshold of 0.5, we predicted the labels Y(i,j) to 1 (share a GO term) if f(N(i,j)) ≥ x, and predict Y(i,j) to 0 (do not share a GO term) if f(N(i,j)) < x. We tried different values of x to decide on the best threshold. Different threshold values and their corresponding accuracies are plotted in Figure 4. From the Figure 4 it can be observed that the accuracy is high for the threshold values ranging from 0.5 to 0.6. Thus we has selected 0.5 as the cutoff to validate our method with 5-fold cross validation i.e. we divided the pool of 6000 labeled protein pairs into five partitions with an equal number of positive and negative labeled pairs. Out of the five partitions, four were used as training set to train the neural response algorithm, and the remaining one partition was used to testing the algorithm. This process was repeated five time (the folds), with each of the five partitions used exactly once as the validation data.
(4)
N(𝑖,𝑗) = �N(𝑝𝑖 ) − N�𝑝𝑗 ��
= (�𝑁(𝑝𝑖 , 𝑞1 ) − 𝑁�𝑝𝑗 , 𝑞1 ��, … , �𝑁(𝑝𝑖 , 𝑞𝑚 ) − 𝑁�𝑝𝑗 , 𝑞𝑚 ��)
which is the neural response of the pair (pi,pj) on the templates set q1…qm. C. Derived Kernel We can derive a kernel K, which measures the similarity of two protein pairs, from the neural responses. This kernel also gives the similarity of two proteins. Two proteins are similar, if the pair constituted by them is similar to a pair with two similar proteins and vice versa. In the original paper of neural response [28], a linear kernel is defined by inner products of neural responses. Under our setting, the linear kernel for two pairs (pi,pj) and (pi,pj) can be written as (5)
𝐾 ��𝑝𝑖 , 𝑝𝑗 �, �𝑝𝑖" , 𝑝𝑗" �� = 𝑁 〈𝑁(𝑖,𝑗) , 𝑁(𝑖",j") 〉 n
= �
𝑘=1
N (𝑝𝑖 , 𝑞𝑘 )N (𝑝𝑖" , 𝑞𝑘 ) n
+�
k=1
N �𝑝𝑗 , 𝑞𝑘 � N �𝑝𝑗" , 𝑞𝑘 �
It is well established that the Gaussian kernel usually performs better than the linear kernel for various classification tasks. Thus we had derived a Gaussian kernel with a scale parameter σ, given by 𝐾 ��𝑝𝑖 , 𝑝𝑗 �, �𝑝𝑖" , 𝑝𝑗" �� = exp �−
�𝑁(𝑖,𝑗) −𝑁(𝑖",𝑗") � 𝜎2
2
�
(6)
D. Function assignment Finally, a mapping engine was built, which defines a function “f” lying in the reproducing kernel Hilbert space [42] associated with a positive definite kernel K that is derived from the neural responses by inner products (linear kernel) or Gaussian radial basis functions (Gaussian kernel). First, we computed the neural response of all the proteins in the base dataset with respect to the template library in layer 1 as described in section 2.2. Similar neural response was computed for the query protein sequence as well. Next we computed the pairwise neural response N(i,j) between the query sequence i and the sequence j (1..n) in the base dataset. The mapping function f(N(i,j)) produces a value ranging between 0 to 1 corresponding to similarity between the proteins pi and pj. Thus, we can predict the label Y(i,j) to 1 (similar) if f(N(i,j)) ≥ 0.5, and Y(i,j) to 0 (non-similar) if f(N(i,j)) < 0.5 . Other thresholds besides 0.5 are also allowed. We then assigned the query protein pi to the GO term/s associated with the protein/s pj whose label Y(i,j) was set to 1. In this case the sensitivity of GO term assignments varies with the threshold used (0.5). To overcome this dependency on the threshold, we sorted the proteins in the base dataset into descending order based on their similarity (f(N(i,j))) to the query protein. We finally extracted the top 5 GO terms and assign them to the query protein. By doing so, we are not 2011 IEEE International Conference on Systems Biology (ISB) 978-1-4577-1666-9/11/$26.00 ©2011 IEEE
Figure 4.
Accuracy plot for different threshold values.
In Table I we report the average accuracy and area under the curve (AUC) of the 5-fold cross validation with respect to the template library used in the layer 2. The differences in the accuracies (Table I) using the PROSITE and PFAM template libraries is due to the differences in the respective sequence
36
Zhuhai, China, September 2–4, 2011
have a standalone software version, we had to submit our query directly to the online server manually for each of the 400 proteins. The PFP and FFPred servers list the probable GO terms for a query protein sequence with a confidence score associated with each of the GO terms. A prediction is considered to be accurate if they predict the same GO term (rank 1) for both the proteins of a pair in the positive test set and different for the negative test set. On the other hand NRProF prediction is considered to be accurate if it can classify the positive set as similar and negative set as dissimilar pairs. Out of 200 predictions, NRProF performed better than PFP and FFPred servers in 8 and 6 instances respectively. The accuracies are tabulated in Table II. We therefore infer that our method NRProF had performed better than the FFPred and PFP servers.
coverage. Thus we combined the PFAM and PROSITE templates for a better sequence coverage, which is reflected in the increased accuracy (Table I). TABLE I. |S| 1 2 3
5-FOLD CROSS VALIDATION RESULTS WITH RESPECT TO THE TEMPLATE LIBRARY USED IN LAYER 2 Template Library in layer 2 PROSITE PFAM PROSITE + PFAM
Accuracy
AUC
77.1% 80.5% 82.0%
0.851 0.875 0.882
As described in the section C, the derived kernel classifies two proteins to be similar, if the pair constituted by them is equivalent (similar) to a pair with two known similar proteins. To test the classification specificity of our method we have selected 800 proteins (400 pairs) with the first 100 pairs sharing an immediate parent GO term (level 1); second 100 pairs sharing a common parent separated by an edge distance of 2 in the GO tree (level 2). Similarly we have level 3 and 4 datasets with an edge distance of 3 and 4 respectively. As the positive pairs in the training set share a common GO term, we expect our method to classify the protein pairs as positive whose GO terms are the same or the next one in the GO hierarchy and as negative if their respective GO terms are far away. The number of positively classified (similar) pairs in respective subsets is given the Figure 5. We observed that the number of positively classified (similar) pairs is 88% in the level 1 dataset as they are much closer in the GO tree and it gradually dropped to 9% in the level 4 dataset as the GO distance between them is increased. This suggests that our method is highly specific in classifying the similar proteins
TABLE II. CLASSIFICATION ACCURACY OF THE NRPROF, FFPRED AND PFP SERVER WITH RESPECT TO THE COMPILED TEST SET. |S| 1 2 3
Accuracy
NRProF FFPred PFP Server
84.5% 81.5% 80.5%
Next we compared the GO term predictability of our method with PFP and FFPred servers. The PFP and FFPred servers predict the most probable GO terms for a query protein with a confidence score associated with each of the GO terms. In contrast, our method labels the protein pair pi (query protein) and pj (protein in the base dataset ) as 1 if they are similar and thereby assigns the GO term of the protein pj to the protein pi based on the threshold applied on the function f(N(i,j)). To overcome the threshold dependency and to make the results comparable with the PFP and FFPred servers, we had sorted the proteins in the base dataset in descending order based on their similarity (f(N(i,j))) to the query protein, and assigned corresponding the most similar (rank 1) protein’s GO terms to the query protein. A prediction is considered to be accurate if actual GO term of the query protein is ranked among the top 5 probable GO terms by the respective methods. Lack of standalone versions of PFP and FFPred is a serious limitation on the dataset used for comparison. We compiled a dataset of 300 proteins each belonging to the leaf nodes of the GO tree. The prediction results from PFP and FFpred were obtained by manual submissions to the respective servers. Table III compares the GO terms predicted for the Human protein WDR55. PFP could not report the actual leaf GO term in its top 5 predictions. This is due to trade-off of annotation specificity to weak hits with High E value. FFPred could not predict any GO term because it is limited to only 111 Molecular function and 86 Biological Process categories. Whereas NRProF had predicted top 3 similar proteins with the same GO term. The Overall accuracy on the set of 300 proteins is reported in the Table IV.
with respect to the relative distance between the respective GO terms. Figure 5. Classification specificity plot.
Having shown the predominant classification specificity and the 5 fold cross validation results, we had further compared our method with the PFP and FFPred servers, which are the most sensitive protein function prediction server using GO vocabulary [3] to date. We had compiled a test set of 400 proteins constituting of 200 proteins (100 pairs) sharing the same GO term (positive test set) i.e. the edge distance between the GO terms of a protein pair is zero and another 200 proteins (100 pairs) sharing a distant root GO term (negative test set) i.e. the edge distance between the GO terms of a protein pair is ≥ 1. Each of the 200 protein pairs were classified as either positive (similar) or negative (non similar) by NRProF. Since PFP and FFPred server does not 2011 IEEE International Conference on Systems Biology (ISB) 978-1-4577-1666-9/11/$26.00 ©2011 IEEE
Method
TABLE III.
GO TERMS PREDICTED FOR THE PROTEIN Q9H6Y2 BY PFP, FFPRED AND NRPROF.
Protein Name / ID Actual Leaf GO term Top 5 GO terms by PFP Top 5 GO terms by FFPred
37
WDR55/Q9H6Y2 GO:0002039 GO:0005488, GO:0043169, GO:0003676, GO:0004977, GO:0046026 No GO terms predicted for this sequence Zhuhai, China, September 2–4, 2011
Top 5 GO terms by NRProF
library are computed only once and from there the neural response between the query and target is computed with the least computational effort unlike other BLAST/PSI-BLAST based methods. The simple derived kernel (section 2.3) adds to the computational simplicity of our method. We validated our method in a 5-fold cross validation fashion and obtained an accuracy of 82%. Considering the criterion that a prediction is valid if and only if the actual GO term is top ranked (1st Rank) GO term by our method, 82% is quite a good accuracy. The classification accuracy of 84.5% on a test set of 400 proteins suggest that our method is highly specific in classifying the similar proteins with respect to the relative distance between the respective GO terms. Upon further caparison of our method with the PFP and FFPred servers which are the most sensitive function prediction servers to date, the GO term prediction accuracy of 87.66% evince that our method is more accurate in predicting the specific functions. Thus we conclude that our method is computationally simple yet accurate when compared with the other methods. This is achieved by simulating the neuronal behavior of the visual cortex in the human brain in the form of neural response.
P51532, Q96S44, Q9HCK8 (GO:0002039), Q01638 (GO:0002114), Q13822 (GO:0047391)
TABLE IV. GO TERM PREDICTION ACCURACY AND AUC VALUES OF THE NRPROF AND PFP SERVER WITH RESPECT TO THE TEST SET. |S| 1 2
Method NRProF PFP Server
Accuracy
AUC
87.66% 83.33%
0.9339 0.8892
From Table IV, we can infer that our method NRProF had performed reasonably better than the PFP server. We had not reported the accuracy of the FFPred as it is limited to 111 Molecular function categories making it suitable for general function classes rather than specific annotations and therefore it is not fair to compare FFPred with the test set constituting of protein from the leaf GO terms (with no further child nodes). There are other methods that use GO vocabulary for protein function prediction methods including GOblet, GOfigure and GOtcha. But the PFP server has already been proved to be superior to all the above mentioned methods [25]. Thus we had compared our method (NRProF) only with the PFP server. IV.
ACKNOWLEDGMENT We thank Prof. Steve Smale of City University of Hong Kong for valuable discussion and members of Wang lab at the University of Hong Kong for their critical comments.
DISCUSSION
Here we present a novel protein function prediction method, NRProF, based on the neural response algorithm using the Gene Ontology vocabulary. The neural response algorithm simulates the neuronal behavior of the visual cortex in the human brain. It defines a distance metric corresponding to the similarity by reflecting how the human brain can distinguish different sequences. It adopted a multilayer structure, in which each layer can use one or multiple types of sequence/structure patterns. NRProF is the first instance of neural response being used in the biological domain. It finds the most similar protein to the query protein based on the neural response N between the query and the target sequences; and thereby assigns the GO term(s) of the most similar protein to the query protein. This is a profound and composite method with the essence of sequential, structural and evolutionary based methods for protein function prediction. The templates from the PRINTS and PFAM database contribute to the functional profiles or signatures (sequence). The mismatch and deletion states in the HMM profiles of the PFAM templates account to the degeneracy due to evolution and the secondary structural information of the match states in the HHM profiles contribute to the structural part. The use of HMM profiles along with the secondary structure information of PROSITE and PFAM sequence motifs to define the neural response gives our method an edge over other available methods to identify the remote homologues, as profile-profile alignments are superior to PSI-BLAST based methods in detecting the remote homologues. Thus NRProF can complement most of the existing methods. Our method is computationally less complex compared with the other methods, as the initial neural response of the proteins in the base dataset with respect to the template 2011 IEEE International Conference on Systems Biology (ISB) 978-1-4577-1666-9/11/$26.00 ©2011 IEEE
REFERENCES [1] M. Kanehisa, et al., "The KEGG resource for deciphering the genome," Nucleic Acids Res, vol. 32, pp. D277-80, Jan 1 2004. [2] T. Hawkins and D. Kihara, "Function prediction of uncharacterized proteins," J Bioinform Comput Biol, vol. 5, pp. 1-30, Feb 2007. [3] T. Hawkins, et al., "PFP: Automated prediction of gene ontology functional annotations with confidence scores using protein sequence data," Proteins, vol. 74, pp. 566-82, Feb 15 2009. [4] J. C. Whisstock and A. M. Lesk, "Prediction of protein function from protein sequence and structure," Q Rev Biophys, vol. 36, pp. 307-40, Aug 2003. [5] J. Skolnick and J. S. Fetrow, "From genes to protein structure and function: novel applications of computational approaches in the genomic era," Trends Biotechnol, vol. 18, pp. 34-9, Jan 2000. [6] B. Rost, et al., "Automatic prediction of protein function," Cell Mol Life Sci, vol. 60, pp. 2637-50, Dec 2003. [7] R. F. Doolittle, "The multiplicity of domains in proteins," Annu Rev Biochem, vol. 64, pp. 287-314, 1995. [8] A. Valencia, "Automatic annotation of protein function," Curr Opin Struct Biol, vol. 15, pp. 267-74, Jun 2005. [9] "Nomenclature committee of the international union of biochemistry and molecular biology (NC-IUBMB),
38
Zhuhai, China, September 2–4, 2011
Enzyme Supplement 5 (1999)," Eur J Biochem, vol. 264, pp. 610-50, Sep 1999. [10] A. Ruepp, et al., "The FunCat, a functional annotation scheme for systematic classification of proteins from whole genomes," Nucleic Acids Res, vol. 32, pp. 553945, 2004. [11] M. A. Harris, et al., "The Gene Ontology (GO) database and informatics resource," Nucleic Acids Res, vol. 32, pp. D258-61, Jan 1 2004. [12] C. Gille, et al., "Conservation of substructures in proteins: interfaces of secondary structural elements in proteasomal subunits," J Mol Biol, vol. 299, pp. 1147-54, Jun 16 2000. [13] C. A. Wilson, et al., "Assessing annotation transfer for genomics: quantifying the relations between protein sequence, structure and function through traditional and probabilistic scores," J Mol Biol, vol. 297, pp. 233-49, Mar 17 2000. [14] D. Pal and D. Eisenberg, "Inference of protein function from protein structure," Structure, vol. 13, pp. 12130, Jan 2005. [15] J. V. Ponomarenko, et al., "Assigning new GO annotations to protein data bank sequences by combining structure and sequence homology," Proteins, vol. 58, pp. 855-65, Mar 1 2005. [16] C. A. Orengo, et al., "CATH--a hierarchic classification of protein domain structures," Structure, vol. 5, pp. 1093-108, Aug 15 1997. [17] A. G. Murzin, et al., "SCOP: a structural classification of proteins database for the investigation of sequences and structures," J Mol Biol, vol. 247, pp. 536-40, Apr 7 1995. [18] H. M. Berman, et al., "The Protein Data Bank," Nucleic Acids Res, vol. 28, pp. 235-42, Jan 1 2000. [19] C. A. Orengo, et al., "The CATH Database provides insights into protein structure/function relationships," Nucleic Acids Res, vol. 27, pp. 275-9, Jan 1 1999. [20] S. F. Altschul, et al., "Basic local alignment search tool," J Mol Biol, vol. 215, pp. 403-10, Oct 5 1990. [21] D. Groth, et al., "GOblet: a platform for Gene Ontology annotation of anonymous sequence data," Nucleic Acids Res, vol. 32, pp. W313-7, Jul 1 2004. [22] G. Zehetner, "OntoBlast function: From sequence similarities directly to potential functional annotations by ontology terms," Nucleic Acids Res, vol. 31, pp. 3799-803, Jul 1 2003. [23] S. Khan, et al., "GoFigure: automated Gene Ontology annotation," Bioinformatics, vol. 19, pp. 2484-5, Dec 12 2003. [24] D. M. Martin, et al., "GOtcha: a new method for prediction of protein function assessed by the annotation of seven genomes," BMC Bioinformatics, vol. 5, p. 178, Nov 18 2004. [25] T. Hawkins, et al., "Enhanced automated function prediction using distantly related sequences and contextual 2011 IEEE International Conference on Systems Biology (ISB) 978-1-4577-1666-9/11/$26.00 ©2011 IEEE
association by PFP," Protein Science, vol. 15, pp. 1550-1556, Jun 2006. [26] S. F. Altschul, et al., "Gapped BLAST and PSIBLAST: a new generation of protein database search programs," Nucleic Acids Res, vol. 25, pp. 3389-402, Sep 1 1997. [27] A. E. Lobley, et al., "FFPred: an integrated featurebased function prediction server for vertebrate proteomes," Nucleic Acids Res, vol. 36, pp. W297-302, Jul 1 2008. [28] S. Smale, et al., "Mathematics of the Neural Response," Foundations of Computational Mathematics, vol. 10, pp. 67-91, 2010. [29] Y. Huang, et al., "CD-HIT Suite: a web server for clustering and comparing biological sequences," Bioinformatics, vol. 26, pp. 680-2, Mar 1 2010. [30] A. Bairoch, "PROSITE: a dictionary of sites and patterns in proteins," Nucleic Acids Res, vol. 19 Suppl, pp. 2241-5, Apr 25 1991. [31] E. L. Sonnhammer, et al., "Pfam: a comprehensive database of protein domain families based on seed alignments," Proteins, vol. 28, pp. 405-20, Jul 1997. [32] R. Durbin, Eddy, S., Krogh, A., and Mitchison, G. , Biological sequence analysis: probabilistic models of proteins and nucleic acids: Cambridge University Press, 1998. [33] R. I. Sadreyev, et al., "Profile-profile comparisons by COMPASS predict intricate homologies between protein families," Protein Sci, vol. 12, pp. 2262-72, Oct 2003. [34] J. Soding, "Protein homology detection by HMMHMM comparison," Bioinformatics, vol. 21, pp. 951-60, Apr 1 2005. [35] R. L. Dunbrack, Jr., "Sequence comparison and protein structure prediction," Curr Opin Struct Biol, vol. 16, pp. 374-84, Jun 2006. [36] J. W. Wang and J. A. Feng, "Exploring the sequence patterns in the alpha-helices of proteins," Protein Engineering, vol. 16, pp. 799-807, Nov 2003. [37] J. W. Wang and J. A. Feng, "NdPASA: A novel pairwise protein sequence alignment algorithm that incorporates neighbor-dependent amino acid propensities," Proteins-Structure Function and Bioinformatics, vol. 58, pp. 628-637, Feb 15 2005. [38] W. Li, et al., "NdPASA: a pairwise sequence alignment server for distantly related proteins," Bioinformatics, vol. 21, pp. 3803-3805, Oct 1 2005. [39] L. J. McGuffin, et al., "The PSIPRED protein structure prediction server," Bioinformatics, vol. 16, pp. 4045, Apr 2000. [40] J. Soding, et al., "The HHpred interactive server for protein homology detection and structure prediction," Nucleic Acids Res, vol. 33, pp. W244-8, Jul 1 2005. [41] A. Gattiker, et al., "ScanProsite: a reference implementation of a PROSITE scanning tool," Appl Bioinformatics, vol. 1, pp. 107-8, 2002.
39
Zhuhai, China, September 2–4, 2011
[42] N. Aronszajn, "Theory of Reproducing Kernels," Transactions of the American Mathematical Society, vol. 68, pp. 337-404, 1950.
2011 IEEE International Conference on Systems Biology (ISB) 978-1-4577-1666-9/11/$26.00 ©2011 IEEE
40
Zhuhai, China, September 2–4, 2011