Proceedings of the SEM Annual Conference June 7-10, 2010 Indianapolis, Indiana USA ©2010 Society for Experimental Mechanics Inc.
Nucleation and Propagation of Portevin-Le Châtelier Bands in Austenitic Steel with Twinning Induced Plasticity Louis G. Hector, Jr. Chemical Sciences and Materials Systems Laboratory General Motors R&D Center 30500 Mound Road Warren, MI 48090
[email protected] Pablo D. Zavattieri School of Civil Engineering School of Mechanical Engineering (By Courtesy) 550 Stadium Mall Drive Purdue University West Lafayette, IN 47907-2051
[email protected] ABSTRACT Twinning induced plasticity (TWIP) steels have high manganese content and exhibit extreme strain hardening and elongation. Tensile flow curves show serrations due to dynamic strain aging associated with solute-dislocation interactions. Highly inhomogeneous plastic flow is manifested by Portevin-Le Châtelier (PLC) band nucleation and propagation. In this research, TWIP steel tensile specimens were quasi-statically deformed to fracture at room temperature. Images of one specimen surface were recorded with a variable framing rate high speed digital camera and custom image acquisition software. A digital image correlation technique was used to compute incremental strain rate maps that enabled study of PLC band nucleation and propagation. The impact of tensile specimen geometry on the location of band nucleation along the specimen gauge section was also explored. Fracture surfaces and material chemistry were examined with SEM and energy dispersive mapping. KEY WORDS: Austenitic steel, twinning, manganese, Portevin-Le Châtelier (PLC) effect, dynamic strain aging (DSA), digital image correlation (DIC), uniaxial tensile tests INTRODUCTION Austenitic steels with twinning induced plasticity (TWIP) have attracted interest as potential structural materials for transportation industries [1] due to extreme ductility and hardening. The 150-400 MPa yield strengths of these materials are relatively low, similar to conventional high strength low alloy (HSLA) steels and the lower strength dual-phase (DP) and transformationinduced plasticity (TRIP) steels. Unique to TWIP steels is a high manganese (Mn) content. Manganese tends to stabilize austenite, although its role in the TWIP microstructure is still a subject of active research [2]. Twinning promotes retention of the austenitic microstructure, but competes with dislocation glide by impeding dislocation motion at twin boundaries and other dislocation-dislocation interactions (e.g. forest hardening). Twin formation is associated with a low room temperature stacking fault energy (SFE). A low SFE inhibits dislocation cross slip, a 2 mechanism referred to as “dynamic Hall-Petch”. A 25 mJ/m critical stacking fault energy is thought to be necessary for twinning. However, twinning likely occurs over a much broader range 2 2 of SFE, e.g. 18mJ/m < SFE < 50-80mJ/m .
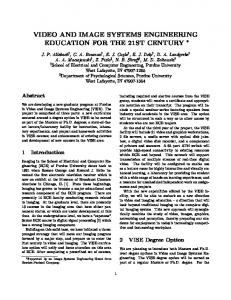
Austenitic steels often exhibit dynamic strain aging (DSA), a form of unstable plastic flow found in dilute metal alloys [3-8] and non-metals [9, 10]. Portevin-Le Châtelier bands (or the PLC effect) and serrated flow curves are common manifestations of DSA which occurs over a very wide temperature range [11]. The bands, which are regions of localized plasticity, are generically classified as: Type A (continuously propagates across the gage length of a tensile specimen); Type B (discontinuously propagate or “hop”); and Type C (no spatial correlation). A common explanation of DSA in metals centers on dislocation-solute interactions in which solute atoms diffuse to dislocations temporarily arrested at obstacles (or trapped by the local energy landscape in the lattice) thereby increasing the stress required to release the dislocations [12]. Following an aging time, the dislocations are suddenly released and the process repeats elsewhere. First reported in austenitic steel by Tamhankar et al. [13] in 1958, DSA has been the subject of numerous theoretical and experimental studies. Dynamic strain aging and the PLC effect in TWIP steels have been the focus of several recent investigations [14-17]. Differences in PLC band type have been noted due to testing temperatures and alloy chemistries, especially Mn content. Accurate measurement of PLC band nucleation and propagation represents a significant challenge in experimental mechanics due to the localized nature of serrated flow. Great care must be exercised with the rate of data acquisition during testing due to rapid fluctuation of uniaxial load-time records beyond a critical strain required for the onset of DSA. In the present paper, a recently developed technique for variable framing rate digital image capture [18] is applied to investigate PLC band nucleation and propagation in austenitic TWIP steel in quasistatic, room temperature uniaxial deformation. Of main interest is the location of PLC band nucleation along the tensile specimen gage section and the type of bands per the generic classification above. Displacements and strain fields are computed with digital image correlation (DIC). Band propagation is tracked with contours of incremental axial strain rate. We demonstrate that contrary to common belief, PLC band nucleation does not always occur at the gripper ends of a tensile specimen which suggests an important influence of local fluctuations in TWIP steel texture. MATERIAL TWIP steel sheet, with a nominal thickness of 1.5mm, was acquired from POSCO in Korea. A chemical analysis, detailed in Ref. [14] indicated 17.2wt% Mn. Tensile properties are also found in Ref. [14]. Figure 1a is an SEM image of one fracture surface from a straight gage section tensile specimen. Ductile fracture resulted from microvoid coalescence. Horizontal channels, such as that near the top of Fig. 1a, were noted in each of the fracture surfaces investigated. Common to most of the fracture surfaces analyzed were inclusions such as those denoted by “a” and “b” in the image. Fracture initiation may have in fact occurred at each inclusion. Surrounding each inclusion is a void. Energy dispersive spectroscopy (EDS) was used to probe the chemistry of TWIP fracture surfaces from the tensile tests, with particular attention to inclusion chemistry. Figure 1b is an EDS plot which shows a chemical breakdown of inclusion “a”. As expected, Mn and Ti are found along with alkaline earth metals such as Ca and Mg. High levels of Al as well as S in “a” are also noted. Similar observations apply to particle “b.” EXPERIMENT Tensile Specimen Geometry The straight gage tensile specimen geometry is shown in Fig. 2. The gray scale contrast pattern on the gage section consists of black and white spray paint droplets. Specimens were given a light polish immediately prior to testing so as to ensure paint adhesion up to fracture.
(b) (a) Fig. 1. (a) Scanning electron microscope image of TWIP tensile specimen fracture surface (b) Energy dispersive spectroscopy results of small particle “a” in (a).
Fig. 2. Tensile specimen geometry.
Miniature Tensile Stage The miniature screw-driven tensile stage used in this research was custom manufactured by Kammrath-Weiss in Dortmund, Germany. The tensile stage cross-head speed and direction are set with external controller hardware. Each test was conducted at an average constant crosshead speed of 13µm/s which corresponds to a nominal (logarithmic) strain rate in the 0.0005 -1 0.001 sec range. Only the load reading from the load cell was necessary to compute true stresstrue strain curves since displacement fields were computed during the post processing step with the DIC algorithm. Camera A Phantom 9.0 high speed digital camera from Vision Research was used to record 1632×1200 bitmap images (each 5.7Mbyte, 14µm/pixel resolution) of the entire gage section surface of each tensile specimen during testing. As many as 1400 images were captured in the 12GByte camera buffer during tensile tests in which the specimens were continuously elongated. A Nikon 105mm telecentric lens set at a 2.8 f-stop was used for all tests. Three lens extenders provided an adequate field of view of the tensile specimen gage section through adjustment of the image magnification (about 100X).
Variable Rate Image Acquisition Algorithm A custom image acquisition algorithm written in the DASYLab code allowed for variable rate digital image acquisition. Acquisition rate was dictated by user-selected tensile load increment/decrement, displacement increment and time increment thresholds between successive images stored in the camera buffer. This required the DASYLab code to continuously monitor the analog signals from the load and displacement transducers during a test. Hence, more images could be captured and stored to the camera buffer during periods of a test when loads were increasing (or decreasing) rapidly over small displacements. Alternatively, during periods when loads changed very minimally with increasing displacement, fewer images were captured. Of particular importance was the capture of an adequate number of images during periods of PLC band activity as indicated by local fluctuations in the load-time record. Nominal framing rates over the duration of a test were approximately 0.3-6 f/sec, with the peak framing rate occurring during elastic loading and just prior to fracture. Additional details may be found in Ref. [18]. Digital Image Correlation The SDMAP3D software detailed in Ref. [19] was used to post-process displacements, strains, and incremental strain rate fields from the images of a tensile specimen gage section surface as recorded during each test. The approach is similar to that of Sutton et al. [20], Bruck et al. [21], and Vendroux and Knauss [22]. An affine deformation mapping function with six parameters (constant displacement gradients) is employed for subset deformation. A bicubic spline interpolation is used for subpixel grayscale values. While various correlation algorithms are available, that of Sutton et al. [20] was used. This was found to be faster than that detailed in Ref. [22]. In addition, the strains are computed from a finite deformation formulation in terms of the displacement gradients. These are obtained through a post-DIC processing routine (a moving least squares smoothing or filtering routine) of the grid displacements. The errors in local in-plane displacements, rigid body rotation, and strain measurements are estimated to be 0.02 pixels, 0 0.03 and 30µm/m, respectively. RESULTS AND DISCUSSION In this study, only Type A PLC bands were observed. Band nucleation occurred either at a gripper end (case 1) or at (or near) the center (case 2) of a tensile specimen gage section. In both cases, indication of PLC band activity in the load-time records first appeared just beyond a 0.3 true strain. Here, we examine a representative result from case 2 since this behavior is evidently less common than case 1. Band nucleation and propagation were examined via contours of -1 incremental axial true strain rate, ε& l (sec ). Contour values were computed by dividing the incremental true strains with the time step between the associated sequential images. Figure 3a is temporal sequence of strain contour maps that shows the nucleation and propagation of Type A bands at the center of specimen gage section. The red contours correspond to peak strain rates within each band and hence the greatest localized dislocation activity. The very first band appears around 850 sec into the test and propagates towards the left gripper end. After a period of nearly 30 sec, a second band nucleates and propagates towards the right gripper end. This process continues until 1600 sec into the test at which point band nucleation switches to the right gripper end as indicated by the very small red contour patch at the very bottom of Fig. 3a. Figure 3b shows the corresponding load-time record, while Fig. 3c is a zoom-in of the boxed portion in Fig. 3b. Here, the humps correspond to PLC band nucleation. Figure 3d shows substantial hardening is suggested in the computed true stress-true strain curve from DIC calculations. Figure 3e is a zoom-in of the boxed portion on Fig. 3f. Instead of the humps in Fig. 3c, PLC band nucleation is denoted by step-like serrations. Tapered specimens were also examined (see Ref. [14] for more detail) and band nucleation was neither limited to the region of the taper at the gage section center nor to either gripper end. Rather, there were some instances where band nucleation occurred at locations along the gage length that were intermediate to these regions.
Fig. 3. Type A PLC Bands in TWIP tensile specimen. (a) Temporal sequence showing the nucleation and propagation of 12 bands near the center of a tensile specimen gage section (see Fig. 2). Note the time [sec] is total time elapsed since the start of the test. (b) Load-time record. (c) Zoom-in of load-time record within boxed region in (b) showing serrations or humps” due to PLC bands. (d) True stress-true strain curve showing hardening. (e) Zoom-in of true stress-true strain curve within boxed region in (d) showing step-like serrations due to PLC band nucleation. Figure 4 shows additional details at the later stage of the test from which the results in Fig. 3a were computed. Grid lines have been added to the two load-records to emphasize the superimposed open circles. Each circle corresponds to a captured image in the camera buffer during the test per user-selected tensile load increment/decrement, displacement increment and time increment thresholds. Note that a simple adjustment of these parameters could in fact have easily increased the number of captured images by an order-of-magnitude or more (for example). The blue lines with a single arrow head point from PLC band nucleation in the load-time records to corresponding strain rate contour maps in the time sequence at the right. Figure 5 is a schematic of a typical true-stress curve. Here, band nucleation occurs at each serration or jump in the stress; this coincides with a peak in each hump in the load-time record in Fig. 3c. Propagation of an individual band occurs between each serration. PLC band kinematics cannot be fully appreciated from the sequence of images showing the total strain or strain rate contour maps since many of the consecutive images were not taken at equal intervals of time. In order to investigate band kinematics, we kept track of the material point at which the strain rate field reached its maximum point. Figure 6 shows a schematic of this process. The maximum strain rate value (or strain rate peak) takes place at the material point
Fig. 4. Captured images denoted by open circles on portions of the load-time record from the time sequence in Fig. 3. Arrows link specific times associated with band nucleation to strain rate contours maps.
Fig. 5. Schematic of a true stress-true strain curve showing that band nucleation occurs at serrations or steps. Band propagation occurs between the steps, as indicated. The material locally hardens during band propagation. with coordinate x. Since the strain rate peak always occurs along the middle line of the specimen, the y-coordinate is not needed for this analysis (in other words, we assume that the bands propagate along the axial direction of the specimen gage section).
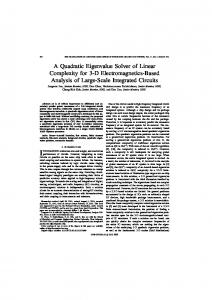
Figure 6: Position of the strain rate peak of a PLC band as it travels through a tensile specimen gage section (in mm) as a function of the applied strain
(a)
(b)
Figure 7: (a) Bands generated at the grips and propagating through the gage (b) Bands generated in the middle and propagate to the ends, including one last band generated at the end that propagates to the other end. Two distinct cases are shown in Figs. 7a and 7b where the position of the strain rate peak is plotted against the applied strain. Note that the cross-head speed in both tests was δ=13 µm/sec. Each line describes the “path” of the band, as the specimen is elongated in tension, with the applied strain, ε. The first case (Fig. 7a) involves band nucleation at the grippers, with subsequent propagation from left to right through the gage section. Figure 7b shows the case in which the first four bands nucleate in the middle of the specimen and travel to either gripper end (as described in Figs. 3 and 4). Interestingly, the paths associated with band nucleation at the center of the gage section show an initial non-linear variation with applied strain (unlike the behavior shown in Fig. 7a). The fifth band nucleated at a gripper end and, as is the case with all of the bands in fig. 7a, traveled the length of the gage section. More details on the band propagation analysis can be found in Ref. [14].
SUMMARY REMARKS A technique based upon variable image capture rate has been used to investigate PLC band nucleation and propagation during quasi-state, room temperature tensile testing of austenitic TWIP steel. Band nucleation was found to occur either at one gripper end (case 1) or at (or near) the center (case 2) of the gage section of miniature TWIP tensile specimens. Detailed analysis of case 2, the less commonly observed case, revealed that band nucleation occurs at the crests of humps in the load-time record. These correspond to jumps or serrations in the true stress-true strain curve. It expected that additional PLC band types will be observed at higher (or lower) testing temperatures than that considered herein, and with different Mn content. REFERENCES [1] Horvath C.D. and Fekete, J.R. Opportunities and Challenges for Increased Usage of Advanced High Strength Steels in Automotive Applications, Proceedings of International Conference on Advanced High Strength Sheet Steels for Automotive Applications, 3-10, June 2004. [2]
Chen, L. Kim, H.-S. Kim, S.-K. and De Cooman, B.C., Localized Deformation due to Portevin-Le Châtelier Effect in 18Mn–0.6C TWIP austenitic steel, ISIJ International 47, 18041812, 2007
[3]
Kumar S. and Pink, E., Dynamic Strain Aging in a Tungsten Heavy Metal, Scripta Mat. 35, 1047-1052, 1996.
[4]
Ziegenbein, A., Hähner P., and Neuhäuser, H., Correlation of Temporal Instabilities and Spatial Localization during Portevin-Le Châtelier deformation of Cu-10at.% Al and Cu15at.% Al, Computational Materials Science 19, 27-34, 2000.
[5]
Robinson, J.M. and Shaw, M.P., Microstructural and Mechanical Influences on Dynamic Strain Aging Phenomena, Int. Materials Reviews 39, 113-121, 1994.
[6]
Trojanová, Z., Lukác, P., Kainer, K.U., and Gärtnerová, V., Dynamic Strain Ageing During Stress Relaxation in Selected Magnesium Alloys Containing Rare Earth Elements, Advanced Eng. Materials 7, 1027-1032, 2005.
[7]
Yakes, J.A., Li, C.-C., and Leslie, W.C., The Effects of Dynamic Strain Aging on the Mechanical Properties of Several HSLA Steels, SAE Trans. (SAE 790009), 44-59, 1980.
[8]
Keh, A.S., Nakad, Y., and Leslie, W.C., Dynamic Strain Aging in Iron and Steel, in Dislocation Dynamics, McGraw-Hill, 381-408, 1968.
[9]
Dalla Torre, F.H., Dubach, A., Siegrist, M.E., and Löffler, J.F., Negative Strain Rate Sensitivity in Bulk Metallic Glass and its Similarities with Dynamic Strain Aging effect during Deformation, Appl. Phys. Lett. 89, 091918:1,3, 2006.
[10] A. Gallardo-López, D. Gómez-Garcia, A. Domínguez-Rodríguez and L. Kubin, Portevin-Le Châtelier Effect in Y2O3-ZrO2 Single Crystals, Scripta Mat. 51, 203-207, 2004. [11] Skoczen, B., Bielski, J., Sgobba, S., Marcinek, D., Constitutive Model of Discontinuous Plastic Flow at Cryogenic Temperatures. Int. J. Plasticity, published on-line, doi:10.1016/j.ijplas.2010.02.003, 2010. [12] Curtin, W.A., Olmsted. D.A., and Hector, Jr., L.G., A Predictive Mechanism for Dynamic Strain Ageing in Aluminum–magnesium Alloys, Nature Materials 5, 875-880, 2005. [13] Tamhankar, R., Plateau, J., and Crussard, C., Etude de la Déformation Plastique a Chaud d’un fer Doux et d’une Austénite Stable au Nickel-chrome, Rev. Métallurgie 55, 383-400, 1958. [14] Zavattieri, P., Savic, V., Hector, Jr., L.G. Fekete, J.R., Tong, W., Xuan, Y. Spatio-temporal Characteristics of the Portevin-Le Châtelier Effect in Austenitic Steel with Twinning Induced Plasticity. Int. J. Plasticity 25, 2298-2330, 2009.
[15] De Cooman, B.C., Chen, L., Soo Kim, H.-S. Estrin, Y., Kim, S.K., Voswinckel, H., State-ofthe-Science of High Manganese TWIP Steels for Automotive Applications, in Microstructure and Texture in Steels and Other Materials, Springer, London, Chapter 10, 165-183, 2010. [16] Renard, K., Ryelandt, S., Jacques, P.J., Characterisation of the Portevin-Le Châtelier effect affecting an austenitic TWIP steel based on digital image correlation. Mat. Sci. Eng. A 527, 2969-2977, 2010. [17] Chen, L., Kim, H.-S., Kim, S.-K., and De Cooman, B.C., Localized Deformation due to Portevin-Le Châtelier Effect in 18Mn–0.6C TWIP Austenitic Steel, ISIJ International 47, 1804-1812, 2007. [18] Savic, V., Hector, Jr., L.G., Fekete, J.R., Digital Image Correlation Study of Plastic Deformation and Fracture in Fully Martensitic Steels, Exp. Mech. 50, 99-110, 2010. [19] Tong, W., 2005, An Evaluation of Digital Image Correlation Criteria for Strain Mapping Applications, Strain 41, 167-175, 2005. [20] Sutton, M. A., McNeill, S. R., Jang, J., and Babai, M., Effect of Sub-pixel Image Restoration on Digital Correlation Error Estimates. Opt. Eng. 27, 870–877, 1988. [21] Bruck, H. A., McNeill, S. R., Sutton, M. A. and Peters, W. H., Digital Image Correlation using Newton-Raphson Method of Partial Differential Corrections. Exp. Mech. 29, 261–267, 1989. [22] Vendroux, G. and Knauss, W. G., Submicron Deformation Field Measurements, Part 2. Improved Digital Image Correlation. Exp. Mech. 38, 86–91, 1988.