Abstract. Surveys of natural habitats often indicate that native and exotic species
richness are positively correlated at large scales and negatively correlated at ...
Ecology, 85(12), 2004, pp. 3215–3222 q 2004 by the Ecological Society of America
NULL MODELS OF EXOTIC INVASION AND SCALE-DEPENDENT PATTERNS OF NATIVE AND EXOTIC SPECIES RICHNESS JASON D. FRIDLEY,1,5 REBECCA L. BROWN,2,3
AND
JOHN F. BRUNO4
1Department
of Biology, The University of North Carolina, Chapel Hill, North Carolina USA 27599 Curriculum in Ecology, The University of North Carolina, Chapel Hill, North Carolina USA 27599 3The Academy of Natural Sciences, Patrick Center for Environmental Research, Philadelphia, Pennsylvania USA 19103 4Department of Marine Sciences, The University of North Carolina, Chapel Hill, North Carolina USA 27599 2
Abstract. Surveys of natural habitats often indicate that native and exotic species richness are positively correlated at large scales and negatively correlated at small scales. The small-scale relationship is often presented as evidence that native richness can repel invasion or conversely that exotic invasions can reduce native diversity. The larger scale pattern has been interpreted as evidence of the importance of facilitation, variable habitat quality, propagule supply, and other ecological phenomena. However, these explanations fail to consider expected native–exotic richness relationships under a null model assuming no species interactions. We show via simulation that the null expectation for a randomly assembled community is a negative relationship between native and exotic species richness at the smallest scales and, when plots vary in total richness, a positive relationship at larger scales. We outline a procedure to compare observational data to this null expectation using a permutation test of labels of species origin (native or exotic). Our use of this technique on plant community data indicates that patterns of native and exotic richness are remarkably similar to those generated by a null model. We argue that a null model approach is needed to evaluate whether observed native–exotic richness data deviate significantly from expected patterns generated by sampling and statistical artifacts. Key words: assembly rules; ecosystem functioning; invasion biology; invasion frequency; permutation test; plant diversity; riparian plant communities; scale dependence; strandline plant communities.
INTRODUCTION Investigations of the causes and consequences of exotic invasions (Mack et al. 2000) are of great importance in contemporary biology considering the potential threats to economies and ecosystems (Usher et al. 1988, Lodge 1993, Cronk and Fuller 1995). Of particular interest is the widely cited idea that ecosystems of greater native richness have an enhanced ability to repel invasion by exotics. This hypothesis was originally put forth by Elton (1958) and has since been evaluated by considerable observational, experimental, and theoretical research (see reviews by Levine and D’Antonio 1999, Hector et al. 2001, Shea and Chesson 2002). Eltonian theory is based on the presumptive ‘‘niche filling’’ properties of high native richness, whereby communities of greater diversity exploit more available resources and leave fewer open niches for invader colonization (MacArthur 1970, Levine and D’Antonio 1999). Because this property of native richness is based on interactions between individuals, the resulting negative relationship between native richness and invasion success should be most apparent when measured at the relatively small scale of a focal or-
5
E-mail:
[email protected]
ganism and its immediate neighbors (Levine 2000, Shea and Chesson 2002, Brown and Peet 2003). Available evidence is consistent with this theory; nearly all studies reporting a negative relationship between native species richness and invasion success are based on small-scale experiments (Hector et al. 2001) or natural surveys of native and exotic species richness at small scales (Brown and Peet 2003). At scales larger than local neighborhoods, natural patterns of native and exotic species richness have generally been shown to be positive, particularly in field surveys (Stohlgren et al. 1998, 2002, 2003, Lonsdale 1999, Sax 2002; Bruno et al., in press). At large scales, confounding factors such as variation in resource availability (Stohlgren et al. 1998, 2002, Kalkhan and Stohlgren 2000, Shea and Chesson 2002) or rates of propagule supply (Levine 2000, Brown and Peet 2003) may mask any negative influence of native richness on invasion success. High native richness may also facilitate exotic invasion by means of habitat amelioration or protection from pests or predators (Richardson et al. 2000, Bruno et al. 2003). This change in the relationship between native richness and invasion success with scale, from positive at large scales to negative at small scales, is often taken as evidence that niche partitioning and competitive exclusion are structuring native–exotic richness patterns at small scales, and that at larger
3215
3216
JASON D. FRIDLEY ET AL.
scales environmental variation and exogenous immigration factors are more important drivers of community structure (Levine 2000, Shea and Chesson 2002, Brown and Peet 2003, Byers and Noonburg 2003). Shea and Chesson (2002) and Byers and Noonburg (2003) have shown how negative within-site native–exotic richness relationships can turn into positive among-site relationships given sufficient differences in site characteristics. Change in native–exotic richness relationships with scale is not limited to within- vs. amongsite comparisons, however; Brown and Peet (2003) found a similar pattern in an among-site comparison of communities sampled at different quadrat sizes. Observational studies of the native richness–invasibility paradigm generally assume that the null expectation of the native–exotic richness relation is no relationship—a slope of zero. However, randomly assembled communities often display emergent patterns that initially seem to support theoretical predictions, but are actually driven by statistical or sampling artifacts (Strong 1980). Failure to consider the patterns produced by null models can lead researchers to mistakenly attribute natural patterns to species interactions or other ecological processes (Connor and Simberloff 1983, Gotelli and Graves 1996). For example, in smallscale surveys where each sample plot contains relatively few individuals, constraints on total species richness imposed by low overall density may artificially constrict native–exotic richness values and beget spurious correlations that may be interpreted as native– exotic interactions. At larger scales, plots tend to significantly vary in total richness (regardless of the mix of natives or exotics) and species-rich plots are more likely to include both more natives and exotics by chance. This may result in a positive native–exotic richness relationship, regardless of native–exotic interactions or other environmental properties. Thus, for predictions of invasion theory at different spatial scales to be accurately evaluated in nonexperimental studies, observational native–exotic richness data must be compared to an appropriate null model. In this paper, we illustrate the necessity of using a null model approach for evaluating relationships between native and exotic species richness based on descriptive field survey data. We first employ a simulation model of random community assembly to show that artifactual negative native–exotic richness relationships emerge at small sampling scales, even when native and exotic species do not interact. We also demonstrate how such relationships turn strongly positive at larger scales when plots vary in total species richness. Second, we apply a null model approach to two data sets from plant communities to determine whether observed relationships between native and exotic richness significantly depart from a null expectation based on random community assembly with respect to species origin (native or exotic).
Ecology, Vol. 85, No. 12
MATERIALS
AND
METHODS
We performed simulations to evaluate patterns of ‘‘native’’ and ‘‘exotic’’ richness in randomly assembled communities of different sample sizes. SPlus 6.0 (Academic Site Edition Release 2, Insightful Corporation, Seattle, Washington, USA) programming code for these simulations is given in Supplement 1. The basic simulation worked as follows. First, a ‘‘species pool’’ was created with total species richness (20–100) determined by a uniform random draw and abundance per species determined by random draw from a lognormal distribution (mean abundance 5 5000 individuals). For the results presented here we chose to divide each species pool into proportions of 75% native, 15% exotic, and 10% ‘‘blank’’ species, regardless of total richness. ‘‘Blank’’ species added realism by indicating open space and were not counted in the final native–exotic tally. In practice, the proportion of natives to exotics in the species pool and the relative abundance distribution of species in the pool did not qualitatively influence our results (see Appendix A). Next, we randomly sampled individuals from this species pool and assigned them to a simulated sample ‘‘quadrat.’’ Our sample quadrats include six sample sizes, representing 5, 10, 20, 50, 100, and 800 draws of individuals from the species pool. For simplicity, each individual among all species inhabited equal area; given a constant density of individuals (including ‘‘blanks’’), each of our quadrat sample sizes can be readily translated into sample ‘‘area,’’ where 800 individuals would be a sampling scale 160 times larger than that of five individuals. For each quadrat, we calculated the number of native and exotic species. We then repeated this procedure 100 times for each quadrat size, generating a new species pool each time, to create distributions of native–exotic richness values at different sample sizes. By keeping total density per quadrat constant for each representative area, we did not attempt to remove competition per se as a determinant of species richness in the simulated communities—greater abundance of any one species reduced the abundance of another species (native or exotic), and thus total richness was constrained by the total number of individuals in the sample. However, there was no mechanism in our model for native richness per se to reduce exotic richness; i.e., 10 native individuals had the same ability to ‘‘exclude’’ exotics regardless of whether they represented one or 10 species. Competition among individuals was thus neutral sensu Hubbell (2001)—all individuals were equivalent (each taking up one space) and the richness of natives or exotics was not related to the usurpation of space. Thus, our model of random community assembly was specifically designed to determine how a lottery among identical individuals for limited space could influence patterns of native and exotic species richness, given different spatial constraints.
December 2004
NULL MODELS AND INVASION PATTERNS
3217
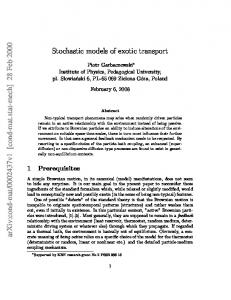
FIG. 1. Simulation of the relationship between native and exotic species richness under a null model of random community assembly. Samples sizes (N), equivalent here to spatial scale, are indicated at the top of each graph. Solid lines are leastsquares regressions of 100 replicates; dashed lines indicate constraint envelopes, above which no values are possible due to progressively smaller sample sizes (none shown for the 800-sample simulation). Axes of all graphs except that of the top left are scaled from zero to the corresponding sample size. The statistic (r) is the correlation coefficient; NS means not significant. Data values for graphs of N 5 10 and N 5 5 are jittered for clarity.
We subjected empirical native and exotic species composition data from two plant community studies to permutation tests to evaluate whether real patterns of native and exotic richness at different scales were different than a null expectation based on random community assembly with respect to species origin. Our randomization was based specifically on ‘‘native’’ and ‘‘exotic’’ labels of each species in the species pool. By maintaining the total richness and actual species composition of each survey quadrat and shuffling only native–exotic labels of constituent species, our null model allowed us to isolate the statistical constraints on native and exotic richness patterns in real communities of varied spatial resolution. The first data set is from riparian plant communities of the Southern Appalachians (North Carolina and Tennessee, USA), described more fully in Brown and Peet (2003). Vascular plant composition was sampled in fully nested quadrats with sample resolutions ranging from 0.01 m2 to 1000 m2, following the protocol of the Carolina Vegetation Survey (Peet et al. 1998). Quadrats were stratified across a flooding gradient along three river systems. We employed four sampling scales from this study in our analysis: 100, 1, 0.1, and 0.01 m2. To avoid spatial pseudoreplication, we randomly chose only one nested subplot of each scale from each available full plot, for
sample sizes of 119, 119, 113, and 106 for scales of 100, 1, 0.1, and 0.01 m2, respectively. The source of species origin information was the USDA Plants database (U.S. Department of Agriculture 2002). A second data set is from coastal strandline plant communities in Narragansett Bay (Rhode Island, USA) described in Bruno et al. (in press). This data set includes 24 500 m2 (100 3 5 m) quadrats in which native and exotic vascular plant species richness were measured. Species origin is based on Gleason and Cronquist (1991) and Gould et al. (1998). We conducted a separate permutation test for each study and sampling scale. For each permutation, we randomly reassigned whether each species was ‘‘native’’ or ‘‘exotic’’ for the full species pool, keeping constant the total number of natives and exotics in the overall pool and the total species richness of each sample quadrat. In this way we created communities that were assembled at random with respect to the composition of natives and exotics. We then re-tallied the number of native and exotic species in each quadrat and calculated the correlation coefficient (r) and the slope of the least-squares regression line (s) between the number of native and exotic species in each quadrat. We repeated this process 499 times to generate ‘‘null’’ r and s distributions to compare to the r and s statistics
JASON D. FRIDLEY ET AL.
3218
Ecology, Vol. 85, No. 12
FIG. 2. Observed vs. null relationships between native and exotic species richness from riparian plant communities, sampled at four spatial scales. Lines are least-squares regressions of the mean for the observed data (solid black lines) and the permuted (null model) data (dashed gray lines). Data values for the smallest three scales are jittered for clarity.
of the real data. One-tailed P values were calculated as the proportion of permutation-derived values that were as extreme or more extreme than the observed test statistic (Legendre and Legendre 1998). RESULTS The relationship between native and exotic species richness in the simulated, randomly assembled communities depended strongly on sample size (i.e., spatial scale; Fig. 1). At sample sizes (scales) greater than 50 individuals (including ‘‘bare’’ patches), native and exotic species richness were positively correlated; this correlation turned significantly negative at the smallest scales. With random assembly, the ratio of native richness to exotic richness in a local community is proportional to this ratio in the species pool if there are no constraints on total local richness (as occurs in the 800-sample size simulation: 15/75, the slope of the regression line). As the total number of sampled individuals declines, species richness is artificially constrained by an insufficient number of individuals in the sample. In our simulation, at sample sizes of 20 individuals and less, this constraint exerted greater control over the correlation between native and exotic species richness than the positive influence of different species pool sizes. At the smallest sample sizes, concurrent high values of native and exotic richness were impossible and a clear negative constraint envelope emerged (Fig. 1).
The observed relationship between native and exotic species richness in the riparian plant community data depended on sampling scale (Fig. 2, Table 1). Significantly positive relationships at the 100- and 1-m2 scales turned into a nonsignificant relationship at the intermediate 0.1-m2 scale and a significantly negative relationship at the smallest 0.01-m2 scale (Table 1). Similarly, the null model, with native–exotic labels randomly permuted, displayed a positive relationship between native and exotic richness at the 100- and 1-m2 scales that became nonsignificant at the smaller two scales (Table 1). When we compared the observed correlation coefficients to that of the null model, they were equal at all but the 100-m2 scale (Table 1). The slope of the observed native–exotic richness relationship was different from the null model only at the smallest scale of 0.01-m2, where it was slightly more negative (Fig. 2). Taken together, comparisons of observed and null relationships between native and exotic richness reveal little departure of the real data from that of the null model, except for a slight deviation in slope at the smallest scale and a significantly worse fit for observed data at the largest scale (Fig. 2). Native and exotic species richness were positively correlated in 24 500-m2 sites along coastal strandline communities in Narragansett Bay, Rhode Island (r 5 0.49, P , 0.02; Fig. 3). However, this was precisely the strength and nature of the relationship between native and exotic richness expected under a null model
NULL MODELS AND INVASION PATTERNS
December 2004
3219
TABLE 1. Observed and null relationships between native and exotic species richness from a riparian plant community sampled at four spatial scales.
Scale (m2) 100 1 0.1 0.01
Observed relationship
Observed vs. null
Null relationship
N
r
Slope
r
Slope
r
Slope
119 119 113 106
0.439*** 0.223* 0.029 20.225*
0.170 0.052 0.012 20.137
0.765*** 0.337*** 0.142 20.125
0.159 0.075 0.053 20.063
***
NS NS NS
NS NS NS
*
Notes: Observed correlation coefficients and regression slopes of the native–exotic richness relationship at each scale are followed by those statistics determined under a null model, where correlation coefficients and slopes are calculated as means of those from 499 random permutations of native–exotic labels. The final two columns are one-tailed tests of whether observed correlation coefficients and slopes significantly differ from the null model, with P values determined by the proportion of permutation-derived values that are as extreme or more extreme than the observed statistic. * P , 0.05; *** P , 0.001.
where native–exotic labels were randomly permuted (Fig. 3); the null model r value was 0.49, significantly higher than zero (P , 0.001) but statistically equal to the observed r value (P . 0.9). Thus, there was no evidence that native or exotic species identities were
FIG. 3. Observed vs. null relationships between native and exotic species richness in coastal strandline plant communities. (A) Native vs. exotic richness in 24 sampling locations, with least-squares regression line (r 5 0.49). (B) The probability density of r under 499 permutations of the same data where native–exotic labels for each species are randomly permuted. The vertical line is the observed r.
influencing community structure in coastal strandline plant communities. DISCUSSION Our simulations and null models applied to empirical plant community data indicate that the theoretically predicted scale-dependent patterns of native and exotic richness may not differ from a null expectation based on random community assembly with respect to species origin. These results question the general support for the diversity–invasibility paradigm and suggest that a null model approach is necessary to adequately test current hypotheses of invasion biology. The simulations indicate that in randomly assembled communities the relationship between native richness and invasion success changes with sampling scale in exactly the manner predicted by the diversity–invasibility paradigm: a negative relationship at small scales and a positive relationship at large scales. Since this is the expected outcome in the absence of interactions between native and exotic species, similar patterns based on field sampling cannot be taken as evidence of such interactions or as support for the invasion paradigm. In communities represented by few individuals, the fundamental constraint on total richness imposed by low individual density inevitably leads to a negative relationship between native and exotic richness, regardless of other mechanisms that may be driving community assembly. Fig. 4 illustrates how this constraint controls native–exotic richness relationships at small scales and potentially confounds their interpretation. When the ratio between total sampled individuals and total richness of the species pool is high, the null relationship is defined by the ratio of exotics to natives in the species pool (here, 15/75). When the total number of sampled individuals becomes lower than the total number of species in the species pool, however, concurrent high values of native and exotic richness are precluded, constraining the set of possible values to the lower left portion of the graph and leading to a
3220
JASON D. FRIDLEY ET AL.
Ecology, Vol. 85, No. 12
FIG. 4. Illustration of the influence of small sample sizes (small survey scales) on the observed relationship between native and exotic species richness. The stippled area indicates all possible values of native and exotic richness when a species pool of 75 natives and 15 exotics is sampled. Dashed lines indicate negative constraint envelopes that emerge if the number of sample individuals is small relative to the size of the species pool.
negative null relationship. If this constraint is ignored, it may be spuriously interpreted as a biological phenomenon. The spatial resolution at which this density constraint becomes significant is dictated by the overall density of individuals and the relative size of the corresponding species pool, which vary widely among habitats. For our riparian plant community data, negative relationships emerged in a null model where native and exotic labels were subject to random permutation at the scale of 0.01 m2 (Fig. 2), an area that typically contains 10 individuals or fewer. This result is in general agreement with our simulation model of random community assembly that produced the same negative relationship in samples of 20 or fewer individuals (Fig. 1). The translation of individual densities to area in real data is complicated by size differences among species and individuals, which is not included in our simulation. However, the inclusion of individual size differences would not qualitatively change the results as long as smaller ‘‘quadrats’’ always contain fewer individuals. Indeed, differences in sizes between species would have the same effect as changing the relative abundance distribution (i.e., some species would get more spaces per individual than others), and the relationships presented in Fig. 1 are robust to different extremes of relative abundance (Appendix A). At sampling scales comprising many individuals (100 or more in our simulation), the constraint on richness imposed by low individual density recedes. Furthermore, a positive relationship between native and exotic species richness is inevitable when communities differ widely in overall richness because species-rich plots are more likely to include more natives and exotics given random community assembly. This effect should increase with the variance in overall richness among sample quadrats. Conversely, for sample quadrats that do not exhibit high variance in total richness, the null expectation at large scales would converge toward a slope of zero. For our empirical data sets the positive relationship emerged from a null model that
randomized native–exotic labels even at relatively small scales (1 m2 and higher, up to 500 m2), suggesting that the effect is strong enough to overwhelm any patterns caused by native–exotic interactions. These results are consistent with the work by Sax (2002) and Stohlgren and colleagues (Stohlgren et al. 1998, 1999, 2002, 2003) documenting positive relationships between native and exotic richness from many different habitats at the 1-m2 scale and larger. However, just as negative relationships between native and exotic richness do not necessarily support the hypothesis that native species richness repels invasion, positive relationships cannot be taken by themselves as conclusive evidence against this hypothesis. For example, it is possible that native species richness could reduce exotic richness even when there is an observed positive native–exotic richness relationship (e.g., competition from certain native species could lower the slope of the overall positive native–exotic richness relationship). In practice, applying a null model approach to the evaluation of an empirical data set is relatively straightforward; we simply randomly reassigned native–exotic labels for each species in our data sets. In both data sets, the relationship between native and exotic species richness was, in nearly all cases, not significantly different from that predicted by the null model, which suggests the assembly of these communities is not strongly influenced by the hypothesized negative effect of native diversity on exotic invasion. One exception was that the observed correlation between native and exotic richness at the 100-m2 scale for the riparian communities was significantly lower than that of the null model, but this may simply indicate the influence of particular species, such as a local dominant, that added noise to the null native–exotic richness relationship. It is possible that failure to detect a difference between observed patterns and those derived from our null model may be due to insufficient statistical power rather than the absence of a diversity–invasibility effect
December 2004
NULL MODELS AND INVASION PATTERNS
(Colwell and Winkler 1984, Kelt et al. 1995). This may be especially true at smaller scales where the null model produces a relatively poor native–exotic richness goodness-of-fit (Fig. 1). However, there was sufficient power to detect a difference between the observed pattern and the null model at the smallest spatial scale (0.01 m2) in the riparian plant communities, where the slope of the relationship between native and exotic richness was slightly more negative than that of the null model. This deviation may be some indication of minimal invasion resistance at the smallest scales. Moreover, because the riparian community was sampled extensively (.100 sample quadrats for all scales) and the power of a null model approach to detect patterns of species interaction in co-occurrence data is strongly influenced by the number of quadrats sampled (Hastings 1987), we feel reasonably confident that the lack of significant difference between observed and null patterns was not due to insufficient statistical power for these data. Although the sample size was poorer for the coastal strandline communities (24 quadrats), the nearly identical values of observed and mean null model correlation coefficients suggests that, even if there is a real negative effect of native diversity on exotic invasion, the effect is very weak. Several researchers have warned of artifacts in species richness patterns at small scales imposed by the constraints of too few individuals (Loreau 2000); our analysis is an extension of null model approaches in ecology that have been applied to patterns of species richness at small scales (Wilson and Watkins 1994, Oksanen 1996, Wilson 2001). In evaluating hypotheses of native–exotic interactions using observational data that are based on patterns of native richness, we strongly recommend use of an appropriate null model before concluding that such interactions exist (Levine 2000, Shea and Chesson 2002) or do not exist (Stohlgren et al. 1999, 2003). ACKNOWLEDGMENTS Collection of field data by R. L. Brown was supported by the University of North Carolina Graduate School and Ecology Curriculum, Sigma Xi, and the Southern Appalachian Botanical Society. Rhode Island strandline plant community sampling was performed in collaboration with C. Kennedy, T. Rand, and M. B. Grant and was funded in part by a National Oceanic and Atmospheric Administration/Office of Ocean and Coastal Resource Management graduate research fellowship to JFB (#NA77OR0218). J. D. Fridley was supported by a Henry H. Dearman Dissertation Fellowship from the University of North Carolina Graduate School. We are grateful to H. Cornell, S. Naeem, S. Lee, M. O’Connor, and an anonymous reviewer for manuscript comments. LITERATURE CITED Brown, R. L., and R. K. Peet. 2003. Diversity and invasibility of Southern Appalachian plant communities. Ecology 84: 32–39. Bruno, J. F., C. W. Kennedy, T. A. Rand, and M. B. Grant. In press. Exotic invasion of a marine plant community: a landscape-scale test of some key predictions and paradigms of invasion biology. Oikos.
3221
Bruno, J. F., J. J. Stachowicz, and M. D. Bertness. 2003. Inclusion of facilitation into ecological theory. Trends in Ecology and Evolution 18:119–125. Byers, J. E., and E. G. Noonburg. 2003. Scale dependent effects of biotic resistance to biological invasion. Ecology 84:1428–1433. Colwell, R. K., and D. W. Winkler. 1984. A null model for null models in biogeography. Pages 344–359 in D. R. Strong, Jr., D. Simberloff, L. G. Abele, and A. B. Thistle, editors. Ecological communities: conceptual issues and the evidence. Princeton University Press, Princeton, New Jersey, USA. Connor, E. F., and D. Simberloff. 1983. Interspecific competition and species co-occurrence patterns on islands: null models and the evaluation of evidence. Oikos 41:455–465. Cronk, Q. B., and J. L. Fuller. 1995. Plant invaders. Chapman and Hall, London, UK. Elton, C. 1958. The ecology of invasions by animals and plants. Methuen and Company, London, UK. Gleason, H. A., and A. Cronquist. 1991. Manual of vascular plants of northeastern United States and adjacent Canada. New York Botanic Garden, Bronx, New York, USA. Gotelli, N. J., and G. R. Graves. 1996. Null models in ecology. Smithsonian Institution Press, Washington, D.C., USA. Gould, L. L., R. W. Enser, R. E. Champlin, and I. H. Stuckey. 1998. Vascular flora of Rhode Island: a list of native and naturalized plants. Rhode Island Natural History Survey, Kingston, Rhode Island, USA. Hastings, A. 1987. Can competition be detected using species co-occurrence data? Ecology 68:117–123. Hector, A., K. Dobson, A. Minns, E. Bazeley-White, and J. H. Lawton. 2001. Community diversity and invasion resistance: an experimental test in a grassland ecosystem and a review of comparable studies. Ecological Research 16: 819–831. Hubbell, S. P. 2001. The unified neutral theory of biodiversity and biogeography. Princeton University Press, Princeton, New Jersey, USA. Kalkhan, M. A., and T. J. Stohlgren. 2000. Using multi-scale sampling and spatial cross-correlation to investigate patterns of plant species richness. Environmental Monitoring and Assessment 64:591–605. Kelt, D. A., M. L. Taper, and P. L. Meserve. 1995. Assessing the impact of competition on community assembly: a case study using small mammals. Ecology 76:1283–1296. Legendre, P., and L. Legendre. 1998. Numerical ecology. Second English edition. Elsevier Science, Amsterdam, The Netherlands. Levine, J. M. 2000. Species diversity and biological invasions: relating local processes to community pattern. Science 288:761–763. Levine, J. M., and C. M. D’Antonio. 1999. Elton revisited: a review of evidence linking diversity and invasibility. Oikos 87:15–26. Lodge, D. M. 1993. Biological invasions: lessons for ecology. Trends in Ecology and Evolution 8:133–137. Lonsdale, W. M. 1999. Global patterns of plant invasions and the concept of invasibility. Ecology 80:1522–1536. Loreau, M. 2000. Are communities saturated? On the relationship between alpha, beta and gamma diversity. Ecology Letters 3:73–76. MacArthur, R. H. 1970. Species-packing and competitive equilibrium for many species. Theoretical Population Biology 1:1–11. Mack, R. N., D. Simberloff, W. M. Lonsdale, H. Evans, M. Clout, and F. Bazzaz. 2000. Biotic invasions: causes, epidemiology, global consequences, and control. Issues in Ecology 5, Ecological Society of America, Washington, D.C., USA.
3222
JASON D. FRIDLEY ET AL.
Oksanen, J. 1996. Is the humped relationship between species richness and biomass an artefact due to plot size? Journal of Ecology 84:293–295. Peet, R. K., T. R. Wentworth, and P. S. White. 1998. A flexible, multipurpose method for recording vegetation composition and structure. Castanea 63:262–274. Richardson, D. M., N. Allsopp, C. M. D’Antonio, S. J. Milton, and M. Rejmanek. 2000. Plant invasions—the role of mutualisms. Biological Reviews of the Cambridge Philosophical Society 75:65–93. Sax, D. F. 2002. Native and naturalized plant diversity are positively correlated in scrub communities of California and Chile. Diversity and Distributions 8:193–210. Shea, K., and P. Chesson. 2002. Community ecology theory as a framework for biological invasions. Trends in Ecology and Evolution 17:170–176. Stohlgren, T. J., D. T. Barnett, and J. T. Kartesz. 2003. The rich get richer: patterns of plant invasions in the United States. Frontiers in Ecology and the Environment 1:11–14. Stohlgren, T. J., D. Binkley, G. W. Chong, M. A. Kalkhan, L. D. Schell, K. A. Bull, Y. Otsuki, G. Newman, M. Bashkin, and Y. Son. 1999. Exotic plant species invade hot spots of native plant diversity. Ecological Monographs 69:25– 46.
Ecology, Vol. 85, No. 12
Stohlgren, T. J., K. A. Bull, Y. Otsuki, C. A. Villa, and M. Lee. 1998. Riparian zones as havens for exotic plant species in the central grasslands. Plant Ecology 138:113–125. Stohlgren, T. J., G. W. Chong, L. D. Schell, K. A. Rimar, Y. Otsuki, M. Lee, M. A. Kalkhan, and C. A. Villa. 2002. Assessing vulnerability to invasion by nonnative plant species at multiple spatial scales. Environmental Management 29:566–577. Strong, D. R. 1980. Null hypotheses in ecology. Synthese 43:271–285. U.S. Department of Agriculture, Natural Resources Conservation Service. 2002. The PLANTS Database, Version 3.5. National Plant Data Center, Baton Rouge, Louisiana, USA. ^http://plants.usda.gov&. Usher, M. B., F. J. Kruger, I. A. W. Macdonald, L. L. Loope, and R. E. Brockie. 1988. The ecology of biological invasions into nature reserves: an introduction. Biological Conservation 44:1–8. Wilson, J. B. 2001. Assembly rules in plant communities. Pages 130–164 in E. Weiher and P. Keddy, editors. Ecological assembly rules. Cambridge University Press, Cambridge, UK. Wilson, J. B., and A. J. Watkins. 1994. Guilds and assembly rules in lawn communities. Journal of Vegetation Science 5:591–600.
APPENDIX An explanation of simulation methods is presented in ESA’s Electronic Data Archive: Ecological Archives E085-109-A1.
SUPPLEMENT The simulation programming code is provided in ESA’s Electronic Data Archive: Ecological Archives E085-109-S1.