vol. 170, no. 2
the american naturalist
august 2007
Null Models of Geographic Range Size Evolution Reaffirm Its Heritability
Anthony Waldron*
University of British Columbia, Vancouver, British Columbia V6T 1Z4, Canada Submitted August 31, 2006; Accepted February 27, 2007; Electronically published June 15, 2007 Online enhancement: appendix table.
abstract: Most models of allopatric speciation predict that the two daughter species will have range sizes different from each other’s and potentially from that of their common ancestor. However, I find that this difference is less than that expected under a variety of null models of range evolution. Sister species’ range values may therefore become more similar in the time following speciation. Greater-than-expected similarity (symmetry) has also been treated as a form of range size heritability. I therefore compare the results of this symmetry approach to a test for phylogenetic signal, using the range sizes of North American birds. I find that range size is heritable under both tests. I suggest that null models for range size heritability should be informed by an explicit model of evolution. Comparative methods may give erroneous results if they fail to take the unusual form of inheritance of range size into account. Keywords: clade selection, macroecology, comparative method, speciation, diversification.
Studies of the determinants of geographic range size often focus on ecological factors or on the limits to range imposed by geographic barriers such as mountains and coasts (see summaries in Brown 1995; Gaston 2003). However, a species’ geographic range size is defined in the first instance by the fraction of the ancestor’s range that it receives at the moment of reproductive isolation. Range size (and indeed extinction) at other moments in a species’ lifetime is the product of changes made to that original fraction (Gaston and Blackburn 1997; Price et al. 1997; Gaston 1998). The process of inheritance and the degree of her* E-mail:
[email protected]. Am. Nat. 2007. Vol. 170, pp. 221–231. 䉷 2007 by The University of Chicago. 0003-0147/2007/17002-42050$15.00. All rights reserved.
itability (defined as a pattern of similarity between relatives) are therefore potentially important influences on present-day species distributions. Species-level heritability is also crucial for studies of species sorting, or “clade selection” (Eldredge and Gould 1972; Stanley 1975; Jablonski 1987, 2000; Grantham 1995; Okasha 2003; Webb and Gaston 2003). Species-level traits that influence the chances of extinction and speciation might be able to explain differences in diversification rates between clades (for reviews, see Barraclough et al. 1998; Isaac et al. 2005), as long as such traits are heritable (Lewontin 1970). Range size is widely postulated to have such effects (Jablonski 1987; Rosenzweig 1995; Gaston and Blackburn 1997; McKinney 1997; Gaston 1998; Gaston and Chown 1999; Purvis et al. 2000; Cardillo et al. 2003), and so its heritability is of considerable interest. A debate over whether a species’ geographic range is indeed heritable has simmered and recently re-erupted in the literature (Hunt et al. 2005; Webb and Gaston 2005). Jablonski (1987) presented evidence that the range sizes of late Cretaceous mollusks exhibit heritability, since the range size of daughter species exhibits a significant correlation (both product moment and Spearman’s rank) with that of their most immediate known ancestor in the fossil record. Webb and Gaston (2003) found that the present-day range sizes of sister species of birds also exhibit a significant correlation. However, Webb and Gaston (2003) argued that correlation provides an unreliable test of range size heritability because range size distributions are highly right skewed, and this can affect the validity of even nonparametric correlation. They created a new approach to measuring heritability that consisted of comparing the symmetry between the ranges of sister species to a null model (where symmetry is defined as the smaller range size divided by the larger one). This null model draws pairs of range sizes at random from a uniform distribution (Hunt et al. 2005; Webb and Gaston 2005). Sister species of birds were no more symmetrical in their present-day range sizes than the null model predicted (in fact, they were significantly less symmetrical than expected). The authors therefore argued
222
The American Naturalist
Table 1: Methods used to assess phylogenetic signal in range size and their outcomes Taxon Mollusks (fossil)
Heritability test category
Result
Source
Phylogenetic signal (correlation and regression between ancestor and descendant) Phylogenetic signal (correlation) Phylogenetic signal (correlation) Phylogenetic signal (correlation) Phylogenetic signal (correlation) Phylogenetic signal (correlation) Phylogenetic signal (permutation)
Heritable (rs p .65 for gastropods)
Jablonski 1987
Heritable (rs p .26) Not heritable (rs p .18) Heritable (rs p ⫺.35) Heritable (rs p .53) Not heritable (rs p .18) Heritable
Phylogenetic signal (Moran’s I and Pagel’s l)
Heritable below the level of tribe (l p .16, I p.28)
Webb and Gaston 2003 Webb et al. 2001 Taylor and Gotelli 1994 Qian and Ricklefs 2004 Qian and Ricklefs 2004 Hunt et al. 2005, reanalyzing Jablonski 1987 and Webb and Gaston 2003 Blackburn et al. 2004
Lepidoptera (U.K. range only)
Phylogenetic signal (Pagel’s l)
Not heritable (l p .64)
Sunfish
Phylogenetic signal (Pagel’s l)
Not heritable (l p .0)
Suckers
Phylogenetic signal (Pagel’s l)
Heritable (l p .66)
Australian marsupials
Phylogenetic signal (Pagel’s l)
Heritable (l p .53)
Mammals
Phylogenetic signal (Moran’s I)
Primates
Phylogenetic signal (Moran’s I and Pagel’s l) Phylogenetic signal (Moran’s I and Pagel’s l) Phylogenetic signal (multiple regression with permutation for significance testing)
Heritable overall and for some orders (I p .32 overall) Heritable (l p .33, I p .49)
Birds Anseriform birds Cyprinellid fish Genera of herbaceous plants Genera of woody plants Mollusks (fossil) and birds
Parrots (Psittaciformes)
Carnivores Genus Sylvia (birds)
Freckleton et al. 2002, reanalyzing Dennis et al. 2000 Freckleton et al. 2002, reanalyzing Pyron 1999 Freckleton et al. 2002, reanalyzing Pyron 1999 Freckleton et al. 2002, reanalyzing Johnson 1998 Jones et al. 2005
Jones et al. 2005
Heritable (l p .36, I p .14)
Jones et al. 2005
Not heritable
Bo¨hning-Gaese et al. 2006
Note: For correlational studies, the Spearman’s rank correlation coefficient (rs) is reported because range size does not meet the assumptions of parametric statistics. For studies using Pagel’s l, the l statistic is reported. The value of l varies from 0 to 1, where 0 means no phylogenetic signal and 1 means that variation in the trait is perfectly correlated with phylogeny. Studies using Moran’s I give a summary of the I statistic. Values of I range from ⫺1 to ⫹1, where positive values indicate that at a particular taxonomic level, closely related taxa are more similar than expected by chance, and negative values indicate more dissimilarity than expected. Values of I are reported here only for species within genera. Complete I statistics can be found in the sources listed.
that range size is not heritable. However, Hunt et al. (2005) showed that if such a model takes random draws from a right-skewed distribution (such as is typical of range sizes) instead of a uniform one, then heritability is reaffirmed. More recent tests of range size heritability have used Pagel’s l (Pagel 1999; Freckleton et al. 2002) and Moran’s I (Gittleman and Kot 1990). These tests ask whether the distance between species on a phylogenetic tree is related to the distance between their trait values. They found a weak phylogenetic signal in the range sizes of mammals,
suckers (fish), and parrots, although results for individual mammalian orders were mixed (Freckleton et al. 2002; Blackburn et al. 2004; Jones et al. 2005). There was no signal in the ranges of sunfish or in the British ranges of Lepidoptera (Freckleton et al. 2002). Table 1 summarizes the diverse methods used to assess phylogenetic signal in range size. Different concepts of heritability. The disagreements over whether range size is heritable and over the validity of the many different methods used arise from two different con-
Geographic Range Size Evolution cepts of heritability in a species-level trait. The first I refer to as “phylogenetic signal” (Blomberg et al. 2003). A signal occurs if closely related species are more similar in their character values than are more distantly related species. Correlation and regression tests (Jablonski 1987; Ricklefs and Latham 1992; Webb et al. 2001; Qian and Ricklefs 2004), permutation tests (Taylor and Gotelli 1994; Hunt et al. 2005; Bo¨hning-Gaese et al. 2006), and whole-tree tests such as Moran’s I (Gittleman and Kot 1990; Blackburn et al. 2004; Jones et al. 2005) and Pagel’s l (Pagel 1999; Freckleton et al. 2002; Jones et al. 2005) all measure phylogenetic signal. The second concept proposes an expectation for the similarity between sister species based on a null model. A trait is classed as heritable if the similarity between sisters exceeds this null expectation (Webb and Gaston 2003). I refer to this approach as the “general null expectation,” or GNE, test for heritability, since model and expectation are designed to be generalizable to all taxa and all traits (Webb and Gaston 2005). The GNE test differs from phylogenetic signal tests because it does not involve any comparison between the trait values for sister species and those of other species in the phylogeny. Range size heritability tests require an evolutionary model. Phylogenetic signal tests are based on the premise that similarity (and symmetry) between two species decays with time since their common ancestor. To date, GNE tests have not made explicit their underlying model of change in symmetry (Webb and Gaston 2003, 2005). However, a situation whereby sister species’ symmetry changed after speciation would affect the interpretation of heritability tests. An explicit model of the evolution of range size symmetry, starting at speciation and then describing a trajectory through time, is therefore crucial if tests of heritability are to be properly applied (Jones et al. 2005). Barraclough and Vogler (2000) generated an expectation for range size symmetry by simulating vicariant speciation in rectangular ranges and then allowing range size to change by random drift. Their expectation applies to the total range encompassed by sister clades rather than to the ranges of sister species and so is difficult to apply to Webb and Gaston’s (2003) approach. In addition, Barraclough and Vogler’s (2000) model used a one-dimensional broken-stick distribution (MacArthur 1957) to divide two-dimensional ranges and did not allow extinction when range size dwindled to nothing, neither of which is biologically realistic. Here, I model range size symmetry of sister species pairs two-dimensionally, first at the moment of speciation and then over a period of evolution. I use results from the models to produce a GNE test of heritability. I then apply the GNE test to the range sizes of sister species of North American birds. I also apply a test for phylogenetic signal to the bird data and compare the outcomes of the two
223
tests. Finally, I discuss how results may vary with the test used and which biological questions are best addressed by each approach.
Methods Ranges of North American Birds In order to minimize the effects of available land area on species ranges, I selected from Weir and Schluter (2007) 65 sister species pairs of birds whose breeding ranges were predominantly limited to continental North America. All species had 199% of their breeding ranges north of the Mexico/Guatemala border except Sayornis nigricans (76%) and Sturnella magna (81%). I used only the North American range of the mallard Anas platyrhynchos on the grounds that it is effectively independent of its Old World range. Excluding these three species did not alter the conclusions of the study. Breeding range maps were taken from Birds of North America (Poole et al. 1992) or from Ridgely et al. (2005) where phylogeny had changed with respect to Poole et al. (1992). Source maps were converted to equal area using the Arcview 3.2 extension ImageWarp (MacVay 2000) and were then digitized. Range areas were calculated using Arcview utilities. There are two ways of measuring range size: “area of occupancy” sums the individual areas where a species is actually found, whereas “extent of occurrence” measures the total area of a single polygon drawn around the species’ most extreme geographic limits (Gaston 1991, 1994). The range maps used here measure area of occupancy, albeit at a coarse resolution. The range size of a species is constrained by the land area of the region in which it occurs (Letcher and Harvey 1994). For example, Mexican species could have a small range size compared to United States species simply because the continent narrows at lower latitudes. I therefore also measured range as a percentage of the total land area available within the species’ latitudinal limits on that continent. This method probably overestimates the relative size of smaller ranges because the assumption that a species could potentially occupy the same percentage of its latitudinal band irrespective of continent width might be unrealistic. For brevity, this measurement is referred to in this article as “percentage of latitudinal band.” I also measured the ratio between the maximum latitudinal and longitudinal extents for each species as an approximate indicator of range shape. Latitudinal and longitudinal limits were measured in Microsoft Encarta to the nearest half degree and then transformed to kilometer values using the haversine method (Sinnott 1984). Finally, I calculated the symmetry between sister species, where
224
The American Naturalist
“symmetry” means the area of the smaller range value divided by that of the larger range in each pair. Phylogenetic Signal To test for phylogenetic signal, I used a randomization test on range size symmetry (Maddison and Slatkin 1991; Blomberg et al. 2003; Hunt et al. 2005). This test repeatedly shuffles the range size values while keeping the phylogeny constant and then asks how often the average symmetry of sister species in the original arrangement exceeds the average symmetry of species pairs when values have been so shuffled. If sister species are more symmetrical (i.e., more similar to each other) than random pairs 95% of the time, then the data are judged to have a significant phylogenetic signal. I repeated this test for the bird data with range size expressed as arcsine-transformed percentage of latitudinal band. To quantify the strength of the phylogenetic signal, I used the intraclass correlation for the sister species pairs (Snedecor and Cochran 1967). This correlation measures the proportion of total variance that is between species pairs to give an estimate of heritability on a scale from 0 to 1, where 0 indicates no heritability. Modeling the Inheritance of Geographic Range Size at Speciation I simulated the inheritance of range size at the moment of divergence under vicariant modes of speciation. Moment of range splitting is hereafter referred to as “moment of speciation,” although speciation occurs some time after the splitting of a species’ range into two. I refer to speciation that occurs when a species range is split into two parts as “range-splitting speciation” and to that occurring when a founder population migrates to a new area as “founder dispersal speciation.” These terms avoid the confusions that can arise with the terms “peripheral isolate” and “vicariant” speciation, since peripheral isolates may be the result of either microvicariance (i.e., highly asymmetrical range splits) or founder dispersal (Brooks and McLennan 1991). To model range-splitting speciation, I took rectangular shapes of varying long side : short side ratios and randomly split them in two 100,000 times. Empirical long side : short side ratios (where side lengths are represented by latitudinal and longitudinal extents) are typically between 1 and 10 in North American bird ranges, and so this range of values was explored. Rectangles were split by picking a random point on the periphery and then drawing a chord at a random angle across the shape. The resulting frequency distribution of symmetries is referred to here as a “broken-tile distribution” (model A1). Not all the barriers
that arise in nature will split ranges in two because shorter barriers are not always able to span whole geographic ranges (Gaston 1998; but see Rosenzweig 1995). I therefore varied barrier length in model A1 while keeping other parameters constant and discarded simulations in which the barrier was not long enough to cause a split. For comparison with Anderson and Evensen (1978) and Barraclough and Vogler (2000), I also used MacArthur’s (1957) broken-stick model. This repeatedly breaks a onedimensional stick at a single random point along its length, therefore treating range size as a one-dimensional number. Results from this process (model A2) are referred to as a “broken-stick distribution” (MacArthur 1957). As a special case of range-splitting speciation (model A3), I also modeled a situation in which the subranges of two populations contract and become isolated from each other, as may occur when climate change causes a formerly continuous range to fragment (Diamond and Hamilton 1980). This is referred to as “range contraction speciation.” It was simulated by randomly taking two (x, y) coordinate points within the ancestral range and drawing independent, nonoverlapping circles of random radius about these points (within the limits of the ancestral range). Random numbers in all simulations were drawn from a uniform distribution, with one exception: in model A3, to reflect the right-skewed distribution of range sizes (Gaston 1998; Hunt et al. 2005), I added an extra simulation that drew the radii at random from a lognormal distribution. Unlike range-splitting speciation, founder dispersal speciation envisages the rare migration of a breeding population to a novel area, followed by divergence and reproductive isolation (Mayr 1963; Chesser and Zink 1994). I did not model range symmetry for founder dispersal at the precise moment of speciation but simply observe here that it is likely to be very low. Founder populations that travel away from the ancestral range are unlikely to represent more than a small percentage of the total species population in that first moment of migration. All of the above models also assume that speciation is allopatric or parapatric, a largely safe assumption in birds (Barraclough and Vogler 2000; Coyne and Price 2000). Modeling the Subsequent Evolution of Range Size Symmetry The above simulations generate an expectation at the moment of speciation but do not tell us how this may evolve toward an expectation in the present day. To model the postspeciation evolution of range sizes (model B), I took 250 (the computing memory limit) of the range pairs resulting from model A1 (broken tile) and applied a randomdrift process to them (following Barraclough and Vogler 2000). Range sizes were either multiplied or divided by 1.01
Geographic Range Size Evolution
225
Table 2: Expectations for mean symmetry (small/large ratio) between sister species’ range sizes at the moment of speciation Long side : short side ratio of the rectangle Model A1 (broken tile) A2 (broken stick) A3 (range contraction)
1
1.6
10
.21 (.19, .07) .39 .25
.26 (.20, .04) NA .25
.36 (.32, .01) NA .25 (.28 if using a uniform distribution)
Note: Numbers in parentheses for model A1 show the effects of limiting maximum barrier length to 1.2 times and 1 times the rectangle’s shorter side, respectively. In the case of model A2, the long side : short side ratio is not relevant because the model breaks a one-dimensional line. Results for model A3 are the same for lognormal and uniform distributions of range size radii, except where shown (see text). NA p not available.
at each time step. Ranges that fell to zero (defined computationally as !0.001) were declared extinct. At each time step, average symmetry of all pairs that had lost neither of the two sisters to extinction was calculated. The size of the North American continent sets an upper limit to range growth (bird ranges are a median one-sixth of the continental area). But since opinions differ widely on which range sizes account for the majority of speciation events (Mayr 1963; Terborgh 1973; Jablonski 1986; Rosenzweig 1995; Holt 1997; Maurer and Nott 1998; Gaston and Chown 1999; Hubbell 2001; Jablonski and Roy 2003), the definition of an appropriate frequency distribution of postspeciation growth limits for North American bird ranges is contentious. Fortunately, the qualitative results of the model remained unchanged under a wide variety of growth limit distributions. To assess how long the model should run for, I applied the drift process to the actual bird ranges to see how long it took for phylogenetic signal to disappear (as measured by the permutation test described above). A length of 30,000 time steps proved sufficient. All models were run a minimum of five times to check robustness of the conclusions.
Comparison of Models and Bird Data Since the bird range size symmetry data do not meet the assumptions of parametric statistics, I generated 95% confidence intervals for their mean symmetry by bootstrapping the data 100,000 times and calculating the mean for each bootstrap replicate. This process generates a frequency distribution of the bootstrapped means, and the 95% confidence interval of the mean then spans the 2.5% percentile and the 97.5% percentile of this distribution (Manly 1997). In addition to comparing the mean symmetry of the models and the data, I used KolmogorovSmirnov goodness-of-fit tests to compare their distributions of symmetry (Sokal and Rohlf 1995). Simulations were carried out using Visual Basic (Microsoft 1997). Sta-
tistical analysis was carried out using S-Plus 6.0 (Insightful 2000).
Results Phylogenetic Signal and Intraclass Correlation The randomization test shows that symmetry in the range sizes of bird species pairs is higher than in a random reordering of the data more than 99% of the time (P ! .01, log-transformed data). North American species pairs therefore show a phylogenetic signal. The intraclass correlation is 0.15 for log-transformed ranges.
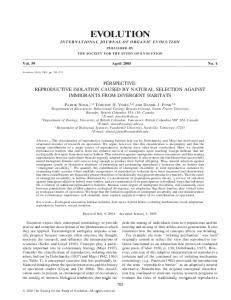
Null Expectations for Range Symmetry at the Moment of Speciation Expected symmetry between the range sizes of sister species is low under a variety of speciation scenarios (table 2). For the broken-tile model (A1), biologically realistic parameter sets give an expectation between 0.2 and 0.3. North American bird ranges have an average long side : short side ratio of 1.6, and inputting this value produces an expected symmetry of 0.26 at speciation. When barrier length is constrained rather than being infinite, expected symmetry is reduced (table 2). The model’s maximum expected symmetry is 0.39, but this occurs only when the long side : short side ratio is approximately 100,000. The broken-stick model (A2) has an expected symmetry of 0.39. This result is unsurprising since it is the same as that for a very long, thin rectangle in model A1. The range contraction model (A3) has an expectation of 0.25–0.28 for biologically realistic long side : short side ratios, and this changes little whether the ratios of the contracted range sizes are drawn from a uniform or a right-skewed distribution (table 2). The frequency distribution of symmetries for moment-of-speciation models has a hollow curve shape in all models, with the lowest symmetry being the modal class (fig. 1).
226
The American Naturalist
Figure 1: Expected frequency distributions of symmetry between sister species range sizes at the moment of speciation. Models A1 and A3 show results for a long side : short side ratio of 1. The model A3 plot used a uniform distribution of radii to model range size; a lognormal distribution yielded very similar results.
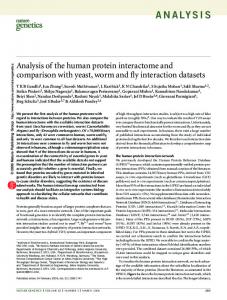
Null Expectations for Range Symmetry after a Period of Evolution In 10 runs of model B (postspeciational random drift), average symmetry for the 250 lineages (minus extinctions) lay between 0.2 and 0.3 in more than 95% of time steps and never exceeded 0.32. A representative time sequence is shown in figure 2. The distribution of symmetries at the end of 30,000 time steps was strongly right skewed in all 10 runs (not shown), similar to results for the brokentile model. Sister Species Symmetry in North American Birds The mean symmetry for the range sizes of North American bird sister species is 0.48 (95% confidence interval [CI] 0.41–0.56), or 0.55 (95% CI 0.47–0.62) when measured as percentage of latitudinal band. The distributions of symmetries are shown in figure 3. Kolmogorov-Smirnov tests indicate that these frequency distributions fit none of the general null expectations (P ! .05 in all cases). Empirical distributions have a much greater proportion of high symmetries than expected under the models.
studies in other taxa (see table 1). A few studies have found negative results for certain mammalian orders (Jones et al. 2005), sunfish (Freckleton et al. 2002, in a reanalysis of Pyron 1999), and 26 warblers of the avian genus Sylvia (Bo¨hning-Gaese et al. 2006). It is interesting that positive results have been found in large clades, such as marsupials, mammals, and North American birds, whereas negative results in general come from tests of individual orders or of even lower taxonomic levels. The strength of phylogenetic signal, measured by intraclass correlation, is low for North American bird ranges. Other studies have also found that the phylogenetic signal in range size is weak, comparable in strength to the signal for an ecologically labile trait such as diet (summary in Freckleton et al. 2002). Even so, heritability of range size is weaker in birds than in other taxa. Correlation coefficients are relatively low in this and other avian range size studies (Webb et al. 2001; Webb and Gaston 2003) com-
Discussion There is a phylogenetic component to the range size of North American birds. Sister species of birds also display greater symmetry between their range sizes than expected under null models. Phylogenetic Signal The finding of phylogenetic signal in North American bird ranges is in agreement with the majority of comparable
Figure 2: A typical trajectory of range symmetry evolution using a model of random drift. The line shows the average of smaller range/larger range for 250 sister species pairs.
Geographic Range Size Evolution
227
Figure 3: Symmetry of range sizes in North American sister species of birds. A, Symmetry based on raw range sizes; B, symmetry based on range sizes expressed as the percentage of the land area between the northern and southern latitudinal limits of the species that is occupied by that species.
pared to those for other taxa (see table 1). Similarly, the one study to use Pagel’s l on birds (parrots; Blackburn et al. 2004) found one of the lowest l values for geographic range size of all the taxa studied to date. Low estimates of phylogenetic signal in birds are also consistent with the results of studies that partition the variance in range size among taxonomic levels (Gaston and Blackburn 1997; Cotgreave and Pagel 1997; Webb and Gaston 2000; Webb et al. 2001). A phylogenetic signal for range size probably arises because ancestor range size is passed on to descendants at speciation, although not as simply as occurs with a trait such as body size. Small ancestral ranges are likely to give rise to two small descendant ranges. Similarly, large-ranged ancestors will give rise to at least one large-ranged daughter. The second daughter may sometimes have a small range, either because of an asymmetrical vicariance event (Gaston and Chown 1999) or because of range changes after speciation.
The General Null Expectation Test Models of vicariance suggest that average range size symmetry between North American avian sister species is expected to be 0.26 or less at speciation—potentially much less if speciation occurs by the dispersal of a founder population or if many of the barriers that arise are relatively short compared to range size. Following speciation, the maximum mean symmetry achieved during the process of random drift is 0.32. Since it is unlikely that all species pairs will reach the maximum simultaneously, a conservative realistic expectation is 0.3 or less. The symmetry in the bird data, at 0.48, is appreciably
higher than the null expectations in any model. North American bird range sizes therefore show heritability under the general null expectation test as well as under the phylogenetic signal test. While there is no statistical measure of the strength of this form of heritability, presentday ranges appear to be about twice as symmetrical as they would have been at speciation. They are also some 50% more symmetrical than expected after a period of evolution. The only comparable study to use a general null expectation approach found no heritability in bird ranges (Webb and Gaston 2003), even though their empirical symmetry value, at 0.45, is similar to that found here (Webb and Gaston 2005). Their expectation for symmetry was 0.5, which they achieved by taking random draws from a uniform distribution of range sizes (Hunt et al. 2005; Webb and Gaston 2005). The model used in this study simulates an explicit evolutionary process of range splitting and random drift for range size, and this process leads to a right-skewed distribution of range sizes similar to that found in nature (Gaston 1998). Webb and Gaston’s model does not emerge from an evolutionary process, and so it is unclear what the biological rationale is for using a uniform distribution (Hunt et al. 2005).
Possible Mechanisms for Greater-Than-Expected Symmetry in Range Size The results of this study suggest an unusual evolutionary process, in which resemblances between related species evolve over time rather than being immediately present at speciation. Random vicariance events and founder dispersal events initially create high asymmetry, but biological
228
The American Naturalist
processes such as nonrandom extinctions and niche conservatism may lead to postspeciational changes in range size symmetry. For example, if a species requires a certain minimum range size to avoid extinction and the original vicariance event leaves one of the daughters with a range size below that critical threshold, then the “runt” species will become extinct. Repetition of this process would progressively remove extreme asymmetries from the data set and so increase average symmetry of those sister pairs that persist over time. (The effect would be increased if runt species died out on closely related branches of the phylogeny. The surviving species, all of which would have larger ranges, would be classified as sisters, and their symmetry would be high.) Sister species might also grow to resemble each other more over time because range size is influenced by other, heritable aspects of species biology. For example, Brown and Maurer (1987; see also Brown 1995) postulated that range size may be a function of species’ ecological breadths. If ecological breadth is phylogenetically conserved (Ricklefs and Latham 1992; Price et al. 1997; Peterson et al. 1999; Wiens and Donoghue 2004; Wiens and Graham 2005), then sister species’ ranges will evolve to become more similar than they were at the moment of speciation. A nonrandom, unusually symmetrical pattern of range barriers at speciation could also account for high symmetry today, abolishing the need to invoke postspeciational increases in symmetry. For example, Pleistocene ice sheets central to the North American continent may have caused the unusually symmetrical east-west divisions of some ranges seen today (Mengel 1964; 1970). It is beyond the scope of this study to establish the geography of speciation of each species pair. Nevertheless, the orientation and location of present-day contact boundaries are highly varied for the sister species studied, with a large number of pairs that are not split into clear east and west sisters (many indeed have a northern and a southern sister). Recent biogeographical studies have also suggested that a variety of geographic events at several different times may underlie speciation in North American birds (Bermingham et al. 1992; Klicka and Zink 1997, 1999). It therefore seems unlikely that nonrandom vicariance alone explains greaterthan-expected symmetry. Finally, rectangles may be an inaccurate representation of species ranges. But simulations using ellipses produced lower expectations of average symmetry than those using rectangles (0.16 and 0.18 for long side : short side ratios of 1.6 and 10, respectively) because of the increased probability of a barrier shaving off a very thin slice from a range edge. The same seems likely to be true of irregular polygons; further work using much more complex models is required to confirm this.
Implications for Comparative Biology and Evolutionary Modeling Large postspeciational changes in range size are consistent with fossil evidence (mostly from periods of extensive climate change in the Pleistocene) that range size is highly dynamic (Overpeck et al. 1992; FAUNMAP Working Group 1996; Davis and Shaw 2001; Lyons 2003, 2005; see also Brown 1995; Losos and Glor 2003 for a neontological view) and argue against Zink et al.’s (2000) suggestion that ranges of North American birds are stable over a million years. At the same time, phylogenetic signal in range size implies that sister species similarities are not erased over time, no matter how labile the individual ranges are. Demonstrations of niche conservatism, including long-term similarity between the niches of sister species of birds (Price et al. 1997; Peterson et al. 1999; but see Rice et al. 2003), support this suggestion. Relatives’ range sizes may therefore co-vary in response to environmental change. Modern comparative methods (e.g., Felsenstein 1985; Harvey and Pagel 1991; Pagel 1999; Freckleton et al. 2002) depend on the assumed evolutionary model that symmetry will be near unity at speciation and then decline with time according to a random-walk process. But the models presented here suggest that range size does not behave in this way because sister species are expected initially to be very dissimilar and then perhaps to become more similar over time. Some comparative methods may therefore produce erroneous results if applied to range size. An expectation of symmetry has also been used to study the process of speciation itself. Barraclough and Vogler (2000), seeking to distinguish sympatric from allopatric speciation, simulated range splitting by using MacArthur’s (1957) one-dimensional broken-stick model. Anderson and Evensen (1978) used the same model to test for randomness in vicariance. But this study suggests that range symmetry at diversification in more realistic models of range-splitting is only half that expected under the brokenstick model (and indeed clarifies that the broken-stick symmetry expectation is 0.39). Models of speciation should use two-dimensional simulations of range division rather than one-dimensional ones. Various authors (e.g., Lynch 1989; Chesser and Zink 1994) have also sought to distinguish peripheral-isolate from vicariant speciation on the basis of current range symmetries, but, again, without using any evolutionary model to define their null expectation of symmetry. Lynch suggested that speciation probably occurred by founder dispersal (“peripheral isolates”) if sister species ranges displayed a symmetry of 5% or less. Chesser and Zink (1994) take issue with the 5% rule but apply the same test with different threshold criteria.
Geographic Range Size Evolution This study suggests a fundamental problem with this approach. The simplest broken-tile model predicts that range-splitting (i.e., vicariant) speciation will lead to a ≤5% ratio of range sizes 35% of the time. After evolution by random drift, this falls to 22% of the time. If low range size symmetry is so typical of “vicariant” speciation, it will not be informative for founder dispersal events. Acknowledgments Many grateful thanks go to J. Weir for providing North American bird species pairs. A. Albert, K. Bo¨hning-Gaese, B. Crespi, L. Harmon, G. Hunt, K. Marchinko, A. Mooers, D. Schluter, E. Taylor, T. Vines, J. Weir, and two anonymous referees provided much valuable discussion and made many useful comments on earlier versions of the manuscript. Data were provided by NatureServe in collaboration with R. Ridgely, J. Zook, the Nature Conservancy Migratory Bird Program, Conservation International–Center for Applied Biodiversity Science, U.S. World Wildlife Fund, and Environment Canada–WILDSPACE. Literature Cited Anderson, S. A., and M. K. Evensen. 1978. Randomness in allopatric speciation. Systematic Zoology 27:421–430. Barraclough, T. G., and A. P. Vogler. 2000. Detecting the geographical pattern of speciation from species-level phylogenies. American Naturalist 155:419–434. Barraclough, T. G., A. P. Vogler, and P. H. Harvey. 1998. Revealing the factors that promote speciation. Philosophical Transactions of the Royal Society B: Biological Sciences 353:241–249. Bermingham, E., S. Rohwer, S. Freeman, and C. Wood. 1992. Vicariance biogeography in the Pleistocene and speciation in North American wood warblers: a test of Mengel’s model. Proceedings of the National Academy of Sciences of the USA 89:6624–6628. Blackburn, T. M., K. E. Jones, P. Cassey, and N. Losin. 2004. The influence of spatial resolution on macroecological patterns of range size variation: a case study using parrots (Aves: Psittaciformes) of the world. Journal of Biogeography 31:285–293. Blomberg, S. P., T. Garland, and A. R. Ives. 2003. Testing for phylogenetic signal in comparative data: behavioural traits are more labile. Evolution 47:717–745. Bo¨hning-Gaese, K., T. Caprano, K. van Ewijk, and M. Veith. 2006. Disentangling current traits and phylogenetic and biogeographic factors. American Naturalist 167:555–567. Brooks, D. R., and D. H. McLennan. 1991. Phylogeny, ecology, and behavior. University of Chicago Press, Chicago. Brown, J. H. 1995. Macroecology. University of Chicago Press, Chicago. Brown, J. H., and B. A. Maurer. 1987. Evolution of species assemblages: effects of energetic constraints and species dynamics on the diversification of the North American avifauna. American Naturalist 130:1–17. Cardillo, M., J. S. Huxtable, and L. Bromham. 2003. Geographic range size, life history and rates of diversification in Australian mammals. Journal of Evolutionary Biology 16:282–288.
229
Chesser, R. T., and R. M. Zink. 1994. Modes of speciation on birds: a test of Lynch’s method. Evolution 48:490–497. Cotgreave, P., and M. D. Pagel. 1997. Predicting and understanding rarity: the comparative approach. Pages 237–261 in W. E. Kunin and K. J. Gaston, eds. The biology of rarity: causes and consequences of rare-common differences. Chapman & Hall, London. Coyne, J. A., and T. D. Price. 2000. Little evidence for sympatric speciation in island birds. Evolution 54:2166–2171. Davis, M. B., and R. G. Shaw. 2001. Range shifts and adaptive responses to Quaternary climate change. Science 292:673–679. Dennis, R. L. H., B. Donato, T. H. Sparks, and E. Pollard. 2000. Ecological correlates of island incidence and geographical range among British butterflies. Biodiversity and Conservation 9:343– 359. Diamond, A. W., and A. C. Hamilton. 1980. The distribution of forest passerine birds and Quaternary climate change in tropical Africa. Journal of Zoology 191:379–402. Eldredge, N., and S. J. Gould. 1972. Punctuated equilibria: an alternative to phyletic gradualism. Pages 82–115 in T. J. M. Schopf, ed. Models in paleobiology. Freeman Cooper, San Francisco. FAUNMAP Working Group. 1996. Spatial response of mammals to late Quaternary environmental fluctuations. Science 272:1601– 1606. Felsenstein, J. 1985. Phylogenies and the comparative method. American Naturalist 125:1–15. Freckleton, R. P., P. H. Harvey, and M. Pagel. 2002. Phylogenetic analysis and comparative data: a test and review of evidence. American Naturalist 160:712–726. Gaston, K. J. 1991. How large is a species’ geographical range? Oikos 61:434–437. ———. 1994. Measuring geographic range sizes. Ecography 17:198– 205. ———. 1998. Species range size distributions: products of speciation, extinction and transformation. Philosophical Transactions of the Royal Society B: Biological Sciences 353:219–230. ———. 2003. The structure and dynamics of geographic ranges. Oxford University Press, Oxford. Gaston, K. J., and T. M. Blackburn. 1997. Age, area and avian diversification. Biological Journal of the Linnean Society 62:239– 253. Gaston, K. J., and S. L. Chown. 1999. Geographic range size and speciation. Pages 236–259 in A. E. Magurran and R. M. May, eds. Evolution of biological diversity. Oxford University Press, Oxford. Gittleman, J. L., and M. Kot. 1990. Adaptation: statistics and a null model for estimating phylogenetic effects. Systematic Zoology 39: 227–241. Grantham, T. A. 1995. Hierarchical approaches to macroevolution: recent work on species selection and the “effect hypothesis.” Annual Review of Ecology and Systematics 26:301–322. Harvey, P. H., and M. Pagel. 1991. The comparative method in evolutionary biology. Oxford University Press, Oxford. Holt, R. D. 1997. Rarity and evolution: some theoretical considerations. Pages 209–234 in W. E. Kunin and K. J. Gaston, eds. The biology of rarity: causes and consequences of rare-common differences. Chapman & Hall, London. Hubbell, S. P. 2001. The unified neutral theory of biodiversity and biogeography. Princeton University Press, Princeton, NJ. Hunt, G., K. Roy, and D. Jablonski. 2005. Species-level heritability reaffirmed: a comment on “On the heritability of geographic range sizes.” American Naturalist 166:129–135.
230
The American Naturalist
Insightful. 2000. S-PLUS 6.0 for Windows. Insightful, Seattle. Isaac, N. J. B., K. E. Jones, J. L. Gittleman, and A. Purvis. 2005. Correlates of species richness in mammals: body size, life history, and ecology. American Naturalist 165:600–607. Jablonski, D. 1986. Larval ecology and macroevolution of marine invertebrates. Bulletin of Marine Science 39:565–587. ———. 1987. Heritability at the species level: analysis of geographic ranges of Cretaceous mollusks. Science 238:360–363. ———. 2000. Micro- and macroevolution: scale and hierarchy in evolutionary biology and paleobiology. Paleobiology 26(suppl. to 4):15–52. Jablonski, D., and K. Roy. 2003. Geographic range and speciation in fossil and living molluscs. Proceedings of the Royal Society B: Biological Sciences 270:401–406. Johnson, C. N. 1998. Species extinction and the relationship between distribution and abundance. Nature 394:272–274. Jones, K. E., W. Sechrest, and J. L. Gittleman. 2005. Age and area revisited: identifying global patterns and implications for conservation. Pages 141–165 in A. Purvis, J. L. Gittleman, and T. M. Brooks, eds. Phylogeny and conservation. Cambridge University Press, Cambridge. Klicka, J., and R. M. Zink. 1997. The importance of recent ice ages in speciation: a failed paradigm. Science 277:1666–1669. ———. 1999. Pleistocene effects on North American songbird evolution. Proceedings of the Royal Society B: Biological Sciences 266: 695–700. Letcher, A. J., and P. H. Harvey. 1994. Variation in geographical range size among mammals of the Palearctic. American Naturalist 144: 30–42. Lewontin, R. C. 1970. The units of selection. Annual Review of Ecology and Systematics 1:1–18. Losos, J. B., and R. E. Glor. 2003. Phylogenetic comparative methods and the geography of speciation. Trends in Ecology & Evolution 18:220–227. Lynch, J. D. 1989. The gauge of speciation: of the frequencies of mode of speciation. Pages 527–553 in D. Otte and J. A. Endler, eds. Speciation and its consequences. Sinauer, Sunderland, MA. Lyons, S. K. 2003. A quantitative assessment of the range shifts of Pleistocene mammals. Journal of Mammalogy 84:385–402. ———. 2005. A quantitative model for assessing community dynamics of Pleistocene mammals. American Naturalist 165:E168– E185. MacArthur, R. H. 1957. On the relative abundance of bird species. Proceedings of the National Academy of Sciences of the USA 43: 293–295. MacVay, K. 2000. ImageWarp. http://www.esri.com. Maddison, W. P., and M. Slatkin. 1991. Null models for the number of evolutionary steps in a character on a phylogenetic tree. Evolution 45:1184–1197. Manly, B. F. J. 1997. Randomization, bootstrap and Monte Carlo methods in biology. Chapman & Hall, London. Maurer, B. A., and M. P. Nott. 1998. Geographic range fragmentation and the evolution of biological diversity. Pages 31–50 in M. L. McKinney and J. A. Drake, eds. Biodiversity dynamics. Columbia University Press, New York. Mayr, E. 1963. Animal species and evolution. Harvard University Press, Cambridge, MA. McKinney, M. L. 1997. Extinction vulnerability and selectivity: combining ecological and paleontological views. Annual Review of Ecology and Systematics 28:495–516.
Mengel, R. M. 1964. The probable history of species formation in some northern wood warblers (Parulidae). Living Bird 3:9–43. ———. 1970. The North American Central Plains as an isolating agent in bird speciation. Pages 280–340 in W. Dort and J. K. Jones, eds. Pleistocene and recent environments of the central Great Plains. University of Kansas Press, Lawrence. Microsoft. 1997. Microsoft Office. Microsoft, Redmond, WA. Okasha, S. 2003. Does the concept of “clade selection” make sense? Philosophy of Science 70:739–751. Overpeck, J. T., R. S. Webb, and T. Webb III. 1992. Mapping eastern North American vegetation change of the past 18 ka: no-analogs and the future. Geology 20:1071–1074. Pagel, M. 1999. Inferring the historical patterns of biological evolution. Nature 401:877–884. Peterson, A. T., J. Soberon, and V. Sanchez-Cordero. 1999. Conservatism of ecological niches in evolutionary time. Science 285:1265– 1267. Poole, A. F., P. Stettenheim, and F. B. Gill. 1992. The birds of North America. American Ornithologists Union, Washington, DC, and Academy of Natural Sciences, Philadelphia. Price, T. D., A. J. Helbig, and A. D. Richman. 1997. Evolution of breeding distributions in the old world leaf warblers (genus Phylloscopus). Evolution 51:552–561. Purvis, A., K. E. Jones, and G. M. Mace. 2000. Extinction. Bioessays 22:1123–1133. Pyron, M. 1999. Relationships between geographical range size, body size, local abundance, and habitat breadth in North American suckers and sunfishes. Journal of Biogeography 26:549–558. Qian, H., and R. E. Ricklefs. 2004. Geographical distribution and ecological conservatism of disjunct genera of vascular plants in eastern Asia and eastern North America. Journal of Ecology 92: 253–265. Rice, N. H., E. Martinez-Meyer, and A. T. Peterson. 2003. Ecological niche differentiation in the Aphelocoma jays: a phylogenetic perspective. Biological Journal of the Linnean Society 80:369–383. Ricklefs, R. E., and R. E. Latham. 1992. Intercontinental correlation of geographic ranges suggests stasis in ecological traits of relict genera of temperate perennial herbs. American Naturalist 139: 1305–1321. Ridgely, R. S., T. F. Allnutt, T. Brooks, D. K. McNicol, D. W. Mehlman, B. E. Young, and J. R. Zook. 2005. Digital distribution maps of the birds of the Western Hemisphere. Version 2.1. NatureServe, Arlington, VA. Rosenzweig, M. L. 1995. Species diversity in space and time. Cambridge University Press, Cambridge. Sinnott, R. W. 1984. Virtues of the haversine. Sky and Telescope 68: 159. Snedecor, G. W., and W. G Cochran. 1967. Statistical methods. Iowa State University Press, Ames. Sokal, R. R., and F. J. Rohlf. 1995. Biometry. 3rd ed. W. H. Freeman, New York. Stanley, S. M. 1975. A theory of natural selection above the species level. Proceedings of the National Academy of Sciences of the USA 72:646–650. Taylor, C. M., and N. J. Gotelli. 1994. The macroecology of Cyprinella: correlates of phylogeny, body size, and geographic range. American Naturalist 144:549–569. Terborgh, J. 1973. On the notion of favorableness in plant ecology. American Naturalist 107:481–501. Webb, T. J., and K. J. Gaston. 2000. Geographic range size and evo-
Geographic Range Size Evolution lutionary age in birds. Proceedings of the Royal Society B: Biological Sciences 267:1843–1850. ———. 2003. On the heritability of geographic range sizes. American Naturalist 161:553–566. ———. 2005. Heritability of geographic range sizes revisited: a reply to Hunt et al. American Naturalist 166:136–143. Webb, T. J., M. Kershaw, and K. J. Gaston. 2001. Rarity and phylogeny in birds. Pages 57–80 in J. L. Lockwood and M. L. McKinney, eds. Biotic homogenization: the loss of diversity through invasion and extinction. Kluwer Academic/Plenum, New York. Weir, J., and D. Schluter. 2007. The latitudinal gradient in recent speciation and extinction rates. Science 315:1574–1576.
231
Wiens, J. J., and M. J. Donoghue. 2004. Historical biogeography, ecology and species richness. Trends in Ecology & Evolution 19: 639–644. Wiens, J. J., and C. H. Graham. 2005. Niche conservatism: integrating evolution, ecology, and conservation biology. Annual Review of Ecology and Systematics 36:519–539. Zink, R. M., R. C. Blackwell-Rago, and F. Ronquist. 2000. The shifting roles of dispersal and vicariance in biogeography. Proceedings of the Royal Society B: Biological Sciences 267:497–503. Associate Editor: Douglas H. Erwin Editor: Monica A. Geber