=Glen Dye (Picozzi 1978); ~ =a moor in Perthshire in 1988 (Redpath 1991);. * = Langholm .... When the effect of year was removed, the collection period had no significant ..... larly B. Anderson, G. Buchanen, S. Campbell, D. Calder, C. Cronin ...
Journal of Animal Ecology 1999, 68, 879±892
Numerical and functional responses in generalist predators: hen harriers and peregrines on Scottish grouse moors STEPHEN M. REDPATH* and SIMON J. THIRGOOD { *Institute of Terrestrial Ecology, Hill of Brathens, Banchory, Kincardineshire, Scotland AB31 4BY; and {The Game Conservancy, Crubenmore Lodge, Newtonmore, Invernessshire, Scotland PH20 1BE, UK
Summary 1. The functional and numerical responses of two generalist raptors (hen harrier and peregrine) were studied on one moor for 6 years and on ®ve other moors for 5 years. 2. Neither species showed numerical responses to grouse abundance. Harrier densities were highest in areas and years where their small prey (meadow pipits and small mammals) were most abundant. Peregrine densities were highest on southern study moors, probably in association with high abundance of racing pigeons. 3. For harriers preying on grouse chicks, the available data ®tted a sigmoidal or type III functional response. Peregrines showed a type II response to adult grouse densities around eyries. 4. The proportion of grouse chicks taken by harriers was estimated to have been highest at densities of 67 chicks km±2 (equivalent to a mean of about 12 broods km±2). The proportion of adult grouse taken by peregrines appeared to be inversely density dependent, such that an increasing proportion of grouse was taken at grouse densities below 20 km±2. 5. In the absence of persecution, the impact of harriers on grouse populations is most likely to be greatest on moors where alternative prey and thus harriers are abundant. The question of whether harriers may dampen grouse population cycles at low grouse density is discussed. Key-words: Circus cyaneus, functional and numerical responses, generalist predators, Lagopus lagopus scoticus, predation. Journal of Animal Ecology (1999) 68, 879±892 Introduction
# 1999 British Ecological Society
The impact of predation on prey populations depends largely on whether and how predators respond to changes in prey density. Predators can respond either functionally, by changing individual predation rates, or numerically, by changing their density (Solomon 1949; Holling 1959). According to their responses, dierent predators have been classi®ed as specialists or generalists (Andersson & Erlinge 1977). Specialists respond numerically either by immigrating (nomadic specialists) or by higher breeding success and survival (resident specialists), whereas generalists respond functionally as well as numerically (Andersson & Erlinge 1977). Theoretical models suggest that generalist predators can have a large impact on prey populations in certain situations (Murdoch & Oaten 1975; Andersson & Erlinge 1977; Hanski, Hansson &
Henttonen 1991). This generalist predator hypothesis (GPH) states that high densities of generalist predators are maintained by a wide range of prey species and that the predators switch between these as the relative densities of the prey species change. This density-dependent predation has a stabilizing in¯uence on prey numbers, and the GPH has been suggested to explain variation in vole population dynamics between Scandinavia and Canada (Erlinge et al. 1983, 1988; Erlinge 1987; Hansson 1987; Hanski et al. 1991; Reid, Krebs & Kenney 1997). In Britain, red grouse (Lagopus lagopus scoticus) typically show cyclic changes in abundance (Williams 1985; Hudson 1992). Several generalist predators prey on red grouse, but their impact is usually small (Jenkins, Watson & Miller 1964; Moss & Watson 1985; Hudson 1986). However, gamekeepers usually reduce predator numbers vigorously
880
Numerical and functional responses in generalist predators
(Newton 1979; Hudson 1992; Etheridge, Summers & Green 1997). Several grouse-moor owners recently allowed their main grouse-killing raptors [hen harriers (Circus cyaneus) and peregrine falcons (Falco peregrinus)] to breed freely and increase to more natural densities. This has enabled us to study the impact of these raptors on grouse numbers. In this paper we examine the numerical and functional responses of harriers and peregrines in the breeding season. According to the GPH, harriers and peregrines will stabilize red grouse populations if they exhibit a density-dependent functional response to grouse and no numerical response to changes in grouse density. More speci®cally, we ask: (i) do harriers and peregrines respond numerically and functionally to changes in grouse density? and (ii) does the proportion of the grouse population killed by these raptors vary with grouse density?
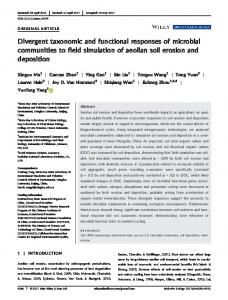
Fig. 1. Map of Scotland, showing the study moors Langholm and moors A±E.
ECOLOGY OF RED GROUSE, HARRIERS AND PEREGRINES
Red grouse are monogamous, territorial birds which live in heather (Calluna vulgaris)-dominated moorlands of Britain and Ireland. Two main hypotheses have been proposed to explain their population cycles: one proposes that cycles result from changes in grouse breeding success caused by the parasite Trichostrongylus tenuis (e.g. Hudson, Dobson & Newborn 1985; Hudson & Dobson 1990; Dobson & Hudson 1992); the other is that cycles are caused by changes in recruitment because of variation in grouse social structure and associated territorial behaviour (e.g. Moss & Watson 1985; Mountford et al. 1990; Moss, Watson & Parr 1996). Predation has been rejected as a possible cause of red grouse cycles (Hudson 1992; Moss et al. 1996). Female harriers hunt over grouse moors throughout the year, although males generally winter elsewhere (Watson 1977; Marquiss 1980). They make their nests in heather and pairs can nest in close proximity. Harriers are sometimes polygynous, with one male mating with up to several females. Peregrines are monogamous, territorial and tend to stay on territory throughout the winter, although they may leave during periods of bad weather (Mearns 1982). Nests tend to be on cli ledges, fairly evenly spaced over suitable habitat. Both harriers and peregrines take a wide variety of prey, although during the breeding season meadow pipits (Anthus pratensis) tend to dominate the diet of harriers (Watson 1977), and racing/feral pigeons (Columbia livia) that of peregrines (Ratclie 1993). # 1999 British Ecological Society Journal of Animal Ecology, 68, 879±892
Study areas Most data came from 1992 to 1996 on six study moors in Scotland, and some additional data came
from 1997 on Langholm moor and moor C (Fig. 1). Gamekeepers managed each moor, killing the mammalian and corvid predators, and burning heather in small patches to provide nutritious young growth for the grouse. On all moors, gamekeepers allowed raptors to breed freely and between them the moors held a wide range of red grouse densities. On ®ve of the six moors we estimated, from conversations with grouse-moor managers and local raptor enthusiasts, the year when illegal raptor control ceased. On the sixth moor we knew that raptors had bred freely for at least 5 years before the study began. As it was unclear at exactly which time of year the illegal control had stopped, we took year one as the year following the change in management policy. On each moor we estimated the density of red grouse, obtained measures of abundance for moorland passerines and small mammals, monitored breeding attempts by harriers and peregrines, and studied the diet of these predators by watching birds at nests and by analysing pellets and prey remains. We undertook intensive studies of grouse on Langholm moor, which was sampled in more detail as a consequence. We also obtained information on peregrines and their prey on two other areas, one in northern England and one in the eastern highlands of Scotland.
Methods COUNTS OF RED GROUSE
Managers divided Langholm moor into six areas, or beats, where grouse shooting took place. Within each beat, we chose two 0´5-km2 sites for grouse counts. The sites were widely spread, typical of habitat within that beat and with terrain suitable for
881
S.M. Redpath & S.J. Thirgood
counting grouse. On each of the other ®ve study moors, we chose two 1-km2 areas, and on each of the further two areas used for estimating peregrine numbers and diet we counted grouse on four 1-km2 areas. Grouse were counted during the ®rst half of April and the second half of July using standard counts with pointing dogs (Jenkins, Watson & Miller 1963). This involved the observer walking parallel transects at 170 m intervals with the dog quartering approximately 85 m on either side of each transect, pointing all grouse encountered. The same combination of dog and observer was used throughout the study. We estimated grouse brood size and chick abundance during the ®rst week of June on each area where we were studying harrier diet. The observer walked a minimum of 12 1-km transects on each area. Upon encountering a brood, the dog was worked for 5 min in an attempt to ®nd all chicks. Chick density was the mean brood size in June multiplied by the density of hens in July. Radio-tracking had earlier indicated very low rates of adult mortality during these months (Redpath & Thirgood 1997).
COUNTS OF MEADOW PIPITS
Meadow pipits were counted on line transects (Bibby, Burgess & Hill 1992) in three 1-km2 squares selected at random from each of the six Langholm beats, and six 1-km2 selected from each of the other ®ve study moors. Two parallel transects, 500 m apart, were walked through each square between 06.00 h and 09.00 h during June each year. This was carried out in the mornings, because previous work had shown that passerine estimates were in¯uenced by diurnal variation in detection rates (Thirgood, Leckie & Redpath 1995). The same observer undertook all counts in good visibility, light or moderate winds and no precipitation. He recorded the number of individuals (by species) within 200 m either side of the transect.
accurate indices of the abundance of small mammals (Redpath, Thirgood & Redpath 1995).
NUMBERS OF BREEDING RAPTORS
The number of hen harriers and peregrines attempting to breed was recorded in early spring by watching from vantage points for displaying harriers and by visiting potential peregrine nesting sites for signs of occupancy. For harriers we also determined whether males were bigamous by watching how many females they associated with. Females were considered either alpha (primary) or beta (secondary), depending on which of the two laid her eggs ®rst. No case of males with three or more females was observed. Harrier densities were expressed as n km±2 of grouse moor, as opposed to nearest-neighbour distance, because harriers were not strongly territorial and occurred in small groups within parts of the study moors. Peregrines nested at lower density than harriers (Redpath & Thirgood 1997) and nests tended to be evenly spaced (Ratclie 1993). For comparison between areas, we therefore used the spacing pattern of peregrine nests (measured as the nearest-neighbour distance of eyries used in 1994±96) in a region including the given estate, but extending beyond that estate's boundaries. As these peregrine nests were located in a wide area over a number of estates, some human interference was suspected in all regions, although its extent was unknown. For relationships with prey between areas, we excluded peregrines from moor E and its surrounds, because this was a coastal area where birds fed partly on seabirds, and so were not strictly comparable with the inland peregrines. Each raptor nest found in spring was monitored through the breeding season to determine clutch size, and the number of chicks hatched and ¯edged. Checks were made regularly in all areas to ensure that no late breeders or relays were overlooked.
RAPTOR DIET ABUNDANCE OF SMALL MAMMALS
# 1999 British Ecological Society Journal of Animal Ecology, 68, 879±892
Estimates of small mammal abundance were obtained by snap-trapping in April. We chose two trapping sites in representative habitat in each of the beats at Langholm, and four in each of the other ®ve study moors, again representative of each moor. In each site, 50 unbaited snap traps were set over two nights, giving 100 `trap nights' per site. Traps were checked each morning to record the numbers of ®eld voles (Microtus agrestis), wood mice (Apodemus sylvaticus), common shrews (Sorex araneus) and pygmy shrews (Sorex minutus). No other species of small mammal was caught. Previous work showed that two nights of snap trapping provided
Harrier diet was recorded from hides during the nestling period. Each nest was watched for up to 180 h over 6 weeks, until the chicks left. We recorded the start and stop time of each watch, the number and age of chicks, the time when food was brought to the nest, the sex of the provider, and the type of prey. Where possible, prey was identi®ed to species, but where not, was simply recorded as passerines, small mammals, nidifugous young (such as grouse or wader chicks) and lagomorphs (rabbits or hares). We also collated data from two earlier studies on harrier predation of red grouse chicks (Picozzi 1978; Redpath 1991). At 5 weeks, harrier chicks started to leave the nest and spend time in surrounding vegetation. Some
882
Numerical and functional responses in generalist predators
prey was dropped away from the nest during this period, and so fewer items could be identi®ed to type. In the ®rst 4 weeks, 89% or more of items could be identi®ed to type, but in weeks ®ve and six, this ®gure dropped to 71% and 60%, respectively. For comparisons within and between areas, we therefore used data from nest watches in the ®rst 4 weeks only. When using data from Picozzi (1978), we included only his data collected during the ®rst 3 weeks of the nestling period, so as to be roughly comparable with our data (Picozzi 1978, table 5). We studied male and female harriers separately, because the sexes vary in size and diet, and because some harriers were polygynous. We also collected harrier pellets through the breeding season, to compare pellet contents during and after the nest-watch period. Peregrine pellets and prey remains were collected during regular visits to nests. The minimum number of prey individuals was recorded, based on body parts. For larger prey items, wings, feet or sterna were counted to give minimum numbers. For small prey, each pile of body feathers was counted as a separate individual. Estimates of prey weight came from Ratclie (1993). Watches from hides at three nests indicated that adult peregrines consumed an estimated 188 g day±1 of prey and chicks 222 g day±1, during the 42-day nestling period (Redpath & Thirgood 1997), similar to estimates by Weir (1978). Racing pigeons were available mainly during race days, when they could be superabundant in peregrine territories for short periods. This made them extremely dicult to count and consequently analyses of the availability of peregrine prey necessarily emphasized grouse. In contrast to harriers, which nested on the heather moorland, some peregrine eyries were away from moorland. Therefore, when comparing diet with grouse availability, we estimated the proportion of heather-dominated moorland within a 2-km radius of each. This distance was approximately half the overall nearest-neighbour distance. The area of heather-dominated moorland was estimated by marking such habitat onto maps in the ®eld. Eyries with dovecotes nearby were excluded from the analyses to prevent the potential confounding eect of increased pigeon abundance. Prey remains were collected from some eyries in more than one year. To minimize the problem of interdependence between data points, we used annual mean values for these eyries.
Results NUMERICAL RESPONSE: HARRIERS
# 1999 British Ecological Society Journal of Animal Ecology, 68, 879±892
Before considering the numerical response of raptors, we had to know whether their numbers changed after raptor protection began. During the previous period of suspected illegal control, harrier
Fig. 2. The mean density of female harriers km±2 (2 1 SE) from four study moors in relation to the number of years since raptors were protected from persecution. Year 0 represents the year at which protection started.
numbers were low and birds generally failed in their attempts to breed (Redpath & Thirgood 1997). At Langholm, two nests failed for unknown reasons in 1992, although human interference was suspected. For four of the moors we had data on harrier numbers for each year following the start of protection. There, the mean densities of females increased yearon-year for 4 years (Fig. 2). In testing for changes in prey availability in relation to nesting densities of harriers, we therefore used only data from year four onwards. As meadow pipits, red grouse and small mammals formed 83% of identi®ed prey items at the nests (see below), we restricted analyses to these three prey types. Mean harrier densities varied from 0´06 to 0´21 km±2 between moors (Table 1), and densities of both males and females were positively correlated with meadow pipit abundance (Fig. 3). To a lesser extent, female densities were positively correlated with small mammal abundance (Table 2). Within moors, variation in harrier densities from year to year were related to small mammal abundance, but not to grouse or meadow pipit abundance. At Langholm, numbers increased from two to 20 breeding females in 1992±97.
NUMERICAL RESPONSE: PEREGRINES
Whilst harrier numbers on particular moors ¯uctuated more than twofold from year to year, peregrine numbers were generally more stable (Table 1). Only at Langholm did peregrine numbers attempting to breed increase from three to six pairs, whilst dropping by one pair on two of the other study moors. Latitude was positively correlated to nearestneighbour distance of peregrines over the seven
883
study areas (Fig. 4. rs = 0´82, N = 7, P = 0´024). The relationship between spring grouse density and nearest-neighbour distance was not signi®cant (rs = ±0´25, P = 0´52), even after accounting for latitude (P = 0´97).
0´21 2 0´05(.04 -.41) 0´19 2 0´04 (.10 -.34) 0´17 2 0´04 (.12 -.28) 0´06 2 0´01 (.00 -.09) 0´08 2 0´01 (.07 -.13) 0´17 2 0´01 (.15 -.20) 2´2 2 0´6 2´6 2 1´0 2´4 2 0´8 1´7 2 0´5 1´5 2 1´3 1´6 2 0´7 *Year in which illegal raptor control was thought to have stopped {Spring densities per km2´ {Summer counts per km transect. xSpring captures per 100 trap nights. {Breeding attempts per km2 of grouse moor.
30´6 2 1´4 18´8 2 0´9 6´7 2 0´9 48´1 2 3´9 22´9 2 3´3 0´8 2 0´4 1990 1990