Numerical Methods for Transonic Flows, Application for Design of Axial and Radial Stator Turbine Cascades. J. DobeÅ¡aâ, J. Forta, ... solution. Very important is also the comparison ..... differences between the flow field in a radial and an axial ...
Paper reference: ISAIF8-0029
Numerical Methods for Transonic Flows, Application for Design of Axial and Radial Stator Turbine Cascades J. Dobeˇsa∗ , J. Foˇrta , J. F¨ ursta , P. Loudaa , K. Kozela , L. Tajˇcb a
Department of Technical Mathematics, Faculty of Mechanical Engineering, Czech Technical University, Karlovo n´ amˇest´ı 13, Praha 2, CZ-121 35, Czech Republic bˇ
Skoda Power a.s., Tylova 1/57, Pilsen, CZ-316 00, Czech Republic
This article deals with the use of in-house developed numerical methods for the design cycle of radial and axial stator turbine rows. The methods help to evaluate alternative shapes of axial blades and to compare the axial and radial configuration of the stator with the same profile of blades. The influence of the grid, numerical scheme, turbulence models and formulation of outlet boundary condition to the numerical results is assessed. Keywords: Transonic flows, turbine cascades, turbulence modeling.
1. Introduction
The flows through radial cascades are a specific problem because there are very few experimental results available in this case and the design of the blades is based more-less on the experiences from the axial configurations. Here the numerical results can be used for the comparison of the properties of the same profiles in radial and axial cascade configurations.
The numerical solution of transonic flows through turbine rows and the evaluation of energy losses is very important step for the choice of profiles during the design of a turbine blade. On the other hand, the reliability of the numerical computations is very often unsatisfactory. In order to improve this reliability it is necessary to study very carefully the abilities of the numerical methods including the choice of the mathematical model, choice of the model of turbulence, the properties numerical schemes, the choice, and the approximation of the boundary conditions, and the influence of the mesh. The use of several inhouse codes allows us to easily change certain details of the algorithm and to asses the influence of those details to the quality of the numerical solution. Very important is also the comparison with the experimental results. It is not possible to achieve ideally two-dimensional flows in the experiment, which is especially important in the transonic regimes. It can be one of the sources of discrepancy between the experimental and numerical results.
2. Mathematical model We consider a compressible turbulent flows described by the system of Favre averaged Navier– Stokes equations ∂ρ ∂ρui + = 0, (1) ∂t ∂xi ∂ρui uj ∂p ∂τij ∂ρui + + = , (2) ∂t ∂xj ∂xi ∂xj ∂ ∂e ∂(e + p)uj = (τij ui − qj ), + ∂t ∂xj ∂xj (3) where ρ is the density, ui are the components of the velocity vector, p is the pressure, e is the total energy per unit volume, τij are the components of the stress tensor, and qj are the components of the heat flux. The pressure is given by the
∗ The
work was supported by the grant of Grant Agency of Czech Rep. no. 101/07/1508 and by the Research Plan of MSM no. 6840770010
1
2
Proceedings of the 8th International Symposium on Experimental and Computational Aerothermodynamics of Internal Flows
The model constants are α∗ = 1, α = 0.553, β = 0.09, β ? /β = 6/5, σ ? = 2/3, σω = 0.5.
equation of state �
?
�
1 p = (γ − 1) e − ρui ui − ρk , 2
(4)
where γ = cp /cV is the ratio of specific heats and k = u0i u0i /2 is the turbulent kinetic energy. The heat flux is given by the Fourier’s law � � � � γ ∂ p µ µT qj = − + . (5) γ − 1 P r P rT ∂xj ρ Here P r = 0.72 is the Prandtl number, P rT = 0.9 is the turbulent Prandtl number, and µT is the turbulent viscosity. The stress tensor τij of the laminar and turbulam turb lam = 2µSij where τij + τij lent parts τij = τij is computed using the dynamic viscosity µ and the strain-rate tensor � � ∂uj 2 ∂uk 1 ∂ui (6) + − δij . Sij = 2 ∂xj ∂xi 3 ∂xk
2.2. SST model of turbulence Next, the SST two-equation model of turbulence [6] has been implemented. This model improves the prediction of flows with strong adverse pressure gradients and separation. The equations for k and ω are the same as for TNT model where the source term Q is modified as follows Qk = Pk − β ? ρωk, ζρ SST Pk − βρω 2 + CD . Qω = µT
2 SST CD = (1 − F1 )ρσω2 CD, ω a1 k , µT = ρ max(a1 ω, ΩF2 ) p Ω = 2Ωij Ωij , � � 1 ∂ui ∂uj Ωij = − , 2 ∂xj ∂xi
(10) (11) (12) (13) (14)
(17) (18) (19) (20)
F1 = tanh(arg14 ),
(21)
tanh(arg22 ),
(22)
F2 =
√
500ν k , Γ2 = , 2 β ∗ ωyw ωyw � � 4σω2 k arg1 = min max (Γ1 , Γ2 ) , , 2 Cyw � � 2 C = max σω2 CD, 10−20 , ω
(24)
arg2 = max (2Γ1 , Γ2 ) ,
(26)
Γ1 =
The source term Q is defined as
µk = µ + σ ? µT , µω = µ+ σµT , ρk µT = α? , ω 2 turb τij = 2µT Sij − ρkδij , , 3 ∂k ∂ω ∂u i turb , CD = , Pk = τij ∂xj ∂xj ∂xj p P˜k = min(Pk , Sij Sij ).
(16)
Here
2.1. TNT model of turbulence The first model of turbulence used in this work is the TNT k − ω model of Kok [5]. This model adds the cross diffusion term to the equation for ω and uses modified set of coefficients in order to resolve the dependency on the value of ω in free stream. The equations are � � ∂ρk ∂ρkuj ∂ ∂k = + µk + Qk , (7) ∂t ∂xj ∂xj ∂xj � � ∂ρω ∂ρωuj ∂ ∂ω + = µω + Qω . (8) ∂t ∂xj ∂xj ∂xj Qk =P˜k − β ? ρωk, (9) αω ˜ ρ 2 Qω = Pk − βρω + max(CD, 0). k 2ω where
(15)
(23)
(25)
where a1 = 0.31, and yw is the distance to the wall. The model constants are a linear combination of the values for inner and outer region φ ≡ (β ∗ , β, ζ, σk , σω ) = F1 φ1 + (1 − F1 )φ2 , φ1 φ2
= (0.09, 0.0750, 0.5532, 0.85, 0.500), = (0.09, 0.0828, 0.4404, 1.00, 0.856). (27)
2.3. EARSM model of turbulence The most advanced model of turbulence which has been studied in this work, is the EARSM model [7],[3]. The Reynolds stress tensor is given
3
Dobeˇs et al. Numerical Methods for Transonic Flows, Application for Design of Axial and Radial Stator Turbine Cascades
by
where 5 2 (N − 2IIΩ )(2N 2 − IIΩ ), 6 � + N for P2 ≥ 0, N= N − for P2 < 0, p N + = A03 /3 + (P1 + P2 )1/3 + p p + sign(P1 − P2 )|P1 − P2 |1/3 Q=
2 turb τij = 2µT Sij − ρkδij − ρkaex. ij , 3
(28)
where the turbulent viscosity µT is 1 µT = − (β1 + IIΩ β6 )ρktT , 2
N − = A03 /3 + 2(P12 + P2 )1/6 " !# 1 P1 cos arccos p 2 3 P1 − P2 ! 02 A 9 2 3 P1 = A03 + IIS − IIΩ , 27 20 3 !3 02 A 9 2 3 P2 = P12 − + IIS + IIΩ , 9 10 3
(29)
the explicit part of the anisotropy aex. ij is
1 2 aex. ij = β3 tT (Ωil Ωlj − IIΩ δij )+ 3 + β4 t2T (Sil Ωlj − Ωil Slj )+
tT = max
k ; Cτ �
(eq)
β1
N (eq)
The invariants of IIS , IIΩ , IV are
with turbulent time scale �
9 9 (eq) + CDif f max(1 + β1 IIS ; 0), 5 4 6 N (eq) =− , 5 (N (eq) )2 − 2IIΩ 81 , CDif f = 2.2. (33) = 20
A03 =
+ β6 t3T (Sil Ωlm Ωmj + Ωil Ωlm Smj − 2 − IIΩ Sij − IV δij )+ 3 +β9 t4T (Ωil Slm Ωmn Ωnj −Ωil Ωlm Smn Ωnj ),
r � ν , �
IIS = Slm Sml , IIΩ = Ωlm Ωml , Cτ = 6.0
IV = Slm Ωmn Ωnl . (34)
(30)
The values of k and ω are computed with the model (7),(8) with source term and rotation
Ωij =
1 2
�
∂ui ∂uj − ∂xj ∂xi
Qk =Pk − β ? ρωk, (35) αω ρσd 2 Qω = Pk − βρω + max(CD, 0). k ω
� .
(31)
The constants are φ ≡ (β, ζ, σk , σω , σd ) = fmix φ1 + (1 − fmix )φ2 ,
The coefficients are given as [3] [7] N β1 = − (2N 2 − 7IIΩ ), (32) Q 2 12IV β3 = − , β4 = − (N 2 − 2IIΩ ), NQ Q N 6 β6 = −6 , β9 = , Q Q
φ1
=
(0.0747, 0.518, 1.1, 0.53, 1.0),
φ2
=
(0.0828, 0.440, 1.1, 1.00, 0.4),
(36)
with fmix = tanh(Cmix Γ4 ), Γ = min [max(Γ1 ; Γ2 ); Γ3 ] , 20k . Γ3 = 2 max(yw CD/ω; 200k∞ )
(37) (38) (39)
4
Proceedings of the 8th International Symposium on Experimental and Computational Aerothermodynamics of Internal Flows
2.4. Boundary conditions We consider the flows through 2D/3D cascades where the inlet is subsonic and the outlet Mach number based on the velocity normal to the outlet plane is less than one. We assume the following set of boundary conditions: Inlet here the quantities of total pressure, total temperature, and inlet velocity angle are given. The tangential component of the shear stress vanish at the inlet and the values of k and ω are prescribed at the inlet as well. Outlet here the outlet pressure is prescribed. The homogeneous Neumann’s conditions for other quantities are assumed. The outlet condition will be discussed later in this article. Walls here the non-slip condition for the velocity is assumed. The homogeneous Neumann’s condition for the temperature, and the Dirichlet conditions k = 0 and ω = ωw are assumed. Periodicity the flow is assumed to be periodic, therefore it is possible to use one period together with the periodic boundary conditions. 3. Numerical methods The problem is solved by several alternative schemes based on the Finite Volume method in cell-centered formulation: Method 1 The method uses AUSM scheme and linear interpolation with van Leer’s limiter [4]. Method 2 The numerical flux is determined using variant of the AUSM splitting. The linear reconstruction with the nonlinear weight contribute to the higher order of accuracy [2]. Method 3 The numerical flux is obtained using Roe’s Riemann solver. Linear reconstruction with Barth’s limiter is used in each cell [1]
AT NT2 NT24
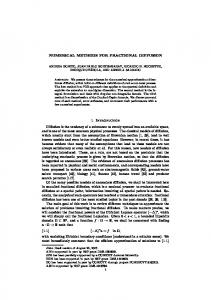
Figure 1. Shapes of the axial blades.
The first method works on the structured multiblock mesh, while second and third method works on general hybrid grids. Some of the methods were successfully extended for three-dimensional simulations. 4. Numerical results 4.1. Axial cascades Shapes of three profiles for the low-pressure stator blades operated in transonic flow regimes are compared in Fig.1. The shapes are very similar, there are small differences in the leading and rear part of the suction side. The profile NT24 is concave in the rear part, whereas the difference between NT2 and At is mainly in the leading part of the suction side. The flow is characterized by the inlet velocity angle α1 = 0 and the isentropic outlet Mach number M2i = 1.037. The Reynolds number was Re2i ≈ 1.4 · 106 and γ = cp /cV = 1.13 . The RANS equations were solved using a hybrid mesh with quadrilaterals near the walls and in the mixing region, and triangles elsewhere (see 2(a), 2(b)). This setup allows us to utilize the advantages of quadrilaterals for shear layers and simplifies the mesh generation in remaining part
5
Dobeˇs et al. Numerical Methods for Transonic Flows, Application for Design of Axial and Radial Stator Turbine Cascades
ξ [%]
NT24 2.3
At 2.5
NT2 2.9
Table 1 Energy losses for NT24, At, and NT2 cascades.
of the domain. The total number of cells was 47 452 in this case. The results obtained by the method 3 combined with SST model of turbulence are given in figure 3(a), 3(b), 3(c), 4(a), and 4(b). The sonic line connects two adjacent blades in the variants At and NT2. The structure of the flow field near the pressure side is very similar for all three geometries, the differences are near the suction sides. The pressure distribution is very flat for the NT24, whereas the acceleration followed by deceleration can be sought for NT2 and At cascades. The flow accelerates again in the rear part of the blade (see fig. 4(a)). It is possible to see the normal shock wave for the case of NT24 and At cascades. The shock is shifted almost behind the trailing edge for the NT24 case. For the case of NT2 cascade, there are the oblique shocks emanating from the suction side and collapsing into a normal shock far from the profile. The distribution of the friction coefficient 4(b) indicates, that there is no separation in the flow field (the values at the pressure side are plotted with − sign). The energy losses ξ = 1 − λ22 /λ22i are given in Tab. 1. The loses were evaluated from the results obtained with SST model. In order to asses the effects of the turbulence model, the effects of numerical method and the computational mesh, we solve the flow through NT24 cascade using all above mentioned methods, models and different meshes (above mentioned hybrid mesh, a multi-block structured mesh with 18 722 cells, and a coarse single-block mesh with 12 000 cells). The hybrid and multiblock meshes were prepared in order to satisfy common requirements of having y1+ < 1 with smooth variation of cell sizes. The coarse singleblock mesh uses y1+ ≈ 2, which still gives 2-3 points inside the laminar sublayer. Table 2 shows
Method Model 1 EARSM 1 SST 2 TNT 3 SST 2 TNT Fluent k-� RNG Table 2 Energy losses for NT24 different simulations.
Mesh Multi-block Multi-block Hybrid Hybrid Single-block unstructured
ξ [%] 2.6 2.5 2.4 2.3 3.1 3.2
cascade, comparison of
the energy losses calculated from these simulations. One can easily see that the differences between the values obtained by different methods and models are negligible with respect to the difference caused by different meshes. It emphasizes the importance of mesh-independency analysis off all numerical results. 4.2. The profile in radial and axial configurations The experimental measurements in radial cascades are more complicated than in the axial ones. Therefore it seems to be very helpful to know the differences between the flow field in a radial and an axial cascade with the same blades. Therefore the flows through the radial and axial cascades with the VS33R blade were computed. Figures 7 and 8 show the distribution of isolines of the Mach number computed with the commercial software Fluent and with the in-house codes in both radial and axial configurations. The shock wave is more oblique in the radial configuration, the distribution of the pressure is different at the suction side (see Fig. 9). The most important difference is visible at the rear part of the suction side where pressure increases for the axial geometry whereas it is almost constant for the radial case. It explains also the differences in the distribution of friction coefficient plotted in Fig. 9. The energy losses evaluated from the numerical results also significantly differ in both configurations. They have values ξ = 8 − 11% (depending on the mesh, turbulence model, and numerical method) in the axial configuration, whereas ξ = 4.4 − 5% for the radial case.
6
Proceedings of the 8th International Symposium on Experimental and Computational Aerothermodynamics of Internal Flows
(a) Hybrid mesh
(b) Detail near the outlet edge
Figure 2. Hybrid mesh with 47 452 cells. 5. Conclusion The work shows important influence of relatively small changes in the shape of the suction side of the turbine blade on the structure of transonic flows. Careful comparison of the numerical results obtained with several numerical methods, several meshes, and several models of turbulence proves the reliability of the results including the values of energy losses. The comparison of results for the radial and axial configuration with the same profile shows the differences in the flow fields and demonstrates favorable influence of the acceleration of the flow in radial cascade.
REFERENCES 1. T. J. Barth and D. C. Jesperson. The design and application of upwind schemes on unstructured meshes. AIAA Paper 89–0366,
AIAA, Jan 1989. 2. Jiˇr´ı F¨ urst. A weighted least square scheme for compressible flows. Flow, Turbulence and Combustion, 76(4):331–342, June 2006. 3. A. Hellsten. New advanced k-ω turbulence model for high-lift aerodynamics. AIAA J., 43:1857–1869, 2005. 4. Kyu Hong Kim, Chongam Kim, and OhHyun Rho. Methods for the accurate computations of hypersonic flows I. AUSMPW+ scheme. Journal of Computational Physics, (174):38–80, 2001. 5. J. C. Kok. Resolving the dependence on free stream values for the k-omega turbulence model. Technical Report NLR-TP-99295, NLR, 1999. 6. F. R. Menter. Two-equation eddy-viscosity turbulence models for engeenering applications. AIAA J., 8(32):1598–1605, 1994. 7. Stefan Wallin. Engineering turbulence modelling for CFD with a focus on explicit al-
7
Dobeˇs et al. Numerical Methods for Transonic Flows, Application for Design of Axial and Radial Stator Turbine Cascades
(a) NT24, hybrid mesh, method 2
(b) At, multi-block mesh, method 1 (c) NT2, multi-block mesh, method 1
Figure 3. Isolines of the Mach number in NT24, At, and NT2 cascades, M2i = 1.037, Re = 1 420 000, γ = 1.13, SST model of turbulence
0.01
1
0.005
Cf
p/p0
0.8
0
0.6
-0.005
AT NT2 NT24
0.4
0
0.2
AT NT2 NT24
0.4
0.6 x/c
(a) Pressure
0.8
1
-0.01 0
0.2
0.4
0.6
0.8
1
x/c
(b) Friction coefficient
Figure 4. Distribution of the pressure and friction coefficient in NT24, At, and NT2 cascades, M2i = 1.037, Re = 1 420 000, γ = 1.13, SST model of turbulence
8
Proceedings of the 8th International Symposium on Experimental and Computational Aerothermodynamics of Internal Flows
(a) TNT
(b) SST
(c) EARSM
Figure 5. Isolines of the Mach number in NT24 cascade, M2i = 1.037, Re = 1 420 000, γ = 1.13, comparison of turbulence models
NT24 cascade 1
NT24 cascade 0.005
0.9
0.0025
0.8
cf
p/p0
0
0.7
-0.005
0.6
-0.0075
TNT model, method 2 SST model, method 1 EARSM model, method 1
0.5
0.4
-0.0025
0
0.2
0.4
TNT model, method 2 SST model, method 1 EARSM model, method 1
-0.01
0.5 x/b
0.6
(a) Pressure
0.8
1
0
0.2
0.4
0.6
0.8
1
x/b
(b) Friction coefficient
Figure 6. Distribution of the pressure and friction coefficient in NT24 cascade, M2i = 1.037, Re = 1 420 000, γ = 1.13, comparison of turbulence models
Dobeˇs et al. Numerical Methods for Transonic Flows, Application for Design of Axial and Radial Stator Turbine Cascades
(a) S-A model
9
(b) TNT model, short domain
Figure 7. The isolines of Mach number in the VS33R cascade in axial configuration, M2i = 1.186, Re = 820 000.
(a) TNT model
(b) SST model
Figure 8. The isolines of Mach number in the VS33R cascade in radial configuraton, M2i = 1.186, Re = 820 000.
10
Proceedings of the 8th International Symposium on Experimental and Computational Aerothermodynamics of Internal Flows
0.01 1
0.005
cf
p/p0
0.8
0
0.6
-0.005
0.4 Axial, TNT model, method 2 Radial, TNT model, method 2 Radial, SST model, method 3 0.2
0
0.2
Axial, TNT model, method 2 Radial, TNT model, method 2 Radial, SST model, method 3
0.4
0.6
0.8
1
x/b
(a) Pressure distribution, TNT model
-0.01 0
0.2
0.4
0.6
0.8
1
x/b
(b) Friction distribution, TNT model
Figure 9. The distribution of the pressure and friction coefficient in the VS33R cascade, M2i = 1.186, Re = 820 000. gebraic Reynolds stress models. PhD thesis, Royal Institute of Technology, Stockholm, 2000.