Jul 27, 1999 - and Budd [1991] found that an increase in open water fraction in the Southern ...... Russell-Head, D. and I. Simmonds, Temporal structure of.
JOURNAL OF GEOPHYSICAL RESEARCH, VOL. 104, NO. DI4, PAGES 16,691-16,708,JULY 27, 1999
Numerical modelingof atmosphericresponseto polynyasin the Southern
Ocean sea ice zone
R. A. Dare and B. W. Atkinson
Department of Geography, Queen MaryandWestfield College, University of London, London, England
Abstract. Thepolarregionsplayan important role in the climatesystembut energy exchanges between theatmosphere andsurface in polarseaiceregions arenotwell understood, particularly in theobservation-sparse Southern Ocean.A highresolution mesoscale numericalmodelof the planetaryboundary layerwasusedto simulate meanwinteratmospheric conditions overopenwater(widthsof 10, 20, 30, 40, and 50 km) surrounded by seaice in the Southern Ocean,ratherthanthecolderArctic environment whichis the focusof mostpastwork.Previouswork hasconcentrated on surfaceturbulentfluxes.Herewe presentdataon momentum, heat,andmoisture fluxesupto 800m. Shearandincrease in buoyancy abovethepo!ynyagenerated a turbulentplumethatcauseddownward mixingof highmomentum air. The consequent acceleration of the surfacewind and horizontaldivergencecontributedto descent,
despite thermalbuoyancy, whiledownwind of thepolynya, therewasa regionof convergence andascent.Surface dragontheatmosphere overthewaterincreased due to the accelerated windandincreased dragcoefficient. The surfaceheatflux increased for distances up to 20 km overopenwaterowingto the increase in theheattransfer coefficientandwind speed.Beyondthepointwherethewind speedreacheda maximum,the decrease in surface-air temperature difference, whichdecreased with distance fromtheupwindiceedge,became thedominant influence on heatflux. Transferof heatfrom air to the ice downwindof a polynyaincreasedwith polynya width despitean increasein thermalstabilityof the loweratmosphere.
Areasof openwaterin seaiceareusuallynamedleadsor polynyas. Leadsarelinearopenings usuallyno widerthan
1. Introduction
The SouthernOceanseaice regioncoversapproximately 1 km, formedas a result of fracturingof sea ice due to
8%ofthehemispheric areaatitsmaximum (20x 106km2),differentialmotions,whethertheyare forcedby the wind or during September-October. Distancesacrossthe sea ice ocean currents.Polynyas are rectangularor elliptical although shorepolynyas thatarenarrowcanbe fromopenoceanto thecoastof Antarcticaaretypically500 openings, (forexample,thepolynyasouthof the to 1000 kin. From thesestatistics,it would be expected linearin appearance that the seaice regionhas a not insignificant effecton the Drygalski Ice Tongue, [Kurtz and Bromwich, 1985]). energybalanceof the atmosphere and the exchangeo• Observations of polynyasin the SouthemOceansea ice energybetween theatmosphere andocean.Indeed,it is well zoneshowthat the rangeof sizesis large,with widths of knownthatseaiceregionsareimportant components of the polynyasrangingfromkilometers[Melior, 1960;Kottmeier Earth's climate and therefore, necessarily, of climate and Engelbart,1992],to tensof kilometers[Knapp, 1967; models.
Cavalieri and Martin, 1985], to hundredsof kilometers [Streten, 1973; Comiso and Gordon, 1987]. They are concentration andthicknessare highly variable,as are its observedto form in recurrentlocationsfrom year to year roughness, albedo(varyingwith ice thicknessand snow and are formedby removalof sea ice by winds or ocean Sea ice is not a continuous and uniform material. Its areal
coverage), andthermalproperties. Seaice actsas insulation currents (suchasin the lee of a coastline, islandor iceberg), betweenthe atmosphereand ocean,isolatingthe cold or by meltingand preventionof formationof seaice by atmosphere (typically- 15øCin the Southern Oceanduring oceanic heat.
winter) fromtherelatively warmwater(near-1.8øC,the Theabsence ofseaiceacting asaninsulating barrier and
freezing pointof typical seawater). A reduction in arealthelarge differences intemperature between theocean and concentration ofseaicemeans anincrease in theareaof atmosphere over areas ofopen water leadto large turbulent openwaterthatis in directcontact withtheatmosphere. fluxesof heatfromoceanto atmosphere. Kurtz and
Bromwich[1985]calculated turbulentsensible heatfluxes Copyright1999 by the AmericanGeophysical Union. Paper number 1999JD900137. 0148-0227/99/1999JD900137509.00
of around 600 W m'2 duringwinter,fromopenwaterin TerraNovaBay (westemRossSea).Turbulentheatfluxes derivedfrom observations over polynyasin the Weddell
Seawereup to 430 W m'2 [Kottmeier andEngelbart, 16,691
16,692
DARE
AND
ATKINSON:
ATMOSPHERIC
RESPONSE
TO POLYNYAS
1992].Conductive heatfluxesthroughtheseaice and snow applicableto the situationmodeledin the SouthernOcean.
aremuchsmaller, varying fromaround 5 W m'2 [Massom The modelusedin this studyhasbeenused for many years etal., 1997]to 30 W m-2[Allison et al., 1982;Kondratyev previouslyboth in research[e.g., Atkinson, 1995] and et al., 1996]. Evidently,the heat flux from areasof open waterin seaice zonesto the atmosphere canbe two orders of magnitudegreaterthan the conducted flux throughsea ice. This has beennotedpreviouslyfor the Arctic Ocean [Andreas,1980].Latentheatfluxesfromopenwaterto the atmosphere arealsosignificant because air overthe seaice
operationally, anditsreliabilityhasbeenconfirmed.Details of the model and initial data are discussed in sections 2 and
3 respectively.The model's initial datahavebeenselected carefullyto ensurethat conditionstypical of the Southern Oceanwinter environmentare applied. Modeling results and validation are discussedin sections4 and 5, followed
zoneis relativelydry,dueto insulationfromthe oceanand by conclusions in section6. drainagenorthwardof the dry polar continentair from Antarctica.Using a generalcirculationmodel, Simmonds2. Numerical and Budd [1991] found that an increasein open water
Model
fraction intheSouthern Hemisphere from0%to 5%ledto Thenumerical model used toinvestigate development of anincrease of1.2øC in surface airtemperature overthesea theatmospheric boundary layer structure overa polynya in icezone, withlargest changes neartheAntarctic coast, and theSouthern Ocean wasfirstdescribed byTappandWhite cooling of thepolarstratosphere. Theyalsonoted that [1976]and is nonhydrostatic, usesterrain-following
and includesa 11/2order turbulentkinetic correlationshad been foundby Chiu [1983] betweenthe coordinates energy (TKE)scheme. The model is compressible and has Antarctic sea ice extent and the SouthernOscillation, which prognostic equations for vertical velocity and pressure. At again demonstrates the importancein understanding the lateral boundaries, zero gradients are applied to all fields atmosphere's interactionwith seaice regions. except vertical velocity, for which radiative boundary Most previousresearchhasfocussed on relativelynarrow conditions areused.Surfaceexchange coefficients dependon openwaterareas[Schnellet al, 1989],probablybecause the the stability of the surfacelayer, represented by the bulk majority of past work related to atmosphericinteraction Richardsonnumber,andon the surfaceroughness,specified with seaice hasbeenconcerned specificallywith the Arctic for sea ice but computed for the water surfaceusing [e.g., Andreaset al., 1979; Smith et al., 1983; den Hattog Chamock's relation [Garratt, 1992]. The experiments et al., 1983; Glendeningand Burk, 1992; Stoneand Key, presented hereare two-dimensional, as is the majorityof 1993; Glendening,1995; Maslanik and Key, 1995; Alam past modelingwork in this field [e.g., Overland et al., and Curry, 1997],whereleadwidthsaretypically lessthan [1983], Glendeningand Burk, 1992; Alam and Curry, 1 km wide [Barry et al., 1993]. Some studieshave been 1995; Burk et al., 1997]. concerned with widerregionsof openwater,with widthsup to a few kilometers[Kottmeierand Engelbart, 1992; Alam 3. Initial Conditions and Curry, 1995; Vihma, 1995; Burk et al., 1997]. Despite
Overland's [1985]observations andPintoet al.'s [1995] Theaccuracy ofthemodelresultdepends onthedegree modeling, knowledge of the magnitude andvariation of to whichtheinitialvalues ofparameters arerepresentative heat,moisture, andmomentum fluxeswith heightabove of thephysical systembeingmodeled. The modelwas
the surfacein the vicinity of polynyas is limited. As initialized with valuesrepresentative of the mean seasonal plumes have been observedto reach the midtroposphere conditionsof the atmosphere, seaice, andocean,ratherthan [Barry et al., 1989; Schnell et al., 1989] through strong of extremeconditionsor thosebasedon a particularcase. Arctic inversions,and asvery large surfaceheat fluxeshave The Southern and Arctic Ocean environments differ beenrecordedoveropenwaterareas,verticalfluxesneedto significantly.The majority of past work concerningthe be studiedif the influencesof open water areas and study of the atmosphereover sea ice regions has accompanying plumeson regionalandglobalclimateareto concentrated ontheArctic,a possibleconsequence of which be understood. In addition,the largeopenwaterareasand is a lack of recognitionof the differences betweenthe two the general absenceof surface-based inversionsover the environments. For example,Vihma[ 1995]useda lapserate SouthernOcean, particularlywhen comparedwith the and snowsurfacetemperature typical of the Arctic, not of Arctic Ocean, suggestthat vertical fluxes are also very the SouthernOcean,when modeling surfacefluxesfor an importantin the Antarcticseaice zone. Antarctic winter case, although it was noted that the The aim of the present work is to construct a differencein surfacetemperaturebetweenice and polynya comprehensive physicaldescriptionof atmospheric response was an extreme.Smith et al. [1990] statedthat the north to openwater areasin the sea ice surroundingAntarctica. polar winters are less frigid than those of the Antarctic of releaseof The sparse observational coverage of the oceans continent,evennearsealevel, in part because surrounding Antarcticaseverelylimits ourknowledgeof the heatfromthe ocean.Of coursethe Antarcticcontinent,with atmospheric boundary layer over the region, so an averageelevationgreaterthan2000 m, is colderthan the observations of otherpolaroceansmay provideinformation Arctic Ocean, but the sea ice zone that surroundsthe about featuresthat are generally characteristicof the Antarcticcontinentduringwinteris considerablylessfrigid boundary layer over open water areas within sea ice. than the Arctic. Observations from stations located at sea Numericalmodeling is used not only to further our level aroundthe perimeterof East Antarcticashow mean of around- 15øC to -20øC, which are understanding of the physics behind atmospheric winter temperatures phenomena, but alsoto generatea setof datato fill the void higher than those in the north polar winter. The often temperature difference of-20øC to of observations.The modeling resultscan be validatedby quotedatmosphere-ocean comparisonwith available observationsthat are judged -40øC, although sometimesobserved in the Southern
DARE AND ATKINSON'
ATMOSPHERIC
RESPONSE
TO POLYNYAS
16,693
Oceanseaice zone,is nottypical,asit is for the Arctic. T o aboveandontheworkof Andreaset al. [1984] and Worby achievethe best result, data that reliably representthe and Allison [ 1991]. Southern Ocean environment were used to initialize the The temperatureof the ice is computed using a model. A comparisonbetweenwinter conditionsof the multilayer scheme.This is a useful method for highArctic and Southern Ocean environments is shown in Table latituderegionsduringwinter wherethere is an absenceof 1. diumal forcing, upon which other schemes,such as the The model domain is 100 km wide, comprising101 force-restore slab method,depend.The balanceof fluxesat grid pointswith a spacingof 1 km. The basemodeling the sea ice surface,shown in the secondcolumn of Table 2,
experiment uses a10-km-wide polynya located 20kmfromisbased onthework ofParkinson andWashington [1979], theupwind lateral boundary. Additional experiments useAllison etal. [1982], Allison [1989b], Worby andAllison polynyas withwidths of20to 50km.Terrain elevations [1991],Kottmeier andEngelbart [1992],Martinson
arehorizontallyuniformat 0 m. The model's atmosphere[ 1993], Kondratyevet al. [ 1996], Lytle and Ackley [ 1996] extends from the surfaceto 15 km, which includes the and Massom et al. [1997]. This approximate balance tropopause at 10 km. Therearea totalof 32 levels,with 18 (Table 2, column2) is alteredslightlyin orderto minimize in the lowest 1 km. The time stepis 10 s. the initial turbulent heat flux at the sea ice surface. The air The surfhcetemperatureof the openwater areais setto a and the ice surfacesare placed in approximatethermal constant-1.8øC,the freezingpoint of typical seawater.A equilibrium so that the temperature of the air that water-icetemperaturedifferenceof 15øC is used. The air at encounters the openwatersurfaceis dependent on the initial the surfaceis assumedto be in thermal equilibriumwith conditions,which is deskablefrom a modeling point of
theice,at-16.8øC.The atmosphere is neutralto 500 m, view,ratherthanon the lengthof the seaice traversed
capped byaninversion, F0= 6øCkm'•, andfrom1 kmto upwind ofthepolynya. Therefore thisbalance isadjusted in
10km,F0= 4øCkm4 abovewhichF0= 10øCkm'•. This orderto minimize theinitialturbulent heatfluxat the sea profileis based onthesources quotedin Table1 andon icesurface (Table2, column 3).Theadjusted initialsurface analyses oftemperature profiles observed at EastAntarcticenergy balance depends on a balance between longwave coastal stations Casey, Davis and Mawson and at radiation and subsurfaceheat flux. If the subsurface -2
Macquarie Islandin the SouthernOcean.The initial conductive heatfluxequals 30W m , let thenetlongwave vertical profile ofwindspeed increases from10m s-• at the ra&at•on ß ß equal-30 W m-2, andfor a surfaceof temperature-
surface to14.6ms-•at500mandabove. Thisisbased on 16.8øC, longwave radiation loss would equal 244.9W m'2,
a largenumberof sources, for example, Andreaset al. andtherefore longwave radiation gainis 244.9 - 30, i.e. [1984],Martinson andWamser [1990],Worby andAllison 214.9W m'2.Notethattheadjusted fluxes (therightmost [1991]andMassomet al. [1997].Apartfromthe base columnof Table2) do lie withinthe rangeof values
experiment (10m s'l),three additional simulations usedpresented in thepapers listedabove. Also,theturbulent
wind speedprofilesbasedon surfacewind speedsof 0, 5 heatflux is not setto a constantvalueof 0 W m-2but reacts
and15m s'. Turbulent k•net•c energy •sm•t•ahzed as0 m- asthemodelintegration progresses, asdiscussed in section 2 s-2throughout the modeldomainbut is generated by 4.6. buoyancy,wind shearand diffusion.Cloud is also absent
initially,but the relativehumidityis 90% withinthe 4. Results: 10-kin Polynya Width boundarylayer, decreasing graduallyto 50% at 2 km and above, based on observationsat the four stations noted
4.1. Turbulent Kinetic Energy
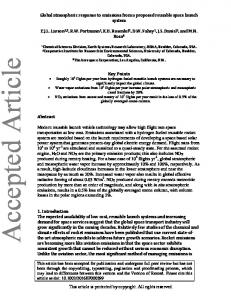
The vertical crosssectionof the TKE (Figure 1) is presentedfirst becauseits representationof mixing is relevant to most of the sections that follow. 900
800 0.2
700 - •1
--
600 -
The
initial
wind is from left to right, over a 10-km-widepolynya which is locatedat 0 to 10 km alongthe x axis.The results presentedhere are for 6 hours into the model run, which
_
500-
_
400 -
_
Table 2. Values of Heat Fluxes at the Sea Ice Surface
Basedon LiteratureandAdjustedfor Use in
InitializingtheNumerical Model. /
,-,•0.4• -20
' -10
0
Approximate
-
10
20
30
40
60
balance
Net longwave radiation
•0.4 50
Flux
70
80
Turbulent
Solar radiation Figure1. Verticalcrosssectionof turbulentkineticenergy input (TKE)(contour interval = 0.2m'2s'2)at6 hours, withthex axis
Subsurface
representing horizontal distance, thepolynyalocatedfrom 0 to
heat flux
10 km(shaded section ofx axis),andthey axisrepresenting
height abovethe surface.
balance
W m'2
W m-2
---40to-50
--- 30
heat flux
(airtoice)
Honzontald•stance(km)
Adjusted
=+5to+10
=0
=0
--0
-- +15to+30
--+ 30
conductive ,
See text for further discussion.
,
16,694
DARE AND ATKINSON:
ATMOSPHERIC
RESPONSE
TO POLYNYAS
reachedan approximate steadystatethat was maintainedup polynya.Theseare formeddueto the variationacrossthe to 24 hours. polynyaof shearand buoyancycontributions(Figure 2). Although surface-airturbulent fluxes of heat and Buoyancyincreases as a resultof the air's warmingwith moisture from leads in the Arctic have been discussed a distance acrossthe polynya.The variationwith distanceof thanthat greatdeal [e.g., Andreas, 1980; den Hartog et al., 1983; TKE generationdueto shearis morecomplicated Alam and Curry, 1997],therehasbeenmuchlessemphasis of buoyancy.Local maximain the shearterm are foundat on the verticalextent and magnitudeof turbulentfluxes both the upwind and downwindice edgesof the polynya. throughoutthe boundarylayer. The less stableboundary The sheartermdependson the productof the squareof the layer atmosphereof the SouthernOceansea ice region verticalwind shearand the vertical exchangecoefficient. (comparedwith that of the Arctic) suggeststhat turbulent Overthepolynya,the verticalwind shearis at a minimum fluxes will be significantto heights of severalhundred due to turbulent mixing, but the vertical exchange meters above the surface. The basis of vertical turbulent coefficientis at a maximum. Near the edgesof the polynya fluxes of heat, moisture and momentum is the vertical thereis a discontinuity betweenthesetwo terms,leadingto profile of turbulentkinetic energy (Figure 1). A general maxima in the shear term. The TKE-shear term reaches a maximum occursover the polynya, with much smaller maximumat around5 km downwindof the polynya due to valuesoverthe surrounding seaice. This "plume" extends the increasein wind shearin this region. This maximum fromthesurfaceto a heightof approximately 800 m. At the occursdownwind of the polynya becausethe decreasein surfaceits lateral boundariesclosely correspondto the wind speedat the surface(10 m height)is more rapid than polynya edges, but it tilts downwind by horizontal the decreasein wind speedat higherlevels(25 m). Overall, distancesof about4 km at higherlevels.Near the surface, Figure 2 showsthat althoughshearmakes an important modeled values arearound 1.4to 1.5m'2s'2,increasing to contribution,it varies by a relatively small amount with about 1.7 m'2 s'2 at 400 to 500 m abovethe surface.The horizontal distance, and the increase in buoyancy, effectivenessof the vertical diffusion of momentum, essentiallydoubling the combinedforcing of these two demonstratedin section 4.3, and the good agreement terms, is responsiblefor the large increasein TKE from betweenthe magnitudesof the resultantverticalfluxesand overseaice to over the openwater. The othermajor term, availableobservations (Sections4.2) stronglyindicatethat dissipation, is proportional to the magnitude of the values of TKE = 1.5 m-2 s'2 are of the correctorder ff turbulentenergy,and otherterms,advectionand turbulent magnitude, despite comparisonwith results of a one- transport,make minor contributionsonly and are not dimensional(l-D) modelingstudyby Pinto et al. [1995], shown.The horizontalvariationin turbulentkinetic energy where TKE> 9 m'2s'2wasproduced in thelowest 50 m ff modeledhereis well supportedby Lo [ 1986] who modeled the atmosphere. The differences betweenthe presentwork airflowover a polynya, also fundingthat turbulentenergy and that of Pinto et al. could be due to different methods ff
near the surface increased with distance downwind.
parameterisation of TKE. 4.2. Horizontal and Vertical Extent of Turbulent Fluxes Over the polynya, within the region of greatest 4.2.1. Momentum. The vertical cross section of the turbulence,maxima occurtoward the downwind end of the
14
,
TKE
ß .
BUOYANCY
08
06
•0" -20
I -10
0
-o2
-
10
•'• ....
4- ....... 20
•- ....... 30
I-- ....... 40
I-50
I
t
60
70
'
I 80
DISTANCE (kin)
Figure2. Turbulent kinetic energy (TKE),(m'2s'2),shear contribution to TKE(m'2s'3),andbuoyancy contribution to TKE(mø2s'3)atmodel level2 (25m)at6 hours, withthex axisrepresenting horizontal distance andthepolynya located from 0 to 10 km.
DARE AND ATKINSON: ATMOSPHERIC RESPONSETO POLYNYAS
z
vl
v
•
•
i
Z
i
16,695
16,696
turbulentflux of momentum(Figure 3) showsa minimum at 300 m abovethe surfaceof the polynya.As is suggested by the TKE field (Figure 1), turbulent mixing of momentumoccursmost intenselyover the polynya, with downwardtransportof air with highervaluesof horizontal momentum than those nearer the surface,resulting in negativevalues (indicatedby the shadedregion). This pattern of turbulent momentum flux is maintained throughoutthe simulation by TKE (itself maintained
700.•..•..•>:•.`.•:.•:.•..:•::•;:•::;:::•.:•:::;;.*:`..e.•:...:•:•::::•:.•:?•:.:...::::•!.. :-( 60O •
largelyby buoyancyand shear)and by the horizontal advectionfrom upwind of a verticalprofile of wind that 200-/ increasesin strengthfrom the surfaceto about 700 m. Although of the same order of magnitude, the modelgenerated momentumflux is largerthan that observedover ~20 -10 0 10 20 30 40 50 60 70 80 a marginal ice zone by Overland [1985]. There are Horizontaldistance(km) similarities between the shapes of vertical profiles of turbulentmomentumflux presented by Overland [1985], and $tull [1988] and in the presentwork, with minima Figure 3. Vertical cross section of vertical turbulent flux of (contour interval = 0.1N m'2)at 6 hours,with thex located tens to hundreds of meters above the surface. The momentum axis representinghorizontaldistance,the polynya located from
smallperturbations about40 km downwindof the polynya 0 to 10 km (shadedsectionof axis), and the y axisrepresenting wereprobablyassociated with thosein the temperature field height above the surface.Shaded areas representnegative (Figure 6) and appearedto be related to convectionand values. warmingof air due to releaseof heat throughwater phase I000 --• change. 4.2.2.
Heat.
The vertical
cross section of the turbulent
heatflux is shownin Figure4. Over the polynya,the flux is positive (upward)to about 500 m, decreasingwith height and changingsign in the entrainmentzone of the elevatedinversion(500-800 m), a vertical profile that is characteristic of a convectiveboundarylayer [Stull, 1988]. Owing to the absenceof a surface-based inversionin the initial conditions,in accordancewith observationsover the
SouthernOcean,heatandmoistureare not trappednearthe surface,althoughthe elevatedinversion,with its base at about 500 m, is a barrier to fiather vertical development. Over the downwindice, the heat flux is negativenear the surface.This is a stableregion that grows in depth with distancedownwind.It is cappedby the positive heat flux plume that extendsdownwindbut diminishesin vertical thicknesswith distance.With time, this plume reaches
-20
-10
0
10
20
30
40
50
60
70
80
Horizontaldistance(kin)
farther downwind (extending atarateof- 1 kmh'•) butits Figure 4. Vertical cross section of vertical turbulent heat flux (contourinterval= 25 W rn'2) at 6 hours,with the x axis magnitude remains relatively small(< 20W m'2)compared withthelargeheatfluxoverthepolynya (> 375 W m'2). representinghorizontaldistance,the polynyalocatedfrom 0 to Variations in the turbulent heat flux at the surface,which
influencethe vertical heat flux and the air temperature,are
10 km (shadedsection of axis), and the y axis representing height abovethe surface.Shadedareasrepresentnegativeflux values.
discussed in section 4.6.
4.2.3.
Moisture.
The
vertical
cross
section
of
the
turbulentflux of moisture(Figure 5) is fairly similar to the TKE field (Figure 1), with a "plume" emanatingfrom the surfaceof the polynya to a height of about 700 m, and extendingdownwindasfar as 6 km from the downwindend of the polynya. Although the two-dimensionalstructure presentedhere is more complex,it compareswell, in terms of bothmagnitudeandverticalstructure,with the 1-D work of Pinto et al. [1995]. A detailed discussionof cloud evolution is beyond the scopeof this paper, but briefly, cloudinitially formedwithin the boundarylayer extending from the surfaceto 500 m, followedby a lifting of the cloud baseduringthe first hour of the simulation,-mostrapidly immediatelydownwindof the polynya,where the rising air
has low relative humidity, and most slowly over the polynyawherethe moistureflux is a maximum (Figure 5), resultingin the presenceof stratusaroundthe base of the elevatedinversion.This evolution is in good agreement with that describedby Pinto and Curry [ 1995]. 4.3. Air Temperature
The air temperature field illustratesthe generalresponse of the atmosphere to an areaof openwaterwithin sea ice. The verticalcrosssectionof potentialtemperature is shown in Figure6. Upwind of the polynya,at elevations0 to 500 m above the surface, the atmosphere remained approximatelyneutral,with very little horizontalvariation
DARE AND ATKINSON:
ATMOSPHERIC
RESPONSE TO POLYNYAS
16,697
top of the boundarylayer, represented by the elevated inversionat around500 m. The changein temperatureof the air above the polynya is dependentmainly on horizontaladvectionof cold air from upwind and vertical diffusionof heatfrom the warm surface.The verticalprofile
900 --• 800 --} 700 -'
2
of heatflux that evolvesis maintainedbecauseits warming
3
4
_
600 -
effectis continuallyoffsetby horizontaladvectionof cold air, withoutwhich the atmosphere overthe polynyawould be warmerand the heat flux would consequentlyclecrease. Thesetwo factorswere also noted by Burk et al. [1997] predominantly to controlthe air temperature. Borderingthe upwindregionandthe polynyaarenear-vertical isentropes, representative of a coldfront,as cold upwindair flowsinto the warmerregionabovethe polynya.At the top of the boundarylayer,aboveanddownwindof the polynya(> +4 km), the baseof the elevatedinversionhasrisenin response 10 20 30 40 50 60 70 80 HorizontalOstance(km) to heatingfrombelow;it sankat the samelevelsupwind(< +4 km). Downwind, the boundarylayerhas been warmed Figure 5. Vertical crosssection of vertical turbulent moisture at all levels,by about0.6øC.The layerfrom 300 to 500 m flux(contour interval- lx10'2 g S-! m-2)at 6 hours,with thex has increasedits temperaturemarginally more than that axis representinghorizontaldistance,the polynya located from below300 m, leadingto slightthermalstabilitydownwind 0 to 10 km (shadedsectionof axis), and the y axis representing of the polynya. height abovethe surface. _
500 -
400 -
_
_
_
Because of a lack of observations in the Southern Ocean
1000 •---15.1 .........
900 •
.
i ;-'2• • ..............
...... •
seaiceregion,theaccuracy of themodel'sresultis assessed by comparisonwith past observationsand modeling studiesin situationsanalogous to that simulatedhere.Burk et al. [1997] simulatedair flow over a polynyathat was
.
'13.9
-14.1
700
severalkilometerswide, a casethat is thereforereasonably
¾-'--'15.3
•v600 --•'15'9'-----• '•
' '•
500:••• •
155
300•'16•1• $• -20
-10
0
10
comparable with the presentwork. Their Figures2 and 6 have the same generalpattern as Figure 6, which is remarkable considering that they useda very high spatial resolution of 10 m, compared with the 1 km usedhere.The approximately verticalisentropes upwind and near the upwind ice edge in Figure 6 comparewell with observationsof cold air outbreaks [Lenschow, 1973; Overland et al., 1983]. Of course,downwind of the ice
20
30
40
50
60
70
80
edge,similarities betweentheseobservations andthe model disappear because thewidthof theopenwaterregionthat is modeledhere is only 10 km, while the observed polynyas
Honzontaldistance (km)
Figure 6. Vertical cross section of potential air temperature (contour interval = 0.2øC) at 6 hours, with the x axis representinghorizontaldistance,the polynyalocatedfrom 0 to 10 km (shaded section of axis), and the y axis representing height abovethe surface.
in the air temperature. A little warming due to vertical mixing approximately balancescoolingcausedby loss of longwaveradiation,as the air aboveis warmer.In 6 hours since the start of the simulation, the temperatureof the upperregionof theboundarylayer(400 - 500 m abovethe surface)has increased 10 km) the surface pastresearch, wherethe surface heatflux fromopenwater heat flux again decreases with distancebecausethe wind areaswithinseaicewasfoundto decrease with distance,as speedhasreacheda maximum,asdiscussed in section5. a resultof decreases in the heattransfer coefficient [Andreas andMurphy,1986]andthe water-air temperature difference 4.6.2. Over downwind sea ice. Downwind of the [Alam and Curry, 1997] over distanceson the scaleof polynyaover a distanceof tens of kilometers,the surface hundredsof meters.The presentwork has shownthat wind speedis greaterthan that upwindof the polynya beyondabout 1 km, the surfaceheat flux increaseswith (Figure 7). The heat exchangecoefficientis smaller distance, primarilybecause of the spatialincrease in surfacedownwind(Figure 11)owing to the increasedthermal
DARE AND ATKINSON:
ATMOSPHERIC
RESPONSE
TO POLYNYAS
16,705
stabilityof the lower atmosphere (Figure 12). The surface-consequentlydid not significantlycontributeto a further air temperaturedifferenceis increaseddownwind of the increasein surfaceheatflux with distancedownwind.Apart polynyabecausethe air hasbeenwarmedwhile crossingthe from the 10-kmexperiment,maximain the surfaceheat flux polynya,while upwind,Tsu•^cE= T^m.Consequently,the occurredat about14 km over the polynya, with reductions surfaceturbulentheatflux (equation(2)) is influencedby all further downwind due to reduction of the surface-air of three of these factors.The magnitudeof the air to ice temperature difference. As is shown in section 4.6.2, differencesexist between turbulentheatflux is largestimmediatelydownwindof the polynya(Figure 14), with the strongestambientwind case surfaceheat flux over sea ice upwind and downwindof a (15 m s'l) producing the greatest downward heatflux polynya,andvariationsare dependenton the ambientwind overall.The turbulentfluxesoverthe polynyahavebeenset speed.As air is warmedby a greateramountby flowing to zero in this figure to allow definition of the smaller overa wider regionof openwater, thereis largerturbulent fluxes at the ice surfaces. There is further discussion on air to ice turbulent heat flux in section 5.
transfer of heat from this air into the downwind
ice surface.
Themeansof surfaceheatfluxesoverseaice 10 km upwind and 10 km downwindof the polynya for each of the five polynya width experiments(Figure 16) show that the transferof heatbetweenthe atmosphere and ice upwind of 5. Varying Polynya Widths (10 - 50 kin) the polynya is unaffected by changein the width of the This sectionexaminesthe wind speedand surfaceheat polynya,but the magnitudeof the heattransferfi'omair to flux over polynyasthat arewider (20, 30, 40, and 50 km) downwindice increaseswith polynyawidth increase. The resultsof this section,alongwith thoseof section thanthe casediscussedin section4 (10 km). The primary
difference between theresults generated forthe caseof a 10- 4.6.1andpastwork[e.g.,AndreasandMurphy,1986]lead km polynyaand 20- to 50-km polynyasis that the to thefollowingconclusions regarding the spatialvariati'on horizontalwind field evolveswith distanceacrossthe wider of surfaceturbulentheat flux over regions of open water
polynyas, reaching a maximumbeforethe downwindice within seaice. Thereis a largeand suddenincrease in edgeis encountered. As is shownin section4.6.1, the surface heatflux as cold air flowsoff-iceovera relatively windspeed hasa significant effectonthespatialvariationof warmwatersurface. Overthe firstfewhundred metersof a thesurface heatflux.Variations in surface wind speedwith regionof openwater,the surface heatflux decreases with distance forthefivepolynya widthexperiments (Figure15), distance as a resultof reductions in heattransfer coefficient eachhavingbeeninitializedwith the samewind profile, andsurface-air temperature difference. The implications of showthatthewindspeed for the 10-km-width casedid not spatialvariations in windspeedoverthis distance arenot reach its potential maximum, becauseof the air clearandarebeyondthe relativelycoarse resolution of the encountering the downwindice edge, where turbulentpresentwork. As the surface wind is accelerated, largely mixingwas of insufficient magnitude to leadto furtherbecause of verticaldiffusion,thereis an accompanying acceleration of the surfacewind. However,the other four increasein surfaceheat flux with distancedownwind, casesreachedmaxima about 15 to 20 km over the despitethe reductionin surface-air temperature difference. wind respective polynyas. Beyond thisdistance overa polynya,Foraninitialambient ' of 10 m s'•, the surfacewind '
the wind speedvaried very little in eachexperimentand speedreachesa maximum about 15 to 20 km over the
--WS
(10 km) WS (20 km)
132 l
....
WS (30 km)
•
WS (40 kin)
......
WS (50 km)
13
128
126-124 l I
-20
-10
122 I 12
0
10
20
30
40
5O
60
7O
DISTANCE (kin)
Figure15. Surface windspeed(ws,ms-•,y axis)versus distance (x axis)at 6 hoursforexperiments with polynya widths of 10, 20, 30, 40, and 50 km.
16,706
DARE AND ATKINSON:
ATMOSPHERIC
RESPONSE TO POLYNYAS
o
._•__ uPWiND DOWNWIND
-20
10
1 20
I 30
I 40
POLYNYA WIDTH(kin)
Figure16.Spatial meansurface turbulent heatfluxoverseaice(W m'2,y axis)for 10kmupwindofthepolynyaandfor 10 km downwindof the polynyafrom experiments of varyingpolynyawidth (10 to 50 km, x axis).
butwascaused mainlyby the polynya(Figure15).Downwindof thislocation,the spatial duein partto divergence variationin surface-air temperature difference becomesthe horizontaladvectionfrom upwind of cold, subsidingair main factorinfluencingspatialchangein the surfaceheat over sea ice, being of larger magnitudethan the upward flux, causinga decrease in flux with distanceacrossthe buoyancyforce due to heating of air at the polynya's polynya.This spatialpatternof decrease, then increase,surface.Towards the downwindend of the polynya and followedagainby decrease in heatflux hasnot previously over the downwind ice, the air decelerated,causing convergence and ascent.The boundarybetweenthe region of descemand the downwindregion of convergence moves fartherdownwind for experimentsusing larger ambient wind speeds.The base height of the elevatedinversion decreased upwind (< +4 km) but increaseddownwind (> +4 km). The acceleration,divergenceand descentof air over the polynya are well supportedby observationsand pastmodeling,althoughthesefeaturesand the mechanisms behindthem have not previouslybeen explainedin detail for the situationof air flow overpolynyas.
beenpresented. 6. Conclusion
A numericalmodel of the atmosphericboundarylayer hasbeenusedto simulateatmosphericresponseto a sea ice region containinga single polynya, the width of which variedbetweenexperiments(10, 20, 30, 40, and 50 km). The modelwas initialized with datarepresentative of mean winter conditions in the Southern Ocean surrounding Antarctica, rather than those representativeof extreme conditions or of the colder Arctic sea ice region. Although surfaceheat fluxes are generallyexpectedto Experimentsconductedusedinitial ambientwind speedsof decrease with distanceacrossareasof openwaterin seaice 0,5,10andl5ms -•. regions, because of the reduction in the surface-air differenceas the air is warmed, the surfaceheat Over the polynyaa plume of turbulencewas generated temperature as a result of both vertical wind
shear and an increase in
flux was found to increase with
distance over the eraire
buoyancy.As a consequence, higher momentumair was lengthof the 10-km-widepolynya, and up to about20 km the mixed downwardtowardsthe surface,reducingthe wind for the wider polynyasmodelled.This occurredbecause speed300- 500 m above the surfacebut causingan increasein wind speedwasa greatercontributorto the heat accelerationin the horizontal wind at the surface(10 m) flux than was the reduction in ocean-air difference. This fi'omover the seaice to over the openwater. Initially, the result meansthat it is importantto considerthe spatial reduction in surface stress fi'om flow over ice to over water variationin wind speedwhen assessingturbulent surface also contributedto the accelerationof the surfacewind, but fluxesover areasof openwaterin sea ice. Combiningthe by 10 min, the stressoverthe waterwas greaterthan that resultsof the presentwork with thoseof previousauthors, overthe ice dueto the increasein dragcoefficient and wind the surface heat flux over the first few hundred meters of a speed.The dragcoefficientincreased becauseof the thermal polynyamay decrease as a consequence of decrease in heat instabilityof the atmosphere over the polynyaand because transfercoefficiem[AndreasandMurphy,1986] and surfacethe roughness of the watersurface was proportionalto the air temperaturedifference[Alam and Curry, 1997], but wind speed.The accelerationof the surfacewind caused downwind, beyond about 1 km, the heat flux increases horizontaldivergence.Descentof air over the polynyawas owing to the greaterwind speed.Even fartherdownwind,
DARE AND ATKINSON:
ATMOSPHERiC
RESPONSE
TO POLYNYAS
16,707
boundary layer modification, drag coefficient and surface for the wider polynyas(>10 km), the surfaceheat flux heat flux in the Antarctic marginal ice zone, d. Geophys. decreases with distancebeyondthe point wherethe wind speedhas reacheda maximum, becausethe surface-air Res., 89, 649-661, 1984. temperature difference dominatesthe spatial variation in Atkinson, B.W., Orographic and stability effectson valleysurface heat flux.
side drainage flows, Boundary Layer Meteorol., 75, 403-
428, 1995.
Downwindof a polynya,thereis turbulenttransferof Barry,R.G., M.W. Miles, R.C. Cianflone, G. Scharfen,and R.C. heat fi'omthe atmosphere to the ice surface.Despite an Schnell, Characteristics of Arctic sea ice from remoteincrease in the stabilityof the air overlyingthe ice, this sensing data and their relationship to atmospheric transfer is enhanced because the air has been both warmed
processes,Ann. Glaciol., 12, 9-15, 1989.
andaccelerated by itspassage across the polynya.Although Barry, R.G., M.C. Serreze,J.A. Maslanik, and R.H. Preller, The Arctic seaice - climatesystem:Observations and modelling, an orderof magnitudesmallerthan the fluxesover the polynya'ssurface, the air-iceturbulentflux is significant Rev. Geophys.,31, 397-423, 1993. comparedwith that over the surrounding(including Benech, B., J. Noilhan, A. Druilhet, J.M. Brustet, and C. Charpentier,Experimental study of an artificial thermal upwind)icesurface. plume in the boundarylayer, I, Flow characteristicsnear the The resultspresented have importantconsequences for heat source,d. Clim. Appl. Meteorol.,25, 418-437, 1986. planningof field experiments.For example,the resultsof Bmmmer,B., Boundary-layer modification in wintertime cold the simulations mean that a field observation of the wind at
air outbreaks from the Arctic sea ice, Boundary Layer
the upwind ice edge of the polynya is not necessarily Meteorol., 80, 109-125, 1996. representative of the atmosphere upwindof, and undisturbed Bintamer,B., Boundary layer mass,water and heat budgets in wintertime cold-air outbreaks from the Arctic sea ice, Mon. by, the polynyabecausethe surfacewind is accelerated up Weather Rev., 125, 1824-1837, 1997. to 5 km upwind over the ice. The results also have Brummer,B., B. Rump,andG. Kruspe,A cold air outbreak near important consequences for assessmentof fluxes, and Spitsbergenin springtime -Boundary-layer modification thereforefor modelingof fluxesin a large-scale model (e.g., and cloud development,BoundaryLayer Meteorol., 61, 13climatemodel or GCM); it is importantto recognizeand 46, 1992. take into accountspatialvariationsin heatflux due to wind Burk, S.D., R.W. Fett, and R.E. Englebretson, Numerical speed,heat transfercoefficientand surface-airtemperature simulation of cloud plumesemanatingfromArctic leads, d. difference.
Acknowledgment. This work was supported by NERC grant GST/02/1094.
Geophys.Res., 102, 16,529-16,544, 1997. Cavalieri, D.J., and S. Martin, A passive microwave study of polynyas along the Antarctic Wilkes Land coast, in Oceanology of the Antarctic Continental Shelf, Antarct. Res.Ser., vol. 43, edited by S.S. Jacobs,pp. 227-252, AGU, Washington,D.C., 1985. Chiu, L.S., Antarctic
References
sea ice variations
1973-1980,
in
Variations in the Global Water Budget, edited by A. Street-Perrott,M. Beran, and R. Ratcliffe, pp. 301-311, D. Reidel, Norwell, Mass., 1983.
Alam, A., andJ. Curry, Lead-inducedatmosphericcirculations, Comiso,J.C. and A.L. Gordon, Recurring polynyas over the •1.Geophys.Res., 100, 4643-4651, 1995. CosmonautSea and the Maud Rise, d. Geophys. Res., 92, Alam, A., and J.A. Curry, Determination of surfaceturbulent 2819-2833, 1987. fluxesover leads in Arctic sea ice, d. Geophys.Res., !02, den Hartog, G., S.D. Smith, R.J. Anderson, D.R. Topham, and 3331-3343, 1997. R.G. Perkin, An investigationof a polynya in the Canadian Allison, I.F., A samplestudyof the energyfluxesprecedingand archipelago,3, Surfaceheatflux, d. Geophys.Res., 88, 2911accompanying the formationof Antarctic sea ice, in Energy 2916, 1983.
Fluxes over Polar Surfaces, WMO Tech.Note 129, edited Fett, R.W., K.L. Davidson, and J.E. Overland, Opening and by S. Orvig, pp. 115-132, World Meteorol. Organ., Geneva, closing of the "Husky 1" lead complex, in The Polar 1973. Oceans and Their Role in Shaping the Global Allison, I., Pack-ice drift off East Antarctica and some Environment, Geophys Monogr. Ser., vol. 85, edited by implications, Ann. Glaciol., 12, 1-8, 1989a. O.M. Johannessen,R.D. Muench, and J.E. Overland, pp. Allison, I., The East Antarctic sea ice zone: Ice characteristics 455-473, AGU, Washington,D.C., 1994. and drift, Geo•lournal, 18.(1), 103-115, 1989b. Garratt, J.R., The Atmospheric Boundary Layer, 316 pp., Allison, I., C.M. Tivendale, G.J. Akerman, J.M. Tann, and R.H. CambridgeUniv. Press,New York, 1992. Wills, Seasonalvariations in the surfaceenergy exchanges over Antarctic sea ice and coastal waters, Ann. Glaciol., 3, Glendening, J.W., Horizontally integrated atmospheric heat flux froman Arctic lead, d. Geophys.Res., 100, 4613-4620, 12-16, 1982. 1995.
Allison, I., R.E. Brandt, and S.G. Warren, East Antarctic sea ice: Albedo, thickness distribution and snow cover, d. Glendening, J.W. and S.D. Burk, Turbulent transport from an Arctic lead: A large-eddy simulation, Boundary Layer Geophys.Res.,98, 12,417-12,429, 1993. Meteorol., 59, 315-339, 1992. Andreas, E.L., Estimation of heat and mass fluxes over Arctic Hartmann, J., C. Kottmeier, and S. Raasch, Roll vortices and leads, Mon. Weather Rev., 108, 2057-2063, 1980. boundary-layer development during a cold air outbreak, Andreas, E.L., and B. Murphy, Bulk transfer coefficientsfor Boundary Layer Meteorol., 84, 45-65, 1997. heat and momentumover leads and polynyas, d. Phys. Oceanogr., 16, 1875-1883, 1986. Kahl, J.D.W., D.A. Martinez, and N.A. Zaitseva, Long-term Andreas, E.L., C.A. Paulson, R.M. Williams, R.W. Lindsay, variability in the low-level inversion layer over the Arctic and J.A. Businger,The turbulentheat flux fromArctic leads, Ocean, Int. d. Climatol., 16, 1297-1313, 1996. Boundary Layer Meteorol., 17, 57-91, 1979. Knapp, W.W., Formation, persistenceand disappearanceof
Andreas,E.L., W.B. TuckerIII, and S.F. Ackley, Atmospheric
open water channels related to the meteorological
16,708
DARE AND ATKINSON:
ATMOSPHERIC
RESPONSE
TO POLYNYAS
conditions along the coast of the Antarctic continent, in Pinto, J.O., J.A. Curry, and K.L. Mclnnes, Atmospheric Polar Meteorology, WMO Tech. Note 87, pp. 89-104, convectiveplumes emanatingfromleads, 1, Thermodynamic World Meteorol. Organ., Geneva, 1967. structure,d. Geophys.Res., 100, 4621-4631, 1995. Kondratyev, K.Y., O.M. Johannessen,and V.V. Melentyev, Russell-Head, D. and I. Simmonds,Temporal structure of High Latitude Climate and Remote Sensing, 200 pp., surfaceweather parametersat Casey, Davis, Mawson, and Praxis, Chichester, U.K., 1996. MacquarieIsland, Rep. 35, 181 pp., Meteorol. Sect.,Sch.of Kottmeier, C. and D. Engelbart, Generation and atmospheric Earth Sci., Univ. of Melbourne, Parkville, Victoria, Australia, 1993. heat exchangeof coastal polynyas in the Weddell Sea, Boundary Layer Meteorol., 60, 207-234, 1992. Schnell, R.C, R.G. Barry, M.W. Miles, E.L. Andreas, L.F. Kottmeier, C. and R. Hartig, Winter observations of the Radke, C.A. Brock, M.P. McCormick, and J.L. Moore, L idar atmosphereover Antarctic sea ice, d. Geophys. Res., 95, detection of leads in Arctic sea ice, Nature, 339, 530-532, 16,551-16,560,
1990.
1989.
Kurtz, D.D., and D.H. Bromwich, A recurring, atmospherically Simmonds,I. and W.F. Budd, Sensitivity of the Southern forcedpolynya in Terra Nova Bay, in Oceanology of the Hemispherecirculationto leadsin the Antarcticpack ice, Q. Antarctic Continental Shelf Antarct. Res. Ser., vol. 43, J. R. Meteorol. Soc., 117, 1003-1024, 1991. edited by S.S.Jacobs,pp. 177-201, AGU, Washington, D. Smith,S.D., R.J.Anderson,G. den Hartog, D.R. Topham,and C., 1985. R.G. Perkin, An investigationof a polynya in the Canadian Lenschow, D.H., Two examplesof planetary boundary layer archipelago, 2, Structure of turbulence and sensible heat modification over the Great Lakes, J. Atmos. Sci., 30, 568flux, J. Geophys.Res.,88, 2900-2910, 1983. 581, 1973. Smith, S.D., R.D. Muench,andC.H. Pease,Polynyasand leads: Lo, A.K.-F., On the boundary layer flow over a Canadian An overview of physical processesand environment,d. archipelagopolynya, Boundary Layer Meteorol., 35, 53-71, Geophys.Res., 95, 9461-9479, 1990. 1986. Stone, R.S., and J.R. Key, The detectability of Arctic leads Lytle, V.I., and S.F. Ackley, Heat flux through sea ice in the using thermal imagery under varying atmospheric western Weddell Sea: Convective and conductive transfer conditions,J. Geophys.Res., 98, 12,469-12,482, 1993. processes,J. Geophys.Res., 101, 8853-8868, 1996. Streten,N.A., Satelliteobservations of the summerdecayof the Martinson, D., and C. Wamser, Ice drift and momentum Antarcticsea-ice,Arch. Met. Geophys.Bioklimatol., Set. ,4, 22, 119-134, 1973. exchangein winter Antarctic pack ice, d. Geophys.Res., 95, 1741-1755, 1990. Streten,N.A., and D. Pike, Some observations of the sea-ice in Maslanik,J.A., andJ. Key, On treatmentsof fetch and stability the southwestIndian Ocean,,4ust.Meteorol. Mag., 32, 195206, 1984. sensitivityin large-area estimatesof sensible heat flux over sea ice, J. Geophys.Res., 100, 4573-4584, 1995. Stull, R., An Introduction to Boundary Layer Meteorology, Massom, R.A., M.R. Drinkwater, and C. Haas, Winter snow 452 pp., Kluwer Acad., Norwell, Mass., 1988. cover on sea ice in the Weddell Sea,d. Geophys.Res., 102, Tapp, M.C., and P.W. White, A non-hydrostatic mesoscale 1101-1117, 1997. model, Q. d. R. Meteorol. Soc., 102, 277-296, 1976. Maykut, G.A., and N. Untersteiner, Some results •om a time- Vihma, T., Subgrid parameterizationof surface heat and dependentthermodynamicmodel of sea ice, d. Geophys.Res., momentum fluxesover polar oceans,d. Geophys.Res., 100, 76, 1550-1575, 1971. 22,625-22,646, 1995. Mellor, M., Sea ice measurementsat Mawson and Davis, 1954-
Vowinckel,E., andS. Orvig, The inversionof the polar ocean,
58, Interim Rep., Aust. Nat. Antarct. Res. Exped., 19, 1960. in Polar Meteorology, WMO Tech. Note 87, pp. 39-59, Overland,J.E., Atmosphericboundarylayer structureand drag World Meteorol. Organ., Geneva, 1967. coefficientsover sea ice, d. Geophys. Res., 90, 9029-9049, Wamser,C., and D.G. Martinson, Drag coefficientsfor winter 1985. Antarctic pack ice, d. Geophys. Res., 98, 12,431-12,437, 1993. Overland, J.E., and K.L. Davidson, Geostrophic drag coefficients over sea ice, Tellus, Set. ,4, 44, 54-66, 1992.
Worby, A.P., and I. Allison, Ocean-atmosphereenergy
Overland,J.E., R.M. Reynolds, and C.H. Pease,A model of the exchangeover thin, variable concentrationAntarctic pack ice, Ann. Glaciol., 15, 184-190, 1991. atmosphericboundary layer over the marginal ice zone, d. Geophys.Res., 88, 2836-2840, 1983. Yuen, C.-W., Dynamical modeling of flow in cumulus-filled Parkinson, C.L., and D.J. Cavalieri, Interrannual sea-ice boundarylayers,d. Atmos.Sci., 42, 113-134, 1985a. variations and sea-ice/atmospheric interactions in the Yuen, C.-W., Simulations of cold surges over oceans with Southern Ocean, 1973-1975, ,4nn. Glaciol., 3, 249-254, application to AMTEX '75, d. Atmos. Sci., 42, 135-154, 1982.
1985b.
Parkinson, C.L. and W.M. Washington, A large-scale Zwally, H.J., C.L. Parkinson, and J.C. Comiso, Variability of numericalmodel of sea ice, d. Geophys. Res., 84, 311-337, Antarctic sea ice and changes in carbon dioxide, Science, 1979.
220, 1005-1012, 1983.
Parkinson, C.L., J.C. Comiso, H.J. Zwally, D.J. Cavalieri, P. Gloersen, and W.J. Campbell, Arctic sea ice, 1973-1976: Satellite passive-microwaveobservations, NASA Spec. R. A. Dare and B. W. Atkinson,Departmentof Geography, Publ., SP-489, 296 pp., 1987. QueenMary and Westfield College, University of London, Phillpot, H.R., and J.W. Zillman, The surface temperature Mile End Road, LondonE1 4NS, England. inversionover the Antarctic continent,d. Geophys.Res., 75, (b.w.atkinson•}qm w.ac.uk) 4161-4169, 1970. Pinto, J.O., and J.A. Curry, Atmospheric convective plumes emanating •om leads, 2, Microphysical and radiative (ReceivedJuly 12,1998;revisedFebruary8, 1999; processes,d. Geophys.Res., ! 00, 4633-4642, 1995. acceptedFebruary24, 1999.)