Nov 29, 2010 - HAL is a multi-disciplinary open access ... L'archive ouverte pluridisciplinaire HAL, est ..... oxidation/hot corrosion resistance (Erickson, 1993).
Numerical modeling of fatigue crack growth in single crystal nickel based superalloys Ozgur Aslan
To cite this version: Ozgur Aslan. Numerical modeling of fatigue crack growth in single crystal nickel based su´ peralloys. Materials. Ecole Nationale Sup´erieure des Mines de Paris, 2010. English. .
HAL Id: pastel-00540893 https://pastel.archives-ouvertes.fr/pastel-00540893 Submitted on 29 Nov 2010
HAL is a multi-disciplinary open access archive for the deposit and dissemination of scientific research documents, whether they are published or not. The documents may come from teaching and research institutions in France or abroad, or from public or private research centers.
L’archive ouverte pluridisciplinaire HAL, est destin´ee au d´epˆot et `a la diffusion de documents scientifiques de niveau recherche, publi´es ou non, ´emanant des ´etablissements d’enseignement et de recherche fran¸cais ou ´etrangers, des laboratoires publics ou priv´es.
INSTITUT DES SCIENCES ET TECHNOLOGIES
École doctorale nO 432 : Science des Métiers de l’Ingénieur
Doctorat européen ParisTech THÈSE pour obtenir le grade de docteur délivré par
l’École nationale supérieure des mines de Paris Spécialité « Sciences et Génie des Matériaux » présentée et soutenue publiquement par
Ozgur ASLAN le 29 Mars 2010
Simulation numérique de la fissuration par fatigue dans les monocristaux de superalliages à base de nickel ∼∼∼
Numerical modeling of fatigue crack growth in single crystal nickel based superalloys Directeur de thèse : Samuel FOREST
Jury Ron PEERLINGS, Professeur,Technische Universiteit Eindhoven Rapporteur Sylvie POMMIER, Professeur, Ecole Normale Supérieure de Cachan Rapporteur Jean-Louis CHABOCHE, Professeur, ONERA Président & Examinateur Paul STEINMANN, Professeur, Universitaet Erlangen–Nurnberg Examinateur Francois VOGEL, Ingénieur de recherche, Turboméca Examinateur Stephane QUILICI, Maitre de recherche, Centre de Matériaux, MINES ParisTech Examinateur Samuel FOREST, Professeur, Centre de Matériaux, MINES ParisTech Directeur de thèse MINES ParisTech Centre de Matériaux CNRS UMR 7633 B.P. 87, 91003 EVRY Cedex, France
T H È S E
R´ esum´ e
Les composants monocristallins fonctionnant `a des temp´eratures ´elev´ees sont soumis `a des conditions de chargement thermo-m´ecanique s´ev`eres. La g´eom´etrie et le comportement de ces composants sont tr`es complexes. Un d´efi majeur est de d´evelopper des mod`eles math´ematiques afin de pr´evoir l’initiation et la propagation de fissures en pr´esence de contraintes importantes et de forts gradients de temp´erature. Dans ce cas, le comportement ´elastoviscoplastique fortement anisotrope du mat´eriau ´etudi´e (superalliage ` a base Ni) doit ˆetre pris en compte. Le mod`ele correspondant doit ˆetre en mesure de rendre compte de la croissance anisotrope des fissures et de leur bifurcation dans des champs de contrainte complexes. De plus, le mod`ele doit ˆetre capable de pr´edire non seulement le taux de croissance des fissures mais aussi les chemins de fissuration. La m´ecanique de l’endommagement anisotrope est un cadre th´eorique bien adapt´e au d´eveloppement de mod`eles de croissance de fissures dans les monocristaux. Au cours d’´etudes pr´ec´edentes, une loi de comportement couplant plasticit´e cristalline et endommagement cyclique a ´et´e d´evelopp´ee, d´emontrant l’int´erˆet de cette approche, mais aussi ses limites, notamment du fait de la d´ependance au maillage des r´esultats. Le d´eveloppement r´ecent de mod`eles non-locaux dans le cadre de la m´ecanique des milieux continus pourrait ainsi aider `a surmonter ces difficult´es. Une grande base exp´erimentale existe concernant l’initiation et la propagation de fissures dans les superalliages monocristallins ` a base de nickel. Les simulations thermom´ecaniques par ´el´ements finis des aubes de turbine fournissent des informations d´etaill´ees sur la distribution des contraintes et des d´eformations plastiques, en particulier pr`es de singularit´es g´eom´etriques comme les trous et les fentes de refroidissement. Tout d’abord, sur la base de la th´eorie de la plasticit´e cristalline qui ´etablit un lien solide entre les contraintes et les d´eformations plastiques, un mod`ele d´ecoupl´e en m´ecanique de l’endommagement bas´e sur l’historique des calculs par ´el´ements finis sera pr´esent´e. Ensuite, un mod`ele d’endommagement incr´emental bas´e sur les milieux g´en´eralis´es sera propos´e et enfin, les pr´edictions du mod`ele pour l’initiation et la croissance de micro-fissures en r´esolvant le probl`eme de d´ependance au maillage seront discut´es.
Mots cl´ es: Plasticit´e cristalline, M´echanique de l’endommagement, Rupture ductile, Localisation, La propagation de fissure, R´egularisation, Milieux continus d’ordre sup´erieur, Th´eorie micromorphique
Abstract
Single crystal components operating at elevated temperatures are subjected to severe thermomechanical loading conditions. The geometry and behaviour of these components are now very complex. A major issue is to develop models to predict crack initiation and crack growth in the presence of strong stress and temperature gradients. The strongly anisotropic elastoviscoplastic behaviour of the material which is a single crystal nickel base superalloy, must be taken into account. The corresponding model should be able to account for anisotropic crack growth and crack bifurcation in complex stress fields. Moreoever the model must be capable of predicting not only the crack growth rate but also the non-straight crack paths. Anisotropic damage mechanics is a well-suited theoretical framework for the development of crack growth models in single crystals.A model coupling crystal plasticity and cyclic damage has been developed in a previous project, that shows the interest of the approach, but also its current limits, in particular the strong mesh dependence of the results. Recent development of nonlocal models within the framework of the mechanics of generalized continua could help overcoming these difficulties. A large experimental basis exists concerning initiation and crack growth in single crystal nickel base superalloys. Finite element simulations of the thermomechanics of turbine blades provide detailed information about stress and plastic strain distribution, in particular near geometrical singularities like cooling holes and slits. First of all, on the basis of crystal plasticity theory which provides a solid link between stress and plastic strains, an uncoupled damage mechanics model based on the history of FE calculations will be presented. Afterwards, an incremental damage model based on generalized continua will be proposed and model predictions for the initiation and growth of microcracks by solving the mesh dependency, will be discussed.
Keywords: Crystal Plasticity, Damage mechanics, Ductile fracture, Localization, Crack growth, Regularization, Higher order continua, Micromorphic theory
Acknowledgements I would first and foremost like to express my sincere gratitude and thanks to Prof. Samuel Forest for his unconditional support and guidance during the course of this research. My appreciation for his encouragement, patience and friendship goes beyond the limit of words. His vast knowledge on theoretical and computational mechanics has always inspired me and his perfectionism in research stimulated my motivation and creativity to put forth my best effort. I am also grateful for the freedom that he gave me in pursuing my ideas which certainly provided me the great opportunity to work as an independent researcher. I would like to devote my sincere thanks to Prof. Jean-Louis Chaboche for his enlightening and constructive advices in addition to his acceptance to become the president of my defense jury. I would also like to thank Prof. Sylvie Pommier and Prof. Ron Peerlings for their acceptance to become a referee of my dissertation. Their efforts in reviewing the drafts of the manuscript have certainly improved the contents of this thesis. Furthermore, I am thankful to Prof. Paul Steinmann and Francois Vogel for their active participation in the jury with valuable comments. The outstanding assistance and guidance from Dr. Stephane Quilici concerning the numerical aspects of this research deserves a great deal of credits. I am also very thankful for his contribution to the defense jury. I would like to gratefully acknowledge the financial support of European Commission within project PREMECCY with the contract number AST5-CT-2006-030889. I am thankful to the members of CdM, especially my office mates Nicolas Cordero, Bahram Sarbandi and Edouard Pouillier who have made my working environment pleasant and productive. A special thank goes to Guillaume Abrivard for his friendship and his participation in our fruitful scientific and philosophical discussions. My sincere thanks go to Prof. Emin and Ayse Bayraktar for providing me a warm family atmosphere which I needed most, especially at the beginning of my journey in France. Without their constant support and care, I would have never adapted to the challenging life of Paris. It is impossible to adequately express my gratitude to my family especially to my parents Riza and Turkan Aslan and my sister Mehtap Konakci for their endless love and support providing me the necessary faith and strength to pursue my goals. My final and most heartfelt acknowledgement must go to my future wife Duygu Akkanat for her constant care, supportive companionship and everlasting love...
Paris, March 2010
Ozgur Aslan
Essentially, all models are wrong; the practical question is how wrong do they have to be to not be useful... George E. P. Box.
Contents II
Introduction
1
I.1
Background . . . . . . . . . . . . . . . . . . . . . . . . . . . . . . . . .
1
I.2
PREMECCY Project . . . . . . . . . . . . . . . . . . . . . . . . . . . .
4
I.3
Scope and outline . . . . . . . . . . . . . . . . . . . . . . . . . . . . . .
6
II II
Single Crystal Nickel Based Superalloys
9
II.1
Microstructure . . . . . . . . . . . . . . . . . . . . . . . . . . . . . . . .
9
II.2
Heat Treatment . . . . . . . . . . . . . . . . . . . . . . . . . . . . . . .
12
II.3
Deformation Mechanisms . . . . . . . . . . . . . . . . . . . . . . . . . .
15
II.3.1
Plastic Slip of Single Crystals . . . . . . . . . . . . . . . . . .
15
II.3.2
Schmid Law . . . . . . . . . . . . . . . . . . . . . . . . . . . .
19
Fatigue Behaviour . . . . . . . . . . . . . . . . . . . . . . . . . . . . . .
20
II.4.1
Orientation dependence
. . . . . . . . . . . . . . . . . . . . .
24
II.4.2
Temperature dependence . . . . . . . . . . . . . . . . . . . . .
24
II.4.3
Strain rate dependence . . . . . . . . . . . . . . . . . . . . . .
25
II.4.4
Environmental effects . . . . . . . . . . . . . . . . . . . . . . .
25
II.4.5
Creep-Fatigue effects . . . . . . . . . . . . . . . . . . . . . . .
25
II.4.6
Fatigue crack initiation . . . . . . . . . . . . . . . . . . . . . .
26
II.4.7
Fatigue crack propagation . . . . . . . . . . . . . . . . . . . .
26
II.4
III III
Constitutive Modeling of Single Crystals
31
III.1
Introduction . . . . . . . . . . . . . . . . . . . . . . . . . . . . . . . . .
31
III.2
Constitutive modeling history . . . . . . . . . . . . . . . . . . . . . . .
32
III.3
Thermomechanics of elastoviscoplastic single crystals . . . . . . . . . .
33
III.3.1
Coleman’s exploitation method . . . . . . . . . . . . . . . . .
34
III.3.2
Presentation of a crystallographic model . . . . . . . . . . . .
35
Parameter Identification . . . . . . . . . . . . . . . . . . . . . . . . . .
38
III.4 IV IV
Life-time Assessment Modeling of Single Crystals
43
IV.1
Introduction . . . . . . . . . . . . . . . . . . . . . . . . . . . . . . . . .
43
IV.2
General formulation of the multiaxial creep-fatigue model . . . . . . . .
45
IV.3
Thermomechanical formulation . . . . . . . . . . . . . . . . . . . . . .
46
IV.4
Creep-fatigue damage cumulation for complex loadings . . . . . . . . .
48
6
TABLE OF CONTENTS
IV.5 IV.6 IV.7 IV.8 IV.9
Parameter identification . . . . . . Validation based on CCF tests . . . Post-processing . . . . . . . . . . . Goodman diagram predictions . . . Application to real-life components IV.9.1 Notched geometry . . . . . IV.9.2 Advanced specimens . . .
. . . . . . .
. . . . . . .
. . . . . . .
. . . . . . .
. . . . . . .
. . . . . . .
. . . . . . .
. . . . . . .
. . . . . . .
. . . . . . .
. . . . . . .
. . . . . . .
. . . . . . .
V V Microdamage modeling of crack propagation in single V.1 Introduction . . . . . . . . . . . . . . . . . . . . . . . . . . V.2 Strain-based damage model coupled with crystal plasticity V.3 Mesh dependency and regularization . . . . . . . . . . . . V.4 Micromorphic continuum . . . . . . . . . . . . . . . . . . . V.5 Microstrain continuum . . . . . . . . . . . . . . . . . . . . V.5.1 Balance and constitutive equations . . . . . . . . V.5.2 Application to 1D problem: . . . . . . . . . . . . V.5.3 Classical linear softening . . . . . . . . . . . . . . V.5.4 Modified damage threshold function . . . . . . . . V.5.5 Examples . . . . . . . . . . . . . . . . . . . . . . V.6 Microdamage continuum . . . . . . . . . . . . . . . . . . . V.6.1 Balance and constitutive equations . . . . . . . . V.6.2 Solution for 1D bar . . . . . . . . . . . . . . . . . V.6.3 Examples . . . . . . . . . . . . . . . . . . . . . . V.7 Fatigue crack closure effects . . . . . . . . . . . . . . . . . V.8 Finite element implementation . . . . . . . . . . . . . . . . V.8.1 Variational formulation and discretization . . . . V.8.2 Implicit incremental formulation . . . . . . . . . . V.9 Mixed element . . . . . . . . . . . . . . . . . . . . . . . . . V.10 Model validation . . . . . . . . . . . . . . . . . . . . . . . . V.11 Application to fatigue crack growth in single crystals . . . V.12 Multi-plane concepts . . . . . . . . . . . . . . . . . . . . . VI VI
. . . . . . .
. . . . . . .
. . . . . . .
. . . . . . .
. . . . . . .
. . . . . . .
crystals . . . . . . . . . . . . . . . . . . . . . . . . . . . . . . . . . . . . . . . . . . . . . . . . . . . . . . . . . . . . . . . . . . . . . . . . . . . . . . . . . . . . . . . . . . . . . . . . . . . . . . . . . . . . . . . . . . . . . . . . . . . . . . . . . . . .
Conclusion
. . . . . . .
50 51 53 55 61 61 68
. . . . . . . . . . . . . . . . . . . . . .
71 72 74 77 78 82 82 83 83 85 88 90 90 91 92 93 98 98 101 103 107 109 111 117
A A
Elastic relations for micromorphic and microstrain continua
121
B B
Model problems
125
C C
Parameters
137
Chapter -I-
Introduction
Contents
I.1
I.1
Background . . . . . . . . . . . . . . . . . . . . . . . . . . . .
1
I.2
PREMECCY Project . . . . . . . . . . . . . . . . . . . . . .
4
I.3
Scope and outline . . . . . . . . . . . . . . . . . . . . . . . . .
6
Background
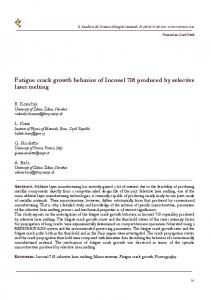
Due to its remarkable material properties, superalloys have been used in many advanced engineering applications, especially in integrated circuits, high-tech wires, blades of gas turbines in jet engines, space vehicles and nuclear reactors. The term ’superalloys’ stands for a group of complex alloys which are high temperature resistant materials capable of retaining very high strength at elevated temperatures. Historically, superalloys originate from the research conducted on steels at the time of First World War (Durand-Charre, 1997). During this period researchers in France and USA studied the first samples of Fe-based alloys for land-base gas turbine engines and jet engines. In 1940s especially during the Second World War, superalloys became the optimal materials for the severe thermomechanical conditions in the hot sections of gas turbine engines. In the following decades, application area of superalloys extensively broadened and significant improvements in the thermomechanical properties have been achieved, bringing a diverse population of superalloys. Today, depending on their base material, superalloys can be basically considered in three categories; nickel based, nickel-iron based and cobalt based superalloys (Donachie, 1984) which are produced as polycrystalline, directionally solidified and single crystal (Fig. I.1) or by powder metallurgy. Depending on the optimization of microstructural properties, each processing technique addresses to a specific application having unique advantages and drawbacks.
2
CHAPTER I. INTRODUCTION
(a) Polycrystal
(b) Directionally Solidified
(c) Single Crystal
Figure I.1 : Superalloy turbine blades with different microstructures (Bhadeshia, 2003).
Having superior heat and corrosion resistance compared to nickel-iron and cobalt based superalloys, nickel based superalloys exhibit higher strength at elevated temperatures. Therefore, in the modern application of superalloys, nickel-based superalloys became the primary material used in high temperature applications (Smith, 1981; Brooks, 1984). For instance, in gas turbine engines, higher turbine inlet temperature results in higher thermodynamic efficiency; therefore, a great demand for materials resistant to creep, thermomechanical fatigue and high temperature corrosion arises. Due to the grain boundary initiated cracking mechanism that becomes significant a polycrystalline structure is not very favourable for that kind of application. Although, directionally solidified structure provides admissible creep strength and axial thermal fatigue, they suffer from grain boundaries parallel to the primary loading direction resulting in poor performance in transversal strength and ductility. However, the absence of grain boundaries in single crystal nickel based superalloys provides considerable alloying and heat treatment flexibility, improving the strength, corrosion and oxidation resistance (Kear and Piearcey, 1967; Swanson et al., 1986). Consequently, single crystals manifest themselves as the most suitable materials for the turbine blades in jet engines and gas turbines. Figure I.4 presents a schematic layout of a generic gas turbine engine and how the air flows through the structure. First, the air is drawn into the inlet with a fan. A compressor made up of fans with many blades and attached to a shaft raises the pressure of the air and introduces it to the combustion chambers. The compressed air is then sprayed with fuel and an electric spark ignites the mixture. The burned gas expands and blasts through the nozzle passing over the turbine blades which are connected to the central shaft by the turbine discs. The hot mixture rotates the blades
I.1. BACKGROUND
Figure I.2 : Schematic of a gas turbine engine (Aviation, 2004)
and the rotation is transferred to the compressor blades at the front which boosts the engine thrust. The color in the layout represents the increase of the temperature as blue stands for cold sections while red represents the hot sections. As it is clear from the figure, turbine blades are operating under very high temperature and stress levels as they are subjected to high gravitational forces and vibrations, while the temperature may increase up to 1100 o C.
Figure I.3 : M88 Snecma jet engine (left), compressor, combustion chamber and Snecma turbine (right).
Operation principle of gas turbine engines depends on Newton’s third law of physics. After the ignition, the blasted gas exerts equal force to all directions and as the gas sprayed out from the rear, it generates a force in the direction opposite to their motion providing the forward thrust. Therefore, engine performance is directly related to the operating temperatures, since the higher the inlet temperature, the higher the velocity of the gas and so the thrust. For this reason, research in this field focuses on the extension of the high temperature capabilities of the materials used in the turbine section in order to improve the efficiency and overall performance. In the last 30 years, the advances in temperature and stress capability of the turbine
3
4
CHAPTER I. INTRODUCTION
blades result from the development of the first-generation single crystal nickel-based superalloys. Having similar mechanical properties, these first-generation alloys are PWA1480, Rene N4, SRR 99, RR 2000, AF 56, AM1, AM3, CMSX-2, CMSX-3 and CMSX-6 (Harris et al., 1993). Together with the experience from the turbine blade industry, the intensive research conducted on the first-generation single crystal nickel based superalloys, resulted in development of second and third generation alloys with improved thermomechanical properties. Among these new generation alloys, CMSX-4 offers considerable improvement in creep-fatigue resistance and exhibits significant performance in retaining its strength at very high temperatures. This is primarily due to the presence of rhenium which enhances the creep-fatigue properties (Leverant and Kear, 1970). It is also a commercially available alloy which makes it one of the key materials for the turbine blade industry. In that sense, including 9 major European gas turbine manufacturers 6th frame European project called PREMECCY has also picked CMSX-4 as a key material in order to develop new prediction methods for use in design process. Next section is dedicated to the presentations of PREMECCY project and its impact on the overall work.
Figure I.4 : Siemens turbine rotor (left), turbine blade (middle), temperature gradients on a turbine blade (right).
I.2
PREMECCY Project
6th frame European project called PREMECCY (Predictive Methods for the Combined Cycle Fatigue in Gas Turbine) with the contract number AST5-CT-2006030889 aims at identifying the field of rotor blade Combined Cycled Fatigue (CCF) as an area where there are shortcomings in the existing industry standard design and prediction tools and thus where significant benefits can be achieved (PREMECCY, 2006). The primary goal of the project is to enhance current design capability,
I.2. PREMECCY PROJECT
resulting in reduced development cost and time, improved component efficiency and improved component reliability. To achieve that PREMECCY brings together a number of leading European gas turbine manufacturers and academic institutions (See table I.1). The programme has a total budget of 6.7 million Euro with an EC funding contribution of 3.7 million Euro. Modern gas turbine blades are designed to resist, rather than eliminate, the stresses generated in a resonant condition during service life. The key part of the overall design process is to satisfy an adequate High Cycle Fatigue (HCF) strength of a rotor blade. However, HCF is not the only damage mechanism which determines the remaining life and rotor integrity, other mechanism such as Low Cycle Fatigue (LCF) and Creep are inevitable in the gas turbine environment. Superimposed with the HCF, these mechanisms have considerable influence on the lifetime. Therefore, a proper superposition of all damage mechanisms, generally termed as CCF, is necessary to understand and develop methods to predict lifetime and HCF integrity of components operating under the gas turbine environment. In order to address the stated research objectives the PREMECCY project will carry out the following key tasks: 1. Design advanced test specimens, geometrically representative of rotor blade critical features. 2. Define and execute a matrix of traditional testing to fully characterise the materials in question. 3. Modify existing test rigs to allow CCF testing of advanced specimens at mechanically and environmentally representative conditions. 4. Define and execute a matrix of advanced specimen testing to explore the effect of a range of CCF mechanisms on life. 5. Develop new and enhanced CCF prediction methods and tools founded on existing deformation modelling techniques and using the characterisation and advanced test data generated within the test matrices. This thesis accepts the final task of the project as a major objective which is to develop an advanced methodology in order to estimate the lifetime of the complex single crystal components of the turbine blades under CCF by assessing the advanced experimental data generated within the project. In that sense, PREMECCY programme is dedicated to share the outcomes of the state of the art academic approaches with the industrial partners which will yield a reduction in engine development costs and an increase in component reliability and efficiency. By doing so, Europe will remain competitive in the market and improve its advantage in the high value-added areas of knowledge and design capability.
5
6
CHAPTER I. INTRODUCTION
Participant name Rolls-Royce plc (Coordinator)
Short name RR
Country UK
Rolls-Royce Deutschland Ltd & Co KG
RRD
Germany
Industria de Turbo Propulsores, S.A.
ITP
Spain
Turbomeca
TM
France
Snecma
SN
France
Avio S.p.A.
AVIO
Italy
MTU Aero Engines GmbH
MTU
Germany
Siemens Industrial Turbines
SIE-UK
Volvo Aero Corporation INASMET Technische Universitaet Dresden Association pour la Recherche et le D´evelopement des M´ethodes et Processus Industriels CENTRALE RECHERCHE S.A. Institute of Physics of Materials Academy of Sciences of the Czech Republic Politecnico di Milano
VAC INASMET TUD
UK Sweden Spain Germany
ARMINES
France
CRSA
France
IPM PoliMi
Czech Republic Italy
Table I.1 : Partners of PREMECCY project and consortium
I.3
Scope and outline
The main objective of thesis is to develop consistent methodologies in order to predict crack initiation and crack growth in single crystals in the presence of strong stress and temperature gradients. In connection with the PREMECCY project, life-time prediction of the single crystal components of the turbine blades is a major task. In that context, damage mechanics is a well-suited theoretical framework for the development of crack initiation and growth models in single crystals. On the basis of crystal plasticity theory, finite element simulations of the thermomechanics of turbine blades provide detailed information about stress and plastic strain distribution, in particular near geometrical singularities like cooling holes and slits. An uncoupled damage mechanics model based on the history of FE calculations may provide numerically fast and robust methods to estimate life-time. Therefore, exploration of such approaches would be one of the key issues. An anisotropic damage model coupling crystal plasticity and cyclic damage has been developed in a previous project, that shows the interest of the approach, but also its current limits, in particular the strong mesh dependence of the results. Recent development of nonlocal models within the framework of the mechanics of generalized continua could help overcoming these difficulties. A large experimental basis exists
I.3. SCOPE AND OUTLINE
concerning initiation and crack growth in single crystal nickel base superalloys. The main motivation of introducing such a model would be to account for anisotropic crack growth and crack bifurcation in complex stress fields. Application to fatigue and to deal with the crack closure concepts are crucial in prediction of crack growth and therefore accepted as a primary requirement. Due to the complex numerical aspects, a deeper insight to the implementation procedure must be provided in order to achieve reasonable computation times which is one of the most important goals of this work. Chapter 2 introduces the single crystal nickel based superalloys. Microstructural properties are given and main deformation mechanisms are pointed out. This Chapter also intends to focus on discussing the fatigue behaviour of the single crystals. Chapter 3 provides the constitutive modeling history of single crystals and theromechanical representation of elastoviscoplastic single crystals is given and parameter identification procedure is explained. Chapter 4 aims at presenting a life-time assessment model for single crystals developed by ONERA. Thermomechanical formulation is provided and creep-fatigue cumulation concepts are studied. After discussing parameter identification process, predicted Goodman diagrams are demonstrated and discussed in detail. Finally, lifetime is predicted for notched specimens and notch effects are pointed out. Chapter 5 provides the development of a continuum damage mechanics based coupled crack initiation and propagation model. Mesh dependency problem is addressed and regularization techniques based on higher-order continua are studied. Microdamage continuum is selected as the most promising approach and further scrutinized. Crack closure effects are srudied and several solutions to the certain problems are given. Afterwards, numerical concepts and finite element implementation procedure are explained in detail. Providing the parameter identification process, the model is validated and calibrated for PWA1483 single crystal. A detailed discussion is provided at the end of the Chapter. Chapter 6, finally gives a brief summary of conclusion and discusses future directions.
7
R´ esum´ e
Le chapitre II est consacr´e ` a la description des superalliages monocristallins `a base nickel. Leurs propri´et´es microstructurales y sont pr´esent´ees ainsi que leurs principaux m´ecanismes de d´eformation. Ce chapitre consiste en l’analyse du comportement en fatigue des monocristaux en consid´erants les aspects d’orientation, de temp´erature, de vitesse de d´eformation et environnementaux, ainsi qu’en l’´etude de l’initiation et la propagation de fissures de fatigue.
Chapter -II-
Single Crystal Nickel Based Superalloys
Contents II.1
Microstructure . . . . . . . . . . . . . . . . . . . . . . . . . .
9
II.2
Heat Treatment . . . . . . . . . . . . . . . . . . . . . . . . . .
12
II.3
Deformation Mechanisms . . . . . . . . . . . . . . . . . . . .
15
II.4
II.1
II.3.1
Plastic Slip of Single Crystals . . . . . . . . . . . . . . . .
15
II.3.2
Schmid Law . . . . . . . . . . . . . . . . . . . . . . . . . .
19
Fatigue Behaviour . . . . . . . . . . . . . . . . . . . . . . . .
20
II.4.1
Orientation dependence
. . . . . . . . . . . . . . . . . . .
24
II.4.2
Temperature dependence . . . . . . . . . . . . . . . . . . .
24
II.4.3
Strain rate dependence . . . . . . . . . . . . . . . . . . . .
25
II.4.4
Environmental effects . . . . . . . . . . . . . . . . . . . . .
25
II.4.5
Creep-Fatigue effects . . . . . . . . . . . . . . . . . . . . .
25
II.4.6
Fatigue crack initiation . . . . . . . . . . . . . . . . . . . .
26
II.4.7
Fatigue crack propagation . . . . . . . . . . . . . . . . . .
26
Microstructure
In contrast to its complex composition, nickel based superalloys (NBS) are microstructurally simple compared to other alloys used in turbine industry such as titanium alloys. The general microstructure of NBS consists of two phases. A face-centered-cubic (fcc) nickel based matrix called γ-phase (with {111} slip systems) and γ 0 precipitates which is coherent with the solid solution matrix (See figure II.1). For both phases, having a predominante composition of Ni provides the
10
CHAPTER II. SINGLE CRYSTAL NICKEL BASED SUPERALLOYS
basis for improved mechanical properties at elevated temperatures, due to the high melting point of Ni.
(a) CMSX-4
(b) SRR99
(c) SC16
Figure II.1 : Microstructures of the superalloys. TEM images are obtained from super lattice reflections. The bright γ 0 -phase is surrounded by dark matrix, γ.
The solid-solution-strengthened γ-phase possesses good inherent ductility and is amenable to alloying without phase instability (Decker and Sims, 1972). Therefore, the γ-phase usually contains solid solution additions of elements like Al, Nb, Ti, Cr, Co, Fe, Re and W which make up approximately 30 to 40 % of the alloy by weight. The main purpose of these alloying additions is to provide solid solution strengthening by lowering the stacking fault energy of the γ-phase which makes cross slip in the matrix more difficult (King, 1987). In addition to strengthening effect, some alloying elements have more specific functions. For instance, Al, Cr and Co provide increased oxidation/hot corrosion resistance (Erickson, 1993). For further details see table II.1. Similar to other alloy systems, NBS gain their major properties from conjoining of precipitates Ni3 (Al, Ti) within the matrix. This phase is an ordered intermetallic with fcc (L12 ) structure having Al and Ti atoms at the corner positions and Ni atoms at the face centers. γ 0 -phase basically acts as an impenetrable obstacle for the dislocation motion occuring between the phases that confines the plastic deformation to the γ channels. Thus, γ 0 -phase is the principle strengthening phase in NBS. The volume fraction of the γ 0 -phase is the key feature in optimizing the properties of the superalloy. The early NBS were designed to contain less than 25 % volume of γ 0 precipitates. However, vacuum induction refining and single crystal casting γ0
II.1. MICROSTRUCTURE
Alloy
11
Ni
Cr
Co
Mo
W
Al
Ti
Ta
Re
Nb
V
Hf
Ru
62.5 62.6 66.6 66.5 60.6
10 9 8 8.5 8.0
5 8 4.6 5 6.0
– 2 0.6 2.0
4 6 7.9 9.5 6.0
5 3.7 5.6 5.5 5.2
1.5 4.2 0.9 2.2 1.2
12 4 5.8 2.8 9.0
– – – – –
– 0.5 – – –
– – – – –
– – – – –
– – – – –
59.4 61.8 61.8 70.4
5 7 6.5 10
10 8 9 5
2 2 0.6 3
6 5 6 –
5.6 6.2 5.6 4.8
– – 1 4.7
9 7 6.5 2
3 3 3 –
– – – –
– – – –
– 0.2 0.1 0.1
– – – –
69.6 57.4 59.9
2 4.2 3
3 12.5 12
0.4 1.4 2
5 6 6
5.7 5.75 6
0.2 – –
8 7.2 6
6 5.4 5
0.1 – –
– – –
0.03 0.15 0.1
– – –
66.9
3
6
3
6
6
–
6
5
–
–
0.1
2
59.2
4.6
6.1
2.4
5
5.6
–
5.6
6.4
–
–
0.1
5
First gen. PWA 1480 Ren´e N4 CMSX-2 SRR 99 AM1 Second gen. PWA 1484 Ren´e N5 CMSX-4 CMSX-6 Third gen. CMSX-10 Ren´e N6 TMS-75 Fourth gen. TMS-138 Fifth gen. TMS-169
Table II.1 : Composition of single crystal nickel based superalloys for different generations (Durand-Charre, 1997). Note that for 4th and 5th generation alloys addition of Mo increases the lattice misfit and Ru is used for microstructure stabilization (Zhou et al., 2004)
Effects
Alloying elements
Solid solution strengthening Formation of γ 0 (N i3 Al, N i3 T i) Raises solvus temperature of γ 0 Oxidation resistance Sulfidation resistance Retards γ 0 rafting Formation of topologically closed packed
Co, Cr, Mo, W, Ta, Re Al, Ti Co Al, Cr Cr, Co Re Co, Mo, W, Re, Cr
Table II.2 : Role of alloying elements in superalloys (Durand-Charre, 1997; Donachie and Donachie, 2002)
12
CHAPTER II. SINGLE CRYSTAL NICKEL BASED SUPERALLOYS
have given the opportunity to increase the volume fraction up to 70-80 %. Due to the absence of grain boundaries, single crytals generally do not contain grain boundary strengthening elements, like MC type carbides and there is no specific zone for the localized attack of oxidation and hot corrosion; therefore, the balancing of the alloying elements can be achieved in favor of increasing the volume fraction of γ 0 -phase which significantly improves the creep strength (Duhl, 1989). The maximum creep strength is usually reached between 70 and 80 % while a further increase leads to a significant drop in strength (Durand-Charre, 1997). For instance, the second generation single crystal CMSX-4 has about 68 vol.% γ 0 with a wide range of heat treatment window (Erickson, 1993). For an extensive review on the physical metallurgy and strengthening mechanisms of NBS, see (Decker, 1979). The lattice parameters of γ and γ 0 phases are generally comparable but not identical which causes a lattice misfit defined as: δ=
2(aγ 0 − aγ ) (aγ 0 + aγ )
(II.1)
where aγ 0 and aγ are the lattice parameters of γ 0 and γ phases respectively. The misfit is strongly effected by the alloying elements and its sign and magnitude strongly influence the γ 0 precipitate morphology. Depending on the composition of the alloy, heat treatment and temperature, lattice misfit could be positive, negative or zero (Nathal et al., 1985; Bruno et al., 2003). Hence, the lattice misfit is a direct indication of γ-γ 0 phase equilibrium. In most commercial NBS, the lattice misfit is approximately -0.2 to -0.3 % at high temperatures (Pollock et al., 2002). When lattice mismatch is low, γ 0 precipitates become spherical and when the lattice misfit is increasingly negative (< - 0.5%) they become cuboidal and eventually form flat plates known as ”Rafting“ phenomenon (Tien and Copley, 1971; Sims et al., 1987) (See Figure II.2 and II.3).
II.2
Heat Treatment
The typical Heat treatment of NBS consists of homogenization, solution heat treatments and aging process. Figure II.4 shows the Al-Ni phase diagram of NBS which will be referred during the consideration of heat treatment stages. For further detail on alloy specific heat treatment, see (Brooks, 1984; Chandler, 1996; Davis, 2001). The solution stage of the heat treatment aims at obtaining a microstructure of pure solid solution γ with an fcc structure shown in Figure II.5(a). The process takes for about 2-6 hours and it is performed at a temperature below the incipient melt point of the alloy. The γ 0 solvus separates the γ and γ + γ 0 regions in the phase diagram (see Figure II.4). This process is generally followed by a rapid cooling stage
II.2. HEAT TREATMENT
13
(a) Negative misfit
(b) Near zero misfit
(c) Positive misfit
Figure II.2 : TEM images of precipitate morphology of Ni-AL-Mo ternary alloy with a negative, near-zero and positive lattice misfits (F¨ahrmann et al., 1995)
Figure II.3 : Microstructural evolution of rafted CMSX-4 (Henderson et al., 1998)
(air, water or oil depending on the alloy) in order to prevent coarsening of the γ 0 precipitates. Upon cooling from the temperature of the solution Ni3 (Al,Ti) will be precipitated out below the γ 0 solvus whose crystal structure is demonstrated in Figure II.5(b). The aging occurs at a temperature below the solvus temperature, allowing homogeneous nucleation, growth and coarsening of γ 0 precipitates. The temperature
14
CHAPTER II. SINGLE CRYSTAL NICKEL BASED SUPERALLOYS
Figure II.4 : The Ni-Al binary phase diagram (Massalski, 1990)
(a) γ
(b) γ 0
Figure II.5 : FCC structures of γ and γ 0 phases.
effects the size distribution of the precipitates, while the time of the process strongly influence the magnitude of the precipitate size. Therefore, the temperature and the duration of the aging treatment are the selected parameters to optimize the morphology, alignment and the size distribution of the γ 0 precipitates. The aging process is also followed by an air or furnace cooling stage. Slow cooling rates are preferred to obtain a clean matrix, where as forced-air quenched cooling introduces a number of secondary γ 0 precipitates in the matrix channel (Kakehi, 2000). See Table II.2 for various phases present in single crystal NBS.
II.3. DEFORMATION MECHANISMS
15
Phase
Crystal structure
Formula
Effects
γ0
Face centered cubic Hexagonal closed packed Body centered tetragonal
Ni3 (Al,Ti)
Principal strengthening phase, volume fraction could be as high as 70 % Causes some amount of hardening
δ
Orthorhombic
Ni3 Nb
ν2
Rhombohedral
Co2 W6
ν γ 00
Ni3 Ti Ni3 Nb
Principal hardening phase in certain alloys, careful precipitation is needed to avoid formation of γ phase detrimental to properties when present in large amount TCP phase, detrimental to mechanical properties
Table II.3 : Role of alloying elements in superalloys (Durand-Charre, 1997; Donachie and Donachie, 2002)
Note that in the present work the detailed microstructure will not be taken into account for the sake of efficiency. Multiscale approaches of Nickel based superalloys have been undertaken in (Tinga, 2009).
II.3
Deformation Mechanisms
Slip, twinning and diffusion assisted plastic deformation are the three main mechanisms responsible for the inelastic deformation in metals. For the temperatures less than half of the materials absolute melting temperature, the deformation in crystalline metals primarily occurs through the propagation of dislocations. For higher temperatures, diffusion-controlled dislocation climbs become more important.
II.3.1
Plastic Slip of Single Crystals
During the glide of dislocations, one block of crystal slips along another block of crystal such that the crystal remains a crystal. Therefore, there are some preferred directions and glide planes in order to preserve the fcc structure of the crystal. The dislocation motions generally follow the shortest possible atomic distances so that the material stores minimum energy while deforming. This principle implies that the plastic slip occurs along a plane of high atomic density in closely packed directions called “slip planes” (Jaoul, 1965). A schematic description of slip planes with highest atomic density for different atomic structures is given in Figure II.6. Under continuous shear, dislocations could continuously move along the slip planes that the lattice on one side of the slip plane is displaced relative to the one on the other side of the slip plane. Eventually, one block of crystal structure slides over the other by
16
CHAPTER II. SINGLE CRYSTAL NICKEL BASED SUPERALLOYS
Figure II.6 : Packing density Dp in closest packed planes in the cubic lattices
dislocation propagation which results in a slip line that can be observed experimentally on polished surfaces of NBS single crystals (Hanriot et al., 1991; Stouffer and Dame, 1996). Figure II.7 illustrates a schematic of an edge dislocation and its propagation within the crystal lattice creating a slip line on the surface at the end. Figure II.8 shows the experimental observation of the slip lines on a polished surface of a single crystal under cyclic loading.
Figure II.7 : Schematic illustrating (a) the existence and (b) propagation of an edge dislocation within a crystal lattice subjected to shear stress (c) schematic showing slip line or step on material due to continued dislocation propagation (Stouffer and Dame, 1996)
Recalling the fcc structure of the NBS, the planes with the highest atomic density are the 4 octahedral planes shown as {111} in the notation of Miller indices. Every plane has 3 possible slip directions resulting in 12 deformation mechanisms as it is shown in Figure II.9. Octahedral systems are generally the only active deformation systems for low temperatures, however in a high temperature environment zig-zag cross slip mechanism that causes macroscopic cube slip has been described (Bettge and Osterle, 1999). Therefore, in addition to 4 octahedral planes, 3 cubic planes each having 2 slip direction gives 18 mechanisms to be considered in total.
II.3. DEFORMATION MECHANISMS
17
Figure II.8 : Slip lanes generated at the surface of a single crystal NBS component under fatigue (Hanriot et al., 1991)
(b) γ 0
(a) γ
Figure II.9 : (a) 12 octahedral (b) 6 cubic slip systems in a fcc crystal.
As it is previously demonstrated, the directions are the closest packed directions with a Burgers vector of a2 connecting one corner atom to the neighbouring central atom. Focusing more on the {111} planes, slip mechanism on the bases of Burgers vectors is explained in Figure II.10. The Burgers vector b1 = a2 [10¯1] defining the slip direction on the octahedral plane is shown to be regenerated through the vectors b2 and b3 . As it is presented in the figure, the formation of two step process, b2 and b3 is energetically more favorable than the slip of b1 which dissociates the dislocation of b1 into the following reaction (Honeycombe, 1984; Dieter, 1986). b1 → b2 + b3 a ¯ a a [101] → [2¯1¯1] + [11¯2] 2 6 6
18
CHAPTER II. SINGLE CRYSTAL NICKEL BASED SUPERALLOYS
As the slip b1 is replaced by a two step process, a stacking fault is generated in the stacking of the atoms and the dislocations produced from this dissociation are not perfect and do not produce complete lattice translations (See Figure II.11(a)). Furthermore, referring to the previous sections presenting the microstructure of NBS, it is worth to mention that the stacking fault energy is not same for all FCC metals/alloys and it has a direct influence on the deformation behaviour.
Figure II.10 : Slip mechanism in a closed packed (111) plane of an FCC lattice
(a) Stacking fault
(b) Schmid curve
Figure II.11 : (a) Screw dislocation dissociating in an fcc crystal. Partial dislocations are produced by the dissociation of a perfect dislocation (Asaro, 1983), (b) comparison of theoretical curve and the experimental data of the yield stress in tension of magnesium crystals as a function of orientation (Honeycombe, 1984)
Above mentioned slip mechanism depends on the activation of slip systems storing the minimum energy during the dislocation motion. However, any slip can be activated if there is enough stress applied through a proper direction. i.e. the activation of slips depend not only on the crystal structure but also on the orientation of the applied stress. Therefore, a general methodology is necessary to identify the activated slips under various orientations of the applied load. The work constructed
II.3. DEFORMATION MECHANISMS
19
by Schmid (Schmid and Boas, 1935) provides a solid understanding of slip activation identified from a principle generally referred as “Schmid law” or “Schmid rule” which also gives a strong base for the constitutive modeling of single crystals.
II.3.2
Schmid Law
In 1924, Schmid suggested that plastic yield would begin on a slip system when the resolved shear stress reached a critical value, independent of the orientation of the tensile axis and thus of other components of stress resolved on the lattice (Schmid, 1924). This clear statement of Schmid law was based on the data of zinc single crystals subjected to tension. Experiments on single crystals conducted in uniaxial tension and compression strongly confirm Schmid law (See Figure II.11(b)), however, observation of some deviations are likely, especially when the slip systems interact with each other causing the hardening of inactive slips. As a demonstration of Schmid law, a tensile test of a single crystal is studied in Figure II.12. The resolved shear stress τ α also known as “Schmid stress” acting on a system α is given by τ α = σ cos φα cos λα
with
σ=
F A
(II.2)
Figure II.12 : Schmid’s law and operative slip systems a) resolved shear stress in an uniaxial tension test, b) characteristic triangle of the stereographic projection demonstrating multislip activation.
where A is the crossectional area perpendicular to the applied load, F . Therefore, the interpretation of equation II.2 is nothing but the projection of the applied stress σ calculated from the force component in the slip direction S α , F cos λα divided by the area projected on the slip plane, A/ cos φα . As it is previously mentioned, plastic slip starts when the resolved shear stress reaches a certain critical value, so called slip resistance,τrα .
20
CHAPTER II. SINGLE CRYSTAL NICKEL BASED SUPERALLOYS
τ α = τrα
(II.3)
From the equations (II.2) and (II.3), one can conclude that slip will start on the slip system(s) with the highest Schmid factor(s) cos φα cos λα ≤ 0.5. First activated slip systems, according to the orientation of applied stress in a tensile test can be identified directly on a standard stereographic projection shown in Figure II.13(b). For an extensive review on the slip activity of single crystals see (Asaro, 1983). The generalized tensorial description of Schmid law will be presented in the next chapter which is focused on constitutive modeling.
B4
D4 A6
C5
A2
C1
D1
B2
D6
D4
B4
B5
C5
C3
A3
A6
[010]
B2
D1
B5
D6
C1
A2
C3
A3
[100]
(a) 12 octahedral systems
(b) Stereographic projection
Figure II.13 : (a) Slip planes and slip directions defining 4x3=12 systems (b) standard stereographic projection showing the respective slip systems activated in a tension test.
II.4
Fatigue Behaviour
Over the last two decades, numerous fatigue studies have been conducted on various types of single crystal NBS. Fatigue issues related to single crystal NBS generally based on the turbine blades subjected to complex mechanical and thermal loading during the flight cycle, which consists of three general stages, namely: take off, cruise and landing. The thermomechanical environment during these three stages generally determines the general framework of the research conducted on the fatigue behaviour of these materials. The life of a structural component under fatigue is determined by the time required for the initially existing microcracks or other flaws to grow from subcritical dimensions to the critical flaw size. Under a given loading condition the critical flaw size may lead to the failure of the structure and it is determined from the plane strain fracture toughness, KIC of the material (Suresh, 1998). For the characterisation of fatigue crack growth, the fatigue growth rate, da/dN , is related to the stress intensity range
II.4. FATIGUE BEHAVIOUR
Slip system families
21
system s
slip plane n s
1 2
(111)
[011] [110]
4
[101] (111)
[011]
6
[110]
7
[011]
8
(111)
[110]
9
[101]
10
[110]
11
(111)
[101]
12
[011]
13
[110]
14 cube
[101]
3 5 octahedral
slip plane normal l s
(001)
15 16
[011] (100)
17 18
[110] [011] [101]
(010)
[101]
Table II.4 : List of slip systems exist in an FCC crystal.
22
CHAPTER II. SINGLE CRYSTAL NICKEL BASED SUPERALLOYS
∆K, where a is the crack length and N is the number of fatigue cycles. This relation takes its mathematical form in the so-called Paris law : da/dN = C(∆K)m
(II.4)
where C and m are material constants and ∆K is the difference between the maximum and minimum stress intensity factors. However, the experimental crack growth data of metals and alloys does not fully satisfy this power law. When da/dN versus ∆K data is plotted on a log scale, instead of a straight line, a curve with varying slope is obtained. Moreover, it is also well-known that fatigue crack growth rate depends on mean stress, i.e. R ratio and it is directly influenced by crack closure phenomenon that reduces the effective stress intensity factor (∆Kef f = Kmax − Kcl ) and therefore the crack driving force. The detailed discussion on crack closure phenomenon will be done in the following chapters. Figure II.14 demonstrates typical crack growth data of a single crystal NBS. In the figure, the life time of the component is divided into three regions. In region I, the cracking starts but the crack growth rate is very slow and approaches zero for a defined stress intensity factor. This value is accepted as a characteristic property of the material known as the fatigue threshold, ∆Kth and it is an extremely important design parameter separating the infinite and finite life-times for a structural component under fatigue. Microstructural parameters like volume fraction of phases, size of the γ 0 precipitation sizes, lattice misfit etc. have a significant influence on the fatigue crack growth rate and fatigue threshold (Hertzberg, 1989). Region II is the linear region where the material generally obeys the Paris law. In region III the crack growth rate starts to deviate from Paris line since Kmax approaches KIC resulting in faster and unstable crack growth. Like the crack growth rate plot, the general fatigue process can be analyzed in different stages. In stage I, intense localized shear deformation occurs in slip bands near the crack-tip and this leads to the creation of new crack surfaces (Dieter, 1986) in the plane of maximum shear stress. In crystalline solids, dislocation motions gives a discontinuous displacement field across a slip plane and this discontinuous displacement is the primary cause of fatigue nucleation and propagation (Liu et al., 1993) and it is generally driven by stresses in mode II (see Figure II.15 for different modes). In stage II, the crack evolves from stage I and it is driven by stresses activating mode I and continues to grow until ductile failure occurs. In the case of a crystallographic material stage I crack refers to crack propagation along crystallographic planes with the presence of both tensile and shear components at the crack tip while stage II cracking refers to crack propagation along non-crystallographic highly-stressed plane with only tensile component present at the crack tip. In crystallographic solids long cracks generally fit in the linear regime of the crack growth rate plots and can be characterized by Paris equation, however, structural
II.4. FATIGUE BEHAVIOUR
Figure II.14 : A typical crack growth data of a metal (Suresh, 1998). Note that for √ single crystals ∆Kth value is around 10 MPa m.
Figure II.15 : Three different fracture modes.
components ofen contain or generate short cracks which do not obey the Paris law (Suresh and Ritchie, 1984). Short cracks are identified as having a size comparable to the size of the plastic zone. For the equivalent stress intensity factors, short cracks usually grows at a much faster rate (See Fig. II.16). In the same sense, small cracks can propagate well below the threshold stress intensity factor ∆Kth due to the lower level of crack closure and higher ∆Kef f resulting in less residual deformation. As previously mentioned the plastic zone ahead of the crack tip is of the same size as the crack; therefore, linear elastic fracture mechanics approach is not applicable and alternative approaches such as J-integral or continuum damage mechanics are necessary.
23
24
CHAPTER II. SINGLE CRYSTAL NICKEL BASED SUPERALLOYS
Figure II.16 : Fatigue crack growth rate plot of short thermomechanical cracks
II.4.1
Orientation dependence
Orientation plays a strong role in the dependence of fatigue life on mechanical strain; however, orientation dependence is not as clearly apparent when relating fatigue life to the stress amplitude (Chieragatti and Remy, 1991; Fleury and Remy, 1994). The greatest deviation in life usually occurs at lower mechanical strain ranges. Studies have shown that orientation dependence is primarily due to the variations in Young’s modulus with orientation. For instance, If the loading axis is in an orientation of lower modulus, the observed life time will be improved accordingly. This argument is verified by the observation that orientation dependence is less apparent when fatigue life data is plotted in terms of cyclic plastic strain range. Several other studies have been also conducted on the orientation dependence (Leverant et al., 1987; Aswath, 1994; Crone et al., 2004).
II.4.2
Temperature dependence
Fatigue cracks have been found to propagate predominantly along {111} planes at low and intermediate temperatures with considerable crack branching and deflections, while at elevated temperatures, cracks were found to propagate along {100} planes so that they can be considered as stage II type (Leverant et al., 1987; Marchal, 2006). In these studies, the general explanation addressed for the temperature dependence is at room temperature, cracks propagate along coplanar cross-slip planes with out-
II.4. FATIGUE BEHAVIOUR
of-plane noncoplanar secondary slip; however at elevated temperatures, due to the increase in available slip systems, non crystallographic cracking occurs results from both operative cube and octahedral slip systems.
II.4.3
Strain rate dependence
Under low cycle fatigue conditions with peak stress exceeding the yield strength, the cyclic stress range determines the plastic strain range. As the strain rate is decreased, the peak yield strength decreases, longer lives can be observed with increasing cycling frequency. Leverant and Gell studied the influence of frequency for Mar-M-200 and they found an optimum frequency resulting in maximum fatigue life (Leverant and Gell, 1975). Another important factor is the influence of oxidation rate changing with strain rate. At intermediate temperatures, specimens cycled at low strain rates had shorter lives than those cycled at high strain rates. This trend is generally explained with the environmental effect such that increased life under increased strain rate is attributed to a decreased in both environmentally induced damage and creep damage (Sehitoglu and Boismier, 1990).
II.4.4
Environmental effects
Most of the studies are conducted in the laboratory air; however, studies have shown that the outcomes of fatigue tests conducted in vacuum significantly differs from the ones conducted in air. Tests in vacuum (pressurized to 10−4 N.m−2 ) result in a much higher crack initiation life than air for low test frequencies. The difference results from oxidation penetrating to the crack tip (Wright, 1988). Observations performed on the surfaces of the failed samples show great morphological differences indicating that environmentally controlled diffusion kinetics are involved in the local damage process (Duquette and Gell, 1972; Reger and Remy, 1988). As previously mentioned oxidation is temperature and strain rate dependent; while high temperature increases the oxidation effects, slower frequency cycling and tensile conditions that allow cracking of brittle surface grown oxides accelerate the crack initiation process (Wright, 1988; Reger and Remy, 1988). For an extensive study on environmental effects observed on superalloys, see (Li, 1997).
II.4.5
Creep-Fatigue effects
It is very well known that superimposed dwell periods in fatigue cycling shortens the crack initiation lives of single crystal NBS (Reger and Remy, 1988; Koster and R´emy, 2000). The total strain life curve in CMSX-4 at 950o C shifts towards shorter lives when tensile dwell periods are increased (Koster and R´emy, 2000). Creep-fatigue interaction promotes the stress concentration originates from pores, inclusions and coarsening of precipitate particles and therefore, shortens the fatigue life. Dwell periods in compression also known to increase the environmentally induced damage. Moreover in the work of Lucas it has been shown that for ultra-high cycle fatigue
25
26
CHAPTER II. SINGLE CRYSTAL NICKEL BASED SUPERALLOYS
at high temperatures and for small amplitudes, time to fracture is tend to increase with the increasing stress amplitude to up to some extend which is explained in connection with the improved creep properties (Lucas et al., 2005), i.e. it is argued that high frequency vibrations with small amplitudes have positive effect on the creep behaviour.
II.4.6
Fatigue crack initiation
Together with the thermomechanical conditions in the operating environment, defects existing in the material are the main sources of fatigue crack initiation in single crystal NBS. Addressing the microstructure of these materials, majority of the intrinsic material defects such as carbides and associated microporosity are found between the dendrite arms perpendicular to the direction of solidification. These discontinuities parallel to the dendrites serve as crack initiation sites in the microstructure of the alloy due to their ability to inhibit long range dislocation motion (DeLuca and Annis, 1995). Microporosity exists in the interdentric region is considered as the most frequently observed fatigue crack initiator of both LCF and HCF behaviour of single crystal NBS and can be avoided by employing special casting procedures like hot isostatic pressing (DeLuca and Annis, 1995). Oxidation can also be considered to be a source of crack initiation. For instance Wright showed that the surface crack initiation in R´ene N4 is caused by fatigueassisted cracking and spalling of oxide products which produce roughened and pitted surfaces. With further cycling, these pits develop into oxides and then into sharp fatigue cracks at the surfaces (Wright, 1988). Fortunately, today’s coating technology is able to deal with that sort of initiation by isolating the material surface from the environment. Apart from the above definitions, crack initiation can also be classified as crystallographic and non-crystallographic. In that context, in air and at room temperature and low stress the majority of crack initiation results from carbide occurring along the {111} planes and they are classified as crystallographic (Arakere and Swanson, 2001). At moderately high temperatures (>593o C) initiations have been observed to occur at carbides making them non-crystallographic (DeLuca and Annis, 1995) (See Figure II.17).
II.4.7
Fatigue crack propagation
Like crack initiation, crack propagation also depends on microstructure, environmental conditions, crystal orientation, temperature and stress state. However, regardless of these effects, the majority of single crystal NBS experience crack propagation on the planes coinciding with the {111} planes as well as a phase where the crack propagates along a plane normal to the applied loading which
II.4. FATIGUE BEHAVIOUR
Figure II.17 : Crack initiation at the surface of CMSX-4 specimen after fatigue at T=1050o C ∆�t = 0.9%. a) Singular cracks at a surface casting porosity, b) crack formation at the surface through linking-up of short cracks and c) (010) section showing a small crack propagation from an oxidized surface pore (Mughrabi and Ott, 1999)
might be macroscopically considered as cube planes (Antolovich, 1996), Moreover, the relation between fatigue crack growth and the dislocation emission from the crack tip has been shown in several experiments showing that fracture or free surface development is aided by dislocation exhaustion on crystallographic planes in the critical zone (DeLuca and Annis, 1995; Antolovich, 1996), Consequently, if sufficient lattice plane dislocations accumulate or pile up, cohesive forces are weakened and fracture undertakes the character of the deformation mechanism. Therefore, in the context of constitutive modeling, the identification of active slip systems is vital for a comprehensive study of crack growth in single crystal NBS. Slip character occurring at the crack tip strongly effects the fatigue crack growth regime. Slipping on the complementary planes may widen the crack resulting in blunting. Upon unloading the slip direction in the end zone is reversed and the crack faces are crushed together to form a resharpened crack tip. Theoretically, whole slip process could be reversed; however, especially due to the oxidation, the process becomes irreversible and enhances the crack growth rate. In that context, roughness and oxide induced closure concepts are also to be taken into consideration. Plasticity induced closure and its influence on crack growth will be discussed in detail in Chapter 5. At high temperatures, creep has also considerable influence on fatigue crack growth. The fatigue lives shown to reduced for specimens with γ − γ 0 rafts perpendicular to the stress axis and extended for specimens with γ − γ 0 rafts parallel to the stress axis.(Mughrabi and Ott, 1999). Therefore, γ −γ 0 morphology and volume fraction plays a very important role on rafting and so crack propagation (see Figure II.18).
27
28
CHAPTER II. SINGLE CRYSTAL NICKEL BASED SUPERALLOYS
Figure II.18 : Fatigue crack propagation in CMSX-4 specimen after fatigue at T=1050o C ∆�t = 0.9%. SEM micrographs dependence on the γ − γ 0 morphology (010) section parallel to [001]. (a-b) A specimen with cuboidal γ 0 particles (a-b) (c-d) a specimen with γ − γ 0 rafts perpendicular to the stress axis, (e-f) a specimen with γ − γ 0 rafts parallel to the stress axis (Mughrabi and Ott, 1999).
30
CHAPTER II. SINGLE CRYSTAL NICKEL BASED SUPERALLOYS
R´ esum´ e Le chapitre III fournit un historique des mod´eles constitutifs existants dans le cas des monocristaux, ainsi que de la repr´esentation thermom´ecanique des monocristaux ´elastoviscoplastiques. Par ailleurs, la proc´edure d’identification des param´etres du mod`ele est expliqu´ee en d´etail.
Chapter -III-
Constitutive Modeling of Single Crystals
Contents III.1
Introduction . . . . . . . . . . . . . . . . . . . . . . . . . . . .
31
III.2
Constitutive modeling history . . . . . . . . . . . . . . . . .
32
III.3
Thermomechanics of elastoviscoplastic single crystals . . .
33
III.4
III.1
III.3.1
Coleman’s exploitation method . . . . . . . . . . . . . . .
34
III.3.2
Presentation of a crystallographic model . . . . . . . . . .
35
Parameter Identification . . . . . . . . . . . . . . . . . . . . .
38
Introduction
Even though the microstructural properties, have a significant influence on the mechanical behaviour, the models used for design are not necessarily and strictly based on microstructural aspects (Cailletaud et al., 2003). Pure macroscopic approaches are widely used in current practice considering viscoplastic constitutive equations which account for isotropic and kinematic hardening in order to correctly represent the cyclic behaviour (see Figure III.1). Due to their capability of representing rate dependent plastic deformation coupled with non-linear hardening regimes, macroscopic approaches became a standard base for the models estimating lifetime. In Chapter 2, it is clearly stated that single crystal NBS have face centered cubic crystallographic structure and their deformation behaviour is highly anisotropic. The elastic behaviour is cubic and the plastic deformation is due to the plastic slip on 12 octahedral {111} and 6 cube {100} slip systems. Therefore, a representative model, to be used to perform structural calculations, should take into
32
CHAPTER III. CONSTITUTIVE MODELING OF SINGLE CRYSTALS
account the crystal lattice type, orientation in space and number of activated slip systems and their interactions under complex thermodynamical loadings based on Schmid law. Moreover, computation time for industrial applications must be relatively low and the number of material parameters must be convenient and easy to calibrate. In that context, viscoplastic models for cubic single crystals based on Hill’s criterion can be used for one-dimensional cyclic loading; however, this type of model does not fully consider Schmid law. Thus, the model is unable to capture observations made on tubular specimens under torsional loading, which present inhomogeneous deformation along the circumference (Nouailhas and Cailletaud, 1995). Taking Schmid law into account, several crystallographic models exist in the literature to describe the anisotropic behaviour of single crystal nickel-base superalloys, for a wide range of temperatures. Basically, there are three categories: phenomenological models based on theory of invariants (Nouailhas and Culi´e, 1991; Li and Smith, 1998), crystallographic phenomenological models (M´eric et al., 1991; Cailletaud, 1987) and crystallographic micromechanical models (Fedelich, 2002; Busso et al., 2000). In this work, Cailletaud’s crystallographic model (Cailletaud, 1987) is taken as a base for the modeling due to its consistency with experimental results obtained for various crystal orientations and the parameter sets calibrated for AM1 and CMSX-4 by Hanriot (Hanriot et al., 1991) and Koster (Koster et al., 2002) are used.
Figure III.1 : Length scales for constitutive modeling
III.2
Constitutive modeling history
After the significant work of Schmid, mathematical representation of the plastic deformation in metals, especially in single crystals was pioneered by Taylor (Taylor, 1934). More rigorous and rational formulations for the description of plastically deforming crystals have been developed by Hill (Hill, 1966; Hill and Rice, 1972). The
III.3. THERMOMECHANICS OF ELASTOVISCOPLASTIC SINGLE CRYSTALS
33
formulation is also recast into the mathematical framework of multisurface plasticity (Mandel, 1972; Maier, 1970). The finite strain formulation is provided in (Teodosiu, 1970; Rice, 1971; Mandel, 1972). A comprehensive review of this subject can be found in (Asaro, 1983; Havner, 1992; Bassani, 1993; Khan, 1995). For more recent accounts showing the success of this continuum approach based on multiplicative decomposition and the use of scalar dislocation densities % see (Maugin, 1992; Teodosiu, 1997; Gumbsch and Pippan, 2005; Bertram, 2005). In that context, the numerical implementation of rate-dependent single crystal plasticity is documented in (Needleman et al., 1985; Rashid and Nemat-Nasser, 1992; Cailletaud and Chaboche, 1996; Steinmann and Stein, 1996) and for more recent research for rate independent case, see (Borja and Wren, 1993; Cuiti˜ no and Ortiz, 1993; Anand and Kothari, 1996; Miehe, 1996).
III.3
Thermomechanics of elastoviscoplastic single crystals
In connection with the following chapters and for the sake of simplicity, the thermomechanical framework of single crystals will be presented in small strain space in this section. Starting from the energy balance, the equations of continuum thermomechanics can be written in local form as: • energy balance ˙ + ρr − div q ρe˙ = σ :ε ∼ ∼
(III.1)
˙ is the strain rate tensor, r where e˙ is the energy rate, σ is the Cauchy stress, ε ∼ ∼ is the heat supply and q denotes the heat flux. • entropy principle ρη˙ + div
�q � T
−
ρr ≥0 T
(III.2)
q .grad T ≥ 0 T
(III.3)
where η is the specific entropy function • Clausius-Duhem inequality ˙− − ρ(e˙ − T η) ˙ +σ :ε ∼ ∼
Defining the Helmholtz free energy as the Legende transformation of the internal energy e by Ψ = e − Tη (III.4) inequality III.3 becomes ˙ − η T˙ ) + σ : ε˙ − − ρ(Ψ ∼ ∼
q .grad T ≥ 0 T
(III.5)
34
CHAPTER III. CONSTITUTIVE MODELING OF SINGLE CRYSTALS
• local and conductive dissipation
III.3.1
˙ + η T˙ ) + σ : ε˙ ≥ 0 ρDloc = −ρ(Ψ ∼ ∼
(III.6)
q ρDcond = − .grad T ≥ 0 T
(III.7)
Coleman’s exploitation method
The thermodynamic restrictions expressed in equations III.6 and III.7 can be exploited for thermoelastoplastic solids in order to give a reduced form of constitutive equations by the so-called Coleman’s method. A typical dependence of the free energy function, ˆ on the internal variables are assumed: Ψ, ˆ Ψ = Ψ(x, T, ε , εp , α, g) ∼
(III.8)
σ =σ ˆ (x, T, ε , εp , α, g) ∼ ∼
(III.9)
ˆ (x, T, ε, εp , α, g) β=β ∼
(III.10)
η = ηˆ(x, T, ε , εp , α, g) ∼
(III.11)
ˆ X = X(x, T, ε , εp , α, g) ∼
(III.12)
q = qˆ(x, T, ε , εp , α, g) ∼
(III.13)
∼
∼
where g is the temperature gradient, grad T , and β and X are the ∼ p and internal variable, thermodynamical forces associated with the plastic strain, ε ∼ ˙ = ∂ε Ψ ˆ ε˙ + ∂εp Ψ ˆ ε˙p + ∂T Ψ ˆ T˙ + ∂α Ψ ˆ α˙ + ∂g Ψ ˆ g˙ into III.6, α, respectively. By inserting Ψ Clasius-Plank inequality III.6 can be exploited as:
i h i h i h ˆ : ε˙ −ρ∂εp Ψ ˆ : ε˙p −ρ η + ∂T Ψ ˆ T˙ − ∂g Ψ ˆ g˙ −ρ∂α Ψ ˆ α˙ ≥ 0 (III.14) ρDloc = σ − ρ∂ Ψ ε ∼ ∼ ∼ ˙ , T˙ , g. The inequality III.14 should be satisfied for arbitrary rates, ε ˙ This is the case ∼ if the terms in brackets vanish, which gives the basic definition of thermoelasticity as non dissipative response (ρDloc = 0). Therefore, Coleman’s method implies a particular form of the constitutive equations due to:
h
i h i h i ˆ = σ − c : (ε − εp ) = 0; ρ η + ∂T Ψ ˆ = 0; ∂g Ψ ˆ =0 σ − ρ∂ Ψ ε ∼ ∼ ∼ ∼ ∼
(III.15)
∼
p ) denotes the elastic strain tensor in accordance with the free energy where (ε −ε ∼ ∼ function proposed in the next subsection. Finally, the local dissipation inequality takes the form:
p β:ε − X α˙ ≥ 0 ∼ ∼
(III.16)
III.3. THERMOMECHANICS OF ELASTOVISCOPLASTIC SINGLE CRYSTALS
Equation III.14 and III.15 give the following reduced form of the constitutive equations of thermoelasticity: ˆ σ = ρ∂ε Ψ(x, T, ε , εp , α) ∼ ∼
(III.17)
ˆ β = −ρ∂εp Ψ(x, T, ε , εp , α) ∼
(III.18)
ˆ η = −∂T Ψ(x, T, ε , εp , α) ∼
(III.19)
ˆ T, ε , εp , α) X = ρ∂α Ψ(x, ∼
(III.20)
ˆ with Ψ = Ψ(x, T, ε , εp , α); q = qˆ(x, T, ε, εp , α, g) ∼
(III.21)
∼
Note that the free energy serves as a potential for the stresses σ and β , the entropy ∼ ∼ η and the internal variable α and it is not a function of temperature gradient, g.
III.3.2
Presentation of a crystallographic model
Now a template model for single crystal behaviour can be introduced with specific internal variables: dislocation density %s , internal structure αs . The free energy function takes the form: N N N X 1 e 1 X rs r s 1 X s2 e s s e s ψ(ε , % , α ) = ε : c : ε + r % + q h % % + α 0 ∼ ∼ ∼ 2∼ ∼ 2 2 s=1
r,s=1
(III.22)
s=1
where r0 and q are the material constants and s stands for slip system. The state laws are derived as:
σ = ρ ∼
∂ψ e =∼ c:ε ∼ e ∼ ∂ε ∼
rs = ρ
X ∂ψ = r0 + q hsr %s s ∂%
N
r=1
xs = ρ
∂ψ = cαs ∂αs
where rs is the yield limit and xs is the back stress for each system s. Note that the linear strain tensor ε = sym[∇u] is by definition the symmetric part of the ∼ displacement and we consider its additive decomposition: e p ε =ε +ε ∼ ∼ ∼
(III.23)
e , εp , respectively. The latter one remains after stress into elastic and plastic parts ε ∼ ∼ relaxation. The elastic response of the crystalline solid is governed by the lattice deformation and by local inhomogeneous deformation fields due to dislocations and
35
36
CHAPTER III. CONSTITUTIVE MODELING OF SINGLE CRYSTALS
point defects. As it has been mentioned previously the material has an fcc structure results in a cubic elastic behaviour. Therefore, the fourth order elasticity moduli ∼ c is ∼ composed of 3 constants C11 , C12 and C44 as shown below. c= ∼ ∼
C11 C12 C12
0
0
C12 C11 C12
0
0
C12 C12 C11
0
0
0
0
0
C44
0
0
0
0
0
C44
0
0
0
0
0
0
0 0 0 0 C44
(III.24)
Schmid law is represented here as a multimechanism crystal plasticity yield criterion: f s = |τ s − xs | − rs
(III.25)
The driving force for plastic slip is the resolved shear stress,τ s , defined on the slip system s: sym
τs = σ : (m s ⊗ n s ) = σ : (m s ⊗ n s ) = (σ .n s ).m s ∼ ∼ ∼
(III.26)
where n s is the normal to the plane of slip system s and m s stands for the corresponding slip direction (see Figure III.2).
Figure III.2 : Octahedral slip systems defined by slip planes, corresponding normals, n s and slip directions, m s
The dissipation potential is taken as: N
Ω(σ , rs , xs ) = ∼
K X f s n+1 h i n+1 K
(III.27)
s=1
Flow and hardening rules are derived from the dissipation potential by using
III.3. THERMOMECHANICS OF ELASTOVISCOPLASTIC SINGLE CRYSTALS
normality. Then plastic strain rate reads: N
∂Ω X s s sym s ε ˙ = = γ˙ m ⊗ n ∼ ∂σ ∼ p
(III.28)
s=1
The flow rule on slip system s is a classical Norton rule with threshold. s
�
γ˙ =
|τ s − xs | − rs K
�n
sign(τ s − xs )
(III.29)
where rs and xs are the variables for isotropic and kinematic hardening respectively and K and n are material parameters to be identified. Evolution of other strain-like internal variables are also derived from dissipation potential by normality:
with v˙ s = h
∂Ω = v˙ s , ∂rs ∂Ω = − s = γ˙ s ∂x
%˙ s = −
(III.30)
α˙ s
(III.31)
fs n i , K
γ˙ s = v˙ s sign(τ s − rs )
(III.32)
Hardening rules are generally chosen nonlinear for a better representation of the material. In this work following nonlinear isotropic hardening is chosen: %s = 1 − exp(−bv s ) X rs = r0 + q hsr (1 − exp(−bv s ))
(III.33) (III.34)
r=1
where r0 is the initial yield stress, b isa material parameter and hsr is the interaction matrix describing the self and latent hardening which is caused by the interactions between the different slip systems (see Figure III.3). For single crystal NBS, general practice suggests to take interaction matrix as identity (see (M´eric et al., 1991) for details). In order to express a realistic cyclic behaviour, a nonlinear kinematic hardening is chosen: α˙ s = γ˙ s − dv˙ s αs
(III.35)
s �m sign(αs ), where d is a material parameter. Note that a static recovery term, − αM can be added to the equation if necessary, where M and n are material constants. Above equation can also be analytically integrated for monotonic loading as:
37
38
CHAPTER III. CONSTITUTIVE MODELING OF SINGLE CRYSTALS
xs =
c (±1 − exp(−dv s )) d
(III.36)
Figure III.3 : Interaction matrix is a symmetric matrix composed of six coefficients which describe the interactions between the different slip systems. The coefficient h1 describes the self hardening of the given slip systems. The coefficient h2 describes the hardening caused by the interaction with slip systems in the same slip plane. The coefficients h3, h4, h5 and h6 describe the interaction with the other slip directions in different slip planes. Taylor hardening can be obtained by simply setting hi = 1
III.4
Parameter Identification
Recalling single crystals anisotropic nature, several multiaxial tests have to be performed in order to identify the model parameters for each temperature. For the three elastic constants, three experiments are needed. Two monotonic tension tests performed in two different orientations are necessary to identify C11 and C44 and one torsion test is enough for the identification of constant, C12 . In order to calibrate the viscosity parameters K and n, basically the data from monotonic tension tests performed for different strain rates is used (See Figure III.5(a)). The parameters can be further polished by assessing available creep test data if the temperature is high or cross checking the data of cyclic tests performed under different loading frequencies. Constants of static recovery, M and m are calibrated directly from the creep tests (See Figure III.5(d)). For the calibration of isotropic hardening parameters, r0 , q, b, monotonic tension tests performed for several crystal orientations (preferably and ) are used (See Figure III.5 (b,c)). In order to identify the isotropic hardening parameters of cubic slip system family, tensile test performed for the direction is enough. The monotonic torsion tests of oriented tubular specimen can be used for validation of the cubic parameters since only cubic slip systems are activated along the periphery of the specimen and
III.4. PARAMETER IDENTIFICATION
39
that type of activations are observable only if local measurements are performed (Nouailhas and Cailletaud, 1995). Finally, kinematic hardening parameters, c and d are calibrated from the cyclic tests data taken from specimens with different crystallographic orientations which are generally are oriented (See Figure III.5(e)). Cyclic tension-torsion tests are suitable for the validation of kinematic hardening parameters of cubic systems. Parameter sets for single crystals CMSX-4 and PWA1483 at 950o C are provided in Appendix -C-.
1200 1000
σ(MPa)
800 600 400 200 0
10-1 s-1 -2 10-3s-1 10 s-1 0
0.005
0.01
0.015 0.02 ε(%)
0.025
0.03
0.035
Figure III.4 : Monotonic tension tests for different strain rates for CMSX-4 at 950o C
40
CHAPTER III. CONSTITUTIVE MODELING OF SINGLE CRYSTALS
1200
exp sim
1000
1000
800
800 σ(MPa)
σ(MPa)
1200
600
600
400
400
200
200
0
0
0.005
0.01
0.015
0.02
0.025
0.03
0
0.035
exp sim
0
0.005
0.01
0.015
ε(%)
0.02
0.025
0.03
0.035
ε(%)
(a) Tension test for orientation
(b) Tension test for orientation
1000 800
exp sim
600
σ(MPa)
400 200 0 -200 -400 -600 -800 -1000 -0.015
(c) Creep test at 950o C
-0.01
-0.005
0 ε(%)
0.005
0.01
0.015
(d) Cyclic test at 950o C
Figure III.5 : Standard test data and parameter identification for CMSX-4 at 950o C
42
CHAPTER III. CONSTITUTIVE MODELING OF SINGLE CRYSTALS
R´ esum´ e Le chapitre IV vise ` a pr´esenter un mod`ele de pr´ediction de dur´ee de vie d´evelopp´e par l’Office National d’Etudes et de Recherches A´erospatiales (ONERA) pour les monocristaux. La formulation thermom´ecanique est fournie et les concepts d’interaction entre fatigue et fluage sont ´etudi´es. Apr`es avoir discuter la proc´edure d’identification des param`etres, les diagrammes de Goodman pr´edits sont d´emontr´es et discut´es en d´etails. Enfin, la dur´ee de vie d’´echantillons entaill´es est estim´ee et des effets d’entaille sont mis en ´evidence.
Chapter -IV-
Life-time Assessment Modeling of Single Crystals
Contents IV.1
Introduction . . . . . . . . . . . . . . . . . . . . . . . . . . . .
43
IV.2
General formulation of the multiaxial creep-fatigue model
45
IV.3
Thermomechanical formulation
. . . . . . . . . . . . . . . .
46
IV.4
Creep-fatigue damage cumulation for complex loadings . .
48
IV.5
Parameter identification . . . . . . . . . . . . . . . . . . . . .
50
IV.6
Validation based on CCF tests . . . . . . . . . . . . . . . . .
51
IV.7
Post-processing . . . . . . . . . . . . . . . . . . . . . . . . . .
53
IV.8
Goodman diagram predictions . . . . . . . . . . . . . . . . .
55
IV.9
Application to real-life components . . . . . . . . . . . . . .
61
IV.1
IV.9.1
Notched geometry . . . . . . . . . . . . . . . . . . . . . . .
61
IV.9.2
Advanced specimens . . . . . . . . . . . . . . . . . . . . .
68
Introduction
During their service life single Crystal components are generally subjected to complex thermomechanical loading conditions. Lifetime prediction of these components under complex loading and severe environmental conditions is an important and challenging task of the component design process. A solid understanding of the phenomena leading to component failure like creep and fatigue is necessary in order to achieve a proper quantitative analysis. Here, lifetime refers to the time (or number of cycles) required for a virgin material to exhibit a macroscopic crack initiation. For single crystals, cracks of approximately 1 mm long are basically considered as initiated
44
CHAPTER IV. LIFE-TIME ASSESSMENT MODELING OF SINGLE CRYSTALS
macroscopic cracks giving rise to a possible application of Fracture Mechanics or alternative concepts. Computational modeling aspects of fatigue life predictions may follow different paths depending on the assumptions and design purposes. Regarding single crystal components, designers are mostly interested in crack initiation and crack initiation life is basically considered as the component service life. In that context, single crystal industry is more interested in strain based approaches which provide more promising results in quantifying initiation life compared to Fracture Mechanics based approaches. History analysis of Finite element calculations is performed at the component level in order to identify the fatigue critical zones and predict the crack initiation time. Fatigue damage initiated in an individual loading cycle is generally determined from multiaxial damage laws which take the material response calculated from a proper cyclic loading plasticity model, as an input. Models describing the material response are often written in a rate form and in the thermodynamics framework (Lemaitre and Chaboche, 1994). On the other hand, the fatigue response of the material is usually expressed by Woehler curves which are mostly addressed in practical engineering approaches (Manson and Hirschberg, 1964) (See Figure IV.1). Basic fatigue laws often mimic the straight line in the log-log diagram of maximum applied stress, σmax vs. the number of cycles to failure, Nf which is generally parametrized for R ratio or the mean stress. Effects of mean stress on the fatigue life is often reproduced by introducing amplitude laws based on R ratio (Lemaitre and Plumtree, 1979; Chaboche and Lesne, 1988). Application of above mentioned models to real life components is not an easy task. Modeling aspects have to be extended to 3D which brings certain complexity to the stress amplitude, stress ratio and cycle definitions, especially when irregular cyclic loadings or temperature changes are encountered during fatigue loading. Therefore, in this framework, first goal to be achieved would be presenting a clear link between stress and strain described within the scope of non-linear material behaviour in 3D. For that purpose one can address models based on Continuum Damage Mechanics (Lemaitre and Chaboche, 1994; Paas, 1990; Lemaitre, 1992; Lemaitre and Desmorat, 2004; Tinga, 2009) or energy-based approaches (Dang-Van and Papadopoulos, 1999; Charkaluk and Constantinescu, 2000). The model used in the present work is based on the works of (Cailletaud and Chaboche, 1982) and (Gallerneau, 1995). The formulation is developed in the Continuum Damage Mechanics framework for metallic materials working at high temperatures by Structures and Damage Mechanics Department of French Aerospace Lab (ONERA). The model takes multiaxial loading and mean stress effects into account and a non-linear accumulation of creep and fatigue is considered.
IV.2. GENERAL FORMULATION OF THE MULTIAXIAL CREEP-FATIGUE MODEL
Different from the classical approaches for fatigue (Dang-Van, 1973; Kujawski and Ellying, 1984; Manson and Halford, 1986; Leiholz, 1986; Fatemi and Yang, 1998), the present approach allows for the quantification of damage for arbitrary cyclic thermomechanical loadings in 3D. The model works as a post-processor by assessing the multiaxial stress-strain history generated from an elastoviscoplastic FE calculation. A fast and robust rain-flow algorithm is used to count arbitrary cycles; therefore, any loading history can be used as an input allowing Combined Cycled Fatigue predictions. Note that our contribution to the modeling aspects is very limited. The present work mainly based on the utilisation of the model on CMSX4 single crystal superalloy. The main objective is to generate Goodman diagrams for various R ratios and temperatures and predict life-time for real geometries. In that sense, after the parameter identification process, a numerical tool is developed in order to generate Goodman diagrams automatically and the modeling aspects are further studied on the generated Goodman diagrams for various temperatures. CCF prediction capability of the model is presented comparing with CCF test data and finally HCF predictions on a notched specimen are presented and results are studied.
IV.2
General formulation of the multiaxial creep-fatigue model
As it is previously stated, the continuous damage model presented here is based on Continuum Damage Mechanics framework which assumes that creep and fatigue processes can be described by scalar damage variable D. The damage variable stands for the progressive deterioration of the material where D = 0 corresponds to the undamaged state or a virgin material and D = 1 corresponds to the fully damaged state or crack initiation. The model supposes that regardless of the damage mechanisms, mechanical effects of creep and fatigue damage are cumulative. D = DC + DF
(IV.1)
The interaction between creep and fatigue can be expressed in a differential form as follows: dDC = F1 (χc , Dc )dt (IV.2) dDF = F2 (AII , σ ¯H , σmax , DF )dN
(IV.3)
dD = F1 (χc , D)dt + F2 (AII , σ ¯H , σmax , D)dN
(IV.4)
where AII is the octahedral shear stress amplitude in order to introduce a multiaxial formulation, σ ¯H is the mean hydrostatic pressure, σmax is the maximum c applied load and χ is the delayed stress. Note that creep and fatigue damage interact each other in the way to increase their counterpart in the calculation of total damage. 1D and 3D expressions of all variables required to define a general anisotropic
45
46
CHAPTER IV. LIFE-TIME ASSESSMENT MODELING OF SINGLE CRYSTALS
Creep Var.
Multiaxial expression
Uniaxial expression (isotropic)
χc
αX0 + βh Xh + (1 − α − βh )
tension = |σ|, comp. = |σ|(1 − 2βh )
X0
si (Xi )
|σ|
Xh
Nc X q ij ij c X Xij Mijkl kl
tr(σ ) ∼
Xeq Fatigue Var. AII σmax σH
1 2
|σ|
Multiaxial expression q M − σ m )M f1 (σ M − σ m ) (σij kl q kl ijkl kl f 2 MM M σij ijkl σkl
Uniaxial expression (isotropic)
1 )) ∼ 3 mean(tr(σ
∆σ 2
|σmax | σH
Table IV.1 : Multiaxial expressions for creep-fatigue model for 1D and 3D multiaxial case are provided in Table IV.2. In the creep law, a Hayhurst’s type criterion is used (Hayhurst, 1972) where an anisotropic creep damage evolution can be considered by introducing second and fourth order tensors N and M respectively. In ∼ c ∼ c ∼ this work creep-fatigue evolution is assumed isotropic; therefore, the tensors are taken as identity and α and βh , are taken as material parameters. Furthermore, regarding the creep law, the frequency dependency on fatigue damage process at high frequency loading is eliminated by introducing a delayed stress concept (Lesne and Savalle, 1987). For the fatigue law, all variables are defined for each cycle such as maximum and mean stress and amplitude. The mean stress effect is introduced through the mean hydrostatic pressure σ ¯H . The multiaxiality is introduced through the octahedral shear stress amplitude AII where σM and σm are the maximum and minimum values of the each stress tensor component calculated for each cycle. Anisotropic fatigue damage f 1 and M f 2 which take evolution is introduced by fourth order structure tensors M ∼ ∼ ∼ ∼ place within the definition of AII and maximum stress.
IV.3
Thermomechanical formulation
The differential form of creep damage equation generalises Kachanov-Rabotnov’s equation (Kachanov, 1958; Rabotnov, 1969) where tension and compression loadings are differentiated and delayed stress X has been introduced:
dDc =
χc (X(t)) r(T (t)) A(T (t))
! (1 − Dc )−k(T (t)) dt
(IV.5)
from this equation the creep damage is calculated for the corresponding cycle by simply integrating the equation at every time step. For the temperature T(t), at the a instant “t”, a scalar quantity S¯ is built and integration is performed between t1 and t2 and the parameters A, r and k are to be supplied which can be temperature
IV.3. THERMOMECHANICAL FORMULATION
47
dependent such as: � ¯ �r S I(t) = (k + 1) dt A t1 p with S¯ = a1 si (Xi ) + a2 Nijc Xij + (1 − a1 + a2 Xij Mijkl Xkl ) Z
t2
(IV.6) (IV.7)
Note that parameters a1 and a2 are used to activate anisotropic creep damage evolution. However, in this work creep damage evolution is assumed isotropic; thus, they are set to zero. I(t) gets the value of 1, when the integration is performed from t1 to the time of rupture and the number of cycles to rupture is set to 1. If t2 is earlier than the time of rupture, then the time of rupture is calculated by taking the inverse of integrated value and multiplying it with the length of loading. Pure uniaxial creep tests in tension are necessary to identify the creep law by integrating equation IV.5 between DC = 0 and DC = 1. At a given temperature T , the rupture time is given by the relation:
tR =
1 k(T ) + 1
�
σ A(T )
�−r(T ) (IV.8)
The differential equation for the fatigue damage initiation takes the form:
δD =
h
1 − (1 − D)
β+1
iα(∆σ,σH )
"
#−β
∆σ 2
M (σH )
δN
(IV.9)
where ∆σ is the stress amplitude, σmax and σH are the maximum stress and mean stress respectively and β is a temperature independent model constant. Considering non-linear accumulation α reads: * α(∆σ, σH ) = 1 − a
0
− σl (σH ) σu − σmax
∆σ 2
+ (IV.10)
0
where a is a model parameter and σl is a function of fatigue limit, σl and mean stress: 0
σl (σH ) = σl (1 − b1 σH )
(IV.11)
where b1 is a model parameter and M is a function depending on mean stress: M (σH ) = M (1 − b2 σH )
(IV.12)
where M and b2 are temperature independent model coefficients. As previously mentioned D = 0 stands for virgin material, while D = 1 is referring to the fatigue failure. Therefore, if the differential equation IV.9 is integrated from 0 to 1, the result simply gives the number of cycles to the failure, Nf as shown below:
48
CHAPTER IV. LIFE-TIME ASSESSMENT MODELING OF SINGLE CRYSTALS ��� �
σu
σl
��
����
������
��������
����
�
���
�
�
���
Figure IV.1 : A typical Woehler curve demonstrating number of fatigue cycles to the failure for various stress amplitudes and showing the ultimate stress and fatigue limit.
" #−β ∆σ 1 2 NF = (β + 1) [1 − α(∆σ, σH )] M (σH )
(IV.13)
which can directly be read from the Woehler curve (See Figure IV.1) Note that model can be reduced by simply normalizing the temperature independent coefficients with ultimate stress, σu (T ).
IV.4
Creep-fatigue damage cumulation for complex loadings
The presented model allows for creep and fatigue damage cumulation under complex loading cycles by assessing all loading history and count cycles by using so-called “Rainflow” algorithm. After decomposing the complex history (See Figure IV.2) into n individual cycles, nc , number of cycles to the failure under creep fatigue loading, NCF is calculated from the number of cycles to failure under creep NCi and the number of cycles to failure under fatigue, NF i , (i = 1, .., nc ). The cumulation rule uses the quantities Ci = N1Ci and Fi = N1f i in order to compute the damage evolution from Di to Df in each cycle. The nonlinear accumulation of creep-fatigue damage is expressed by the following formulas:
Ci = (1 − Di )k+1 − (1 − Di−1 )k+1 h i1−αi h i1−αi−1 Fi = 1 − (1 − Df )β+1 − 1 − (1 − Di )β+1
(IV.14) (IV.15)
IV.4. CREEP-FATIGUE DAMAGE CUMULATION FOR COMPLEX LOADINGS σ C3 C1 C2
temps
Figure IV.2 : A complex loading histrory composed of three individual cycles
Above formulations assume that fatigue damage develops after creep damage. The reverse case can be obtained by simply interchanging Di with Df . Di and Df stands for the total damage value before the current cumulation process for cycle i. In equation IV.14 values Ci and Di−1 are known; therefore, Di can be directly calculated from the formula and inserted in the equation IV.15. Similarly, Df is calculated from the known values of Fi and Di . Df expresses the total damage after the cycle i and it replaces Di−1 for the next cycle i + 1. Note that the resulting cumulation rule predicts more conservative results than 1 = N1C + N1F ) and failure under creep-fatigue interaction is linear accumulation ( NCF given when DCF reaches 1. As a representation of non-linear accumulation see Figure IV.3
Figure IV.3 : Non linear interaction of creep and fatigue in IN 100 alloy (Lemaitre and Chaboche, 1994)
49
50
CHAPTER IV. LIFE-TIME ASSESSMENT MODELING OF SINGLE CRYSTALS
IV.5
Parameter identification
Parameter identification of creep-fatigue damage model is based on the assessment of creep test results and Woehler curves. For each temperature, the parameters A(T ) and r(T ) can be identified from the corresponding creep curves. The identification of k(T ) is achieved from the creep data showing strain evolution with time. The coefficient βh introduced in Hayhurst’s creep criterion is used to distinguish tension and compression behaviour of the material under creep. The standard creep test data performed under tension and compression is enough to calibrate βh . However in this work, it is assumed that for single crystals the difference between creep regime behaviour of the material under tension and compression is insignificant. Therefore it is set to zero. Parameter calibration for CMSX-4 is shown in figure IV.4. The test results for various temperatures are taken from the literature (Report No5 of BE 96-3911, 1999). As it is demonstrated in the figure experimental outcomes are in a good coherence with the numerical results. 1000
σ(MPa)
sim. 750ooC exp. 750oC sim. 800oC exp. 800oC sim. 850 C exp. 850oC sim. 900oC exp. 900oC sim. 950oC exp. 950ooC sim. 1000 C exp. 1000ooC sim. 1050 C exp. 1050oC
100
10
100
1000
10000
time (hours)
Figure IV.4 : CMSX-4 single crystal superalloy. Identification of the creep damage law from 750o C to 1050o C for direction
Majority of the fatigue parameters, σu , σl , ∆σ, σH and β can directly be read from the Woehler curves constructed for each temperature. In order to identify the degree of creep-fatigue interaction controlled by the coefficient a, Woehler curves constructed for different loading frequencies are used for each temperature. Note that the quality of the parameters strictly depends on the variety of R ratios generated in the test data. Experimental data for single crystals show that even though the material is highly anisotropic, the anisotropy in life time disappears if a stress criterion is used for the assessment. Therefore, in this work, single crystals are assumed to be isotropic in the sense of lifetime and the analysis have been performed mainly for the direction . Figure IV.5 demonstrates the comparison between numerical and experimental results.
IV.6. VALIDATION BASED ON CCF TESTS
51
It is shown that the model is successfully predicting the experimental results within the zone of available test data obeying the general regime of Woehler curves. The corresponding parameter set for CMSX-4 can be found in Appendix -C-. sim. 600oC / R=0.4 exp. 600ooC / R=0.4 sim. 600 C / R=0.0 exp. 600ooC / R=0.0 sim. 900 C / R=0.0 exp. 900oC / R=0.0
σmax(MPa)
1000
1
10
100
1000
10000 100000 1e+06 1e+07 1e+08 Nr(cycles)
Figure IV.5 : CMSX-4 single crystal superalloy. Identification of the fatigue damage from data at 600o C and 950o C
IV.6
Validation based on CCF tests
Single crystal components especially in turbine blade industry, are generally subjected to high cycle fatigue (HCF) conditions. Nevertheless, it is well known in the engineering practice that low cycle fatigue (LCF) has also an significant influence on the life-time resulting in combined cycled fatigue (CCF). As it is mentioned in Chapter 1, to determine the interaction between LCF and HCF in single crystal components would be one of the major goals of the project PREMECCY. The aim of this section is to investigate the outcomes of the creep-fatigue model in order to see whether the identified parameters are good enough to perform CCF predictions. For that purpose the CCF tests performed on CMSX-4 components by Institute of Physics of Materials of the Academy of Sciences of the Czech Republic are utilized (IPM). For a clear presentation of the CCF results, specific definitions for R ratio, σmax and σmin are necessary. Figure IV.6 illustrates a typical CCF loading cycle expressing the necessary definitions. As it is schematically presented in the figure, CCF loading is nothing but superposition of LCF and HCF loadings. LCF is taken as the backbone of the loading regime, where R ratio of LCF is zero, σmin is zero and σmax is taken
52
CHAPTER IV. LIFE-TIME ASSESSMENT MODELING OF SINGLE CRYSTALS
always as positive. The dwell time is fixed as 1. min. and the frequency of the HCF is arranged in a way that there has to be 6000 HCF cycles for each LCF cycle. The R ratio of the HCF is also assumed as that of the CCF. The time spent between σlower and σupper is only 2 seconds;therefore it can be numerically ignored.
Figure IV.6 : CCF definitons of IPM
The schematical description of the CCF cycles used in the numerical analysis is shown in figure IV.7. The figure also demonstrates the interaction between LCF and HCF by demonstrating the life-time with the change of loading regime. The calculation is performed for 950o C with an endurance of 107 by taking alternating stress 110 MPa and R ratio 0.6. Regarding the life-time analysis, first of all, pure LCF cycles are taken and the corresponding life-time is calculated. After that a single HCF cycle is superimposed over the LCF cycle. Note that, even though there exist only one HCF cycle on the main LCF cycle, due to the change in maximum stress, σmax , the drop in life-time is significant. When HCF reaches to the target number (6000 cycles), the drop in life-time for superimposed LCF becomes even larger; therefore the consideration of interaction between LCF and HCF in the model leads to a more conservative estimation. Figures IV.8 and IV.9 show the CCF test results for CMSX-4. The main goal was to identify the stress amplitude corresponding to the endurance limit of 107 . For that purpose a specific stair case method is used as it is demonstrated in the figures. Model predictions are also presented within the results. It is clear that for R ratio 0.6 model predictions have a good match with the experimental results. However, for R ratio 0.8, model is overestimating the life-time. This is simply because the material data used for the identification of the parameters for that specific amplitude and R ratio was very limited. Another possible reason could be the influence of HCF on creep properties at high temperatures. In the literature this issue is still not fully
IV.7. POST-PROCESSING
Figure IV.7 : Superposition of HCF on to LCF loading and their interaction at 950o C.
understood yet and therefore not introduced in the model. For instance, in the work of Lucas it has been shown that for ultra-HCF at high temperatures and for small amplitudes time to fracture is tend to increase with the increasing stress amplitude to some extend in connection with the improved creep properties (Lucas et al., 2005). In order to recalibrate the model parameters an optimization procedure is performed by the optimization tool of the in-house FE software ZeBuLoN. The results are presented in Figure IV.10 and IV.11 both showing good coherence between experimental data and model predictions.
IV.7
Post-processing
The multiaxial creep-fatigue damage model operates on the finite element simulations results and predicts the life-time through a post calculation. First the necessary history is taken from each Gauss point throughout the mesh or a critical area of the meshed geometry and afterwards model criterion is evaluated and life time is predicted at a given instant. Note that, the calculations are based only on the data contained at the points of concern and the output of the post computation is stored in an ASCII file. The numerical example in Figure IV.12 demonstrates a 3D post calculation of a single crystal tube geometry with a notched at the center. The necessary finite element calculation is performed by using crystal plasticity model presented in the previous chapter and the stress-strain history is post-processed over the whole structure. It shows notch effect that the life time varies from 1 to infinity. The red regions neighbouring the notch fails in the first cycle where the life-time increases proportionally with an increase of distance to the core of the notch. An extensive discussion will be done in the next sections where application to real-life components are presented. In this work, the development of Goodman diagram generation tool is based
53
54
CHAPTER IV. LIFE-TIME ASSESSMENT MODELING OF SINGLE CRYSTALS
Figure IV.8 : Results from a series of CCF tests performed at 950o C with R=0.6 and target endurance 107 cycles. Values are normalized by the maximum applied stress amplitude.
on the automatic generation of specific input files in order to obtain the output necessary to construct Goodman diagrams. For that purpose a series of ASCII output files are generated through a numerical routine and the outcomes are automatically transformed into Goodman curves.
IV.8. GOODMAN DIAGRAM PREDICTIONS
Figure IV.9 : Results from a series of CCF tests performed at 950o C with R=0.8 and target endurance 107 cycles. Values are normalized by the maximum applied stress amplitude.
IV.8
Goodman diagram predictions
The most common method of assessing the fatigue characteristics of an engineering component is to construct a Goodman Diagram. The diagram has two axes: the horizontal axis stands for the mean stress or steady stress and the vertical axis
55
56
CHAPTER IV. LIFE-TIME ASSESSMENT MODELING OF SINGLE CRYSTALS
Figure IV.10 : Optimization of model coefficients based on CCF tests performed at 950o C with R=0.6 and target endurance 107 cycles. Values are normalized by the maximum applied stress amplitude.
Figure IV.11 : Optimization of model coefficients based on CCF tests performed at 950o C with R=0.8 and target endurance 107 cycles. Values are normalized by the maximum applied stress amplitude
represents the alternating stress or stress amplitude (See Figure IV.13). Different from the Woehler curves, a Goodman diagram is based on a certain life-time which is the target endurance limit for design. Any fatigue stress state above the Goodman curve violates the structural integrity of the component during the service life; therefore, should be avoided. Each Woehler curve provides only one point on the Goodman curve which is the stress values corresponding to the target life time. Hence, the construction of Goodman diagrams are costly since experimental results for various
IV.8. GOODMAN DIAGRAM PREDICTIONS
Figure IV.12 : 3D post calculation of a single crystal tube geometry with a notched at the center. The history variable is life-time
R ratios are necessary. Moreover, specific material testing strategies like stair-case method are necessary, in order to generate maximum valuable data from a limited number of specimens. In that context, the work presented here aims at the prediction of Goodman diagrams based on the results of creep-fatigue damage model. As it is previously pointed out, the current model only predicts the life time under certain thermomechanical conditions. Therefore, an efficient numerical algorithm which calculates the possible stress conditions resulting in the target life-time is necessary. The numerical tool so-called “Goodman diagram generator” developed in this work takes the target life-time as an input and looks for all possible fatigue loading conditions giving the corresponding target life-time. As a comparison a dimensional analogy can be done through the outputs of the creep-fatigue damage model and the Goodman diagram generator such as the output of the model is just a number referring to the life-time at the given instant which can be considered as 1D. However, Goodman diagram is generated from a series of points resulting in a line in the space of alternating stress and mean stress, separating the infinite life and the component failure zones. Thus, the possible effects of changes in service environment or loading regime can be visually observed on the Goodman curves providing valuable information for the design purposes. Note that an additional model validation for Goodman diagram generator is not necessary. i.e. all predictions can be compared with the experimental data through the model itself. This section is aiming at the presentation of predicted Goodman diagrams for CMSX-4 based on the parameters calibrated from standard test data and studying the possible effects of multiaxial loading, dwell times and temperature changes on the life time. Figure IV.13 demonstrates a typical Goodman diagram for a CMSX-4 single crystal at 600o C taking 107 cycles as an endurance limit. Note that the diagram
57
58
CHAPTER IV. LIFE-TIME ASSESSMENT MODELING OF SINGLE CRYSTALS
provides a life time for all R ratios.
Figure IV.13 : A typical Goodman diagram of CMSX-4 generated for the endurance of 107 cycles at 600o C
Figure IV.14 shows the change in the Goodman curve for different target endurance limits. It is worth to mention that all curves shrink to the same line approaching to the steady stress. This is due to the low alternating stress values where fatigue loading cycles can be considered as small vibrations. Thus, the failure is independent of the small oscillations but strongly depends on the ultimate stress which can be read from the point where Goodman curve crosses the horizontal axis. As expected, alternating stress values are decreasing with increasing target life. Figure IV.15 demonstrates the evolution of Goodman curved with the change of temperature. It is clear from the figure that life time of the material decreases with an increase of temperature. For a defined endurance limit corresponding stress values resulting in failure decreases with an increase of temperature. Note that the negative effect of temperature on life time increases while approaching to the creep temperatures. Figure IV.16 illustrates the creep fatigue interaction. For that purpose, a high temperature (950o C) is chosen at which significant interactions can be observed and the endurance limit is assumed very low in order to see a complete evolution in Goodman curve. In the figure three Goodman curves are presented. First of all, pure fatigue life is demonstrated at 950o C then a 4 second dwell time is introduced and a significant drop in the life-time has been observed. With a further increase in the dwell time, the nonlinear decrease in life time and domination of creep damage is observed. As a final example, a multiaxial case is studied in Figure IV.17. Goodman curve
IV.8. GOODMAN DIAGRAM PREDICTIONS
59
o Goodman diagrams of CMSX4 for several lifetimes at 600 C
600
number cycles to failure: 1056 107 108 109 10
Alternating Stress (MPa)
500 400 300 200 100 0 0
200
400 600 800 Steady Stress (MPa)
1000
1200
Figure IV.14 : Predicted Goodman diagram of CMSX-4 generated for the several endurance definitions at 600o C
Figure IV.15 : Predicted Goodman diagram of CMSX-4 generated for several temperatures with an endurance life of 107 cycles
in Figure IV.13 is taken with an endurance limit of 107 cycles at 600o C and a constant shear of 200 MPa is applied as it is illustrated in the figure. The effect is directly observed on the steady stress side. This is due to the increase in the value of maximum stress and trace of the stress which are the dominating factors for small
60
CHAPTER IV. LIFE-TIME ASSESSMENT MODELING OF SINGLE CRYSTALS
Figure IV.16 : Illustration of creep-fatigue interaction Predicted Goodman diagram of CMSX-4 generated for the several temperatures with an endurance life of 107 cycles
stress amplitudes. No effect is observed on the alternating side since the applied shear is constant and has no direct contribution to the alternating stress. The increase of shear has significant influence on the life-time as far as small stress amplitudes are concerned.
Figure IV.17 : Evolution of the Goodman diagram of CMSX-4 under increasing shear applied constantly
IV.9. APPLICATION TO REAL-LIFE COMPONENTS
IV.9
Application to real-life components
IV.9.1
Notched geometry
61
For high temperature engineering applications (generally aircraft gas turbine engines) high cycle fatigue (HCF) related failures are frequently experienced. Unlike low cycle fatigue, due to the high frequency and low stress amplitude, HCF requires a large fraction of life to produce cracks of inspectable sizes and leaves a very small fraction of life for propagation to failure (Ren and Nicholas, 2003). Therefore, detection of cracks and prediction of HCF failures is a challenging task during the service life. Despite the fact that pure HCF conditions may not lead to a total component failure, a pre-existing crack may decrease the life time catastrophically. The traditional method to study the life-time behaviour of components under HCF is to investigate notched specimens under HCF loading. In these tests the notch is considered as a pre-damaged zone or pre-existing crack causing stress concentration. Depending on the notch geometry and for elastic cases, the stress concentration is characterized by an elastic stress concentration factor, Kt from which the stress at the notch tip can be calculated as: σt = Kt σn
(IV.16)
where σt is the stress at the notch tip and σn denotes the nominal stress. However, the use of Kt values in the classical life-time estimation approaches usually leads to very conservative results. The observed conservatism basically results from high stress gradients and low effective volume of material under high stresses, i.e. the volume of the material under high stress is too small compared to the overall geometry so that the probability of possessing a defect leading to a structural failure for the corresponding stress level is very low. Moreover, plastic yielding of the material in the vicinity of the notch gives rise to redistribution of stresses which causes a decrease in the R ratio. It is well known that in most materials for the same stress amplitudes a local decrease in the R ratio has a positive effect on the life-time. Considering the above mentioned aspects, one can conclude that a proper lifetime approach should tackle all these complications with reasonable numerical and experimental costs. In that sense, presented creep-fatigue damage model provides powerful tools in order to deal with gradient effects and calculation of life-time. In order to demonstrate the full capability of the model, reproduction of the HCF tests performed on a cylindrical notched specimens within the frame work of PREMECCY project is aimed. To achieve that, first of all, the original specimen geometry is recreated and meshed in 3D. (See Figure IV.18). The specimen is subjected to HCF loading with an R ratio of 0.8 0.6 and 0.0 for several load amplitudes consequently.
62
CHAPTER IV. LIFE-TIME ASSESSMENT MODELING OF SINGLE CRYSTALS
Figure IV.18 : Cylindrical notched specimen drawing and corresponding FE mesh.
Finite element analyses have been performed by using the previously presented crystal plasticity model for the characteristic cycle. Afterwards, the results are postprocessed by creep-fatigue damage model. Initial results show that even though the stress values are estimated correctly (coherent with the Kt factor) life-time is extremely underestimated due to the stress concentration as previously discussed (See Figure IV.20). A characteristic stress distribution along the specimen is demonstrated in Figure IV.19. In the Figure it is pointed out that depending on the stress gradient a critical stress value can be assigned which outlines the critically high stressed zone. A point in the vicinity of the inflection point of the stress curve can be considered as a good candidate.Therefore, it strictly depends on the notch geometry and the stress state. After deciding the critical domain a volume averaging procedure can be performed on the stresses in order to resolve the stress concentration and calculate the proper life time. Different techniques used in the decision of critical stress can be found in the work of Kaminski (Kaminski, 2007). This method represents a nonlocal smoothing of the stress field and introduces a characteristic length r0 which should coincide with a statistically representative volume element for the distribution of defects in the material. Unfortunately, we have not used microscopic observations to obtain the statistic of porosity distribution. In in the work of Kaminski the phenomenologically identified domain is close to interdendritic spacing in the material. In the present work, the distance from the notch tip indicating the average domain is taken as 0.6 mm as it is presented in Figure IV.19. For the numerical procedure,
IV.9. APPLICATION TO REAL-LIFE COMPONENTS
63
Figure IV.19 : Stress distribution along the notched specimen showing the stress concentration and the critical zone considered as a domain to be averaged.
this distance is taken as the radius,r0 of the circle (for 2D) or the sphere (for 3D) which defines the average domain. Volume averaging procedure on a variable ψ can be expressed as follows: 1 hξ(r0 )i = V
Z ξdV
(IV.17)
V
where V (X, r0 ) denotes the volume of the domain centered at X and r0 is the radius of the circle or the sphere. Afterwards, the values at the Gauss points within this region is averaged and assigned to the Gauss point at the center. For a schematic description see Figure IV.21. Note that, at the free boundry only the volume of contributed elements are considered. In the case of existing symmetries values at the Gauss points are not mirrored. Therefore, axisymmetric calculations are not possible. Figure IV.22 shows the life-time maps of the notched specimen under fatigue load with an R ratio of 0.8. A cut oriented at (100)[001] has been taken from the cylinder in order to fully demonstrate the life time distribution and it is topographical change after the averaging process. From the figure, it is clear that averaging process considerably smoothes the stress concentration over the domain so that the critical life-time zone expands and in the same sense, minimum life-time increases. It is
64
CHAPTER IV. LIFE-TIME ASSESSMENT MODELING OF SINGLE CRYSTALS
Figure IV.20 : A section cut taken from the 3D mesh demonstrating the postprocessing.
Figure IV.21 : Averaging procedure performed on the Gauss values within the average domain.
important to notice that even though quantitatively averaging gives more sensible results qualitative assessment of the crack initiation location becomes ambiguous. Therefore, initial maps might be used for the determination of the crack initiation location and the life-time can be estimated through averaging. Figure IV.22 shows that without averaging, life-time is vanishing not exactly at the notch tip but locates a bit above or below which is coherent with the experimental observations. Stress-strain and a general distribution of life-time after averaging is demonstrated in Figure IV.23. Comparison between numerical and experimental results are given for various
IV.9. APPLICATION TO REAL-LIFE COMPONENTS
Figure IV.22 : Demonstration of the life-time maps of the notched specimen on the cut oriented (100)[001].
Figure IV.23 : Stress-strain and life-time distribution of a notch specimen under fatigue with R ratio 0.8 on the cut oriented at (100)[001]. Stress-strain maps belong to the instant when applied stress is maximum
stress amplitudes for R ratio 0.8, 0.6 and 0.0 are demonstrated in Figures IV.24, IV.25 and IV.26, consequently. Figure IV.24 and IV.24 demonstrate a good coherence with the experimental values, while results for R ratio 0.0 are overestimated (See Figure IV.26). This is due to the very low stress amplitudes for R=0.0, which result in infinite life-times (say 1012 ) outside the critical zone. Therefore, averaging becomes too sensitive around the notch and the size of the average domain must be reconsidered. In contrast, the values generated without averaging for R=0.0 match very well with the experiments.
65
CHAPTER IV. LIFE-TIME ASSESSMENT MODELING OF SINGLE CRYSTALS
o Simulation of HCF test at 750 C, R=0.8
Nr(cycles)
1e+08
sim. with averaging exp. 750oC, R=0.8
1e+07
1e+06
0.92
0.94
0.96
0.98
σmax(MPa)
1
1.02
Figure IV.24 : Comparison between numerical results and experimental data of a notched specimen under HCF loading with R=0.8 and frequency=118 Hz. Values are normalized with the maximum applied nominal stress, σn .
Simulation of HCF test at 750oC, R=0.6
1e+08
Nr(cycles)
66
sim. with averaging exp. 750oC, R=0.6
1e+07
1e+06
0.92
0.94
0.96
0.98
σmax(MPa)
1
1.02
Figure IV.25 : Comparison between numerical results and experimental data of a notched specimen under HCF loading with R=0.6 and frequency=118 Hz. Values are normalized with the maximum applied nominal stress, σn .
IV.9. APPLICATION TO REAL-LIFE COMPONENTS
67 o
Simulation of HCF test at 750 C, R=0
1e+09
sim. with averaging sim. without averaging exp. 750oC, R=0
Nr(cycles)
1e+08
1e+07
1e+06
0.8
0.85
0.9
σmax(MPa)
0.95
1
1.05
Figure IV.26 : Comparison between numerical results and experimental data of a notched specimen under HCF loading with R=0.0 and frequency=118 Hz. Values are normalized with the maximum applied nominal stress, σn
In brief, volume averaging mimics the non-local approaches by averaging and reassigning the local values. It is crucial to mention that the determination of the size of the average domain is the key factor in life-time assessment of the notched specimens. In that sense, proper investigation of the representative volume element size for defects is vital. In particular, the post-processing model is now an uncoupled nonlocal model (damage uncoupled with the mechanics). In the next chapter we will consider a fully coupled nonlocal model based on the mechanics of generalized continua which accounts for intrinsic length scales in order to capture size effects and address mesh, geometry and size independencies.
68
CHAPTER IV. LIFE-TIME ASSESSMENT MODELING OF SINGLE CRYSTALS
IV.9.2
Advanced specimens
In addition to the notch specimens, further investigation of life-time is possible through advanced specimen testing. Figure IV.27 shows an advanced specimen designed to imitate a real blade behaviour within the PREMECCY project. For that purpose, an elliptic lump mass is attached to the center of the specimen mimicking the root of the blade which attaches to the disc. It also allows for dynamical excitation and simulates realistic HCF loading by the help of a shaker. Different R ratios can be tested through one test due to the elliptical lump mass attached to the specimen.
Figure IV.27 : PREMECCY type-5 advanced specimen geometry meshed with yams.
Life-time prediction of this specimen is left as a prospective work which requires advanced dynamical analysis.
70
CHAPTER IV. LIFE-TIME ASSESSMENT MODELING OF SINGLE CRYSTALS
R´ esum´ e Le chapitre V pr´esente le d´eveloppement d’un mod`ele coupl´e d’initiation et de propagation de fissure bas´e sur la m´ecanique des milieux continus et de l’endommagement. Le probl`eme de d´ependance au maillage est discut´e et les m´ethodes de r´egularisation bas´ees sur les milieux g´en´eralis´es sont ´etudi´ees. Les milieux micro-endommag´es sont choisis comme ´etant l’approche la plus prometteuse et sont ainsi pr´esent´es plus en d´etails. Les effets de fermeture de fissure sont ´etudi´es et quelques solutions sont donn´ees pour certains probl`emes. Ensuite, les concepts num´eriques et la proc´edure d’impl´ementation par ´el´ements finis sont expliqu´es en d´etails. Apr`es la proc´edure d’identification des param`etres, le mod`ele est valid´e et calibr´e pour le monocristal PWA1483. Une discussion d´etaill´ees est fournie en fin de chapitre.
Chapter -V-
Microdamage modeling of crack propagation in single crystals
Contents V.1
Introduction . . . . . . . . . . . . . . . . . . . . . . . . . . . .
72
V.2
Strain-based damage model coupled with crystal plasticity
74
V.3
Mesh dependency and regularization . . . . . . . . . . . . .
77
V.4
Micromorphic continuum . . . . . . . . . . . . . . . . . . . .
78
V.5
Microstrain continuum . . . . . . . . . . . . . . . . . . . . . .
82
V.6
V.5.1
Balance and constitutive equations . . . . . . . . . . . . .
82
V.5.2
Application to 1D problem: . . . . . . . . . . . . . . . . .
83
V.5.3
Classical linear softening . . . . . . . . . . . . . . . . . . .
83
V.5.4
Modified damage threshold function . . . . . . . . . . . . .
85
V.5.5
Examples . . . . . . . . . . . . . . . . . . . . . . . . . . .
88
Microdamage continuum . . . . . . . . . . . . . . . . . . . .
90
V.6.1
Balance and constitutive equations . . . . . . . . . . . . .
90
V.6.2
Solution for 1D bar . . . . . . . . . . . . . . . . . . . . . .
91
V.6.3
Examples . . . . . . . . . . . . . . . . . . . . . . . . . . .
92
V.7
Fatigue crack closure effects . . . . . . . . . . . . . . . . . .
93
V.8
Finite element implementation . . . . . . . . . . . . . . . . .
98
V.8.1
Variational formulation and discretization . . . . . . . . .
98
V.8.2
Implicit incremental formulation . . . . . . . . . . . . . . .
101
V.9
Mixed element
. . . . . . . . . . . . . . . . . . . . . . . . . . 103
V.10
Model validation . . . . . . . . . . . . . . . . . . . . . . . . . 107
V.11
Application to fatigue crack growth in single crystals . . . 109
V.12
Multi-plane concepts . . . . . . . . . . . . . . . . . . . . . . . 111
72
CHAPTER V. MICRODAMAGE MODELING OF CRACK PROPAGATION IN SINGLE CRYSTALS
V.1
Introduction
Conventional lifetime assessment models of crystalline solids are based on crack initiation criteria (Gallerneau and Chaboche, 1999; Koster et al., 2002). However in the case of single crystals, anisotropic mechanical behaviour resulting from crystal structure and their general use in complex geometries (turbine industry) necessitates the consideration of growth of cracks (Marchal et al., 2006b). In single crystals, initiation of cracks are generally triggered by complex thermomechanical loading conditions; therefore, the chosen constitutive model should satisfactorily describe the strongly anisotropic and nonlinear behaviour of single crystals under these various loading conditions. The proper modeling of crack growth under cyclic loading is essential for the lifetime assessment of single crystals. A deep understanding of plasticity and fatigue damage is necessary for a realistic coupling of these two phenomena resulting in crack initiation and propagation. For instance, a node release technique (Kiyak et al., 2008) is uncoupled and does not consider crack initiation under fatigue loading, although the plastic zones are well described and crack openings are well predicted. In that sense, this approach can not be considered as fully predictive. In the literature, there have been many attempts which consider a coupling between plasticity and damage generally formalized in the framework of continuum damage mechanics. The models present a weak coupling (Simo and Ju, 1989; Lemaitre and Chaboche, 1994; Murakami et al., 1998) posses two independent flow rules for damage and plasticity which is not realistic for life-time prediction modeling under fatigue loading. Moreover, there are other attempts proposing a relatively strong coupling considering a single associated flow rule for the evolutions of plasticity and damage (Gurson, 1977; Tvergaard and Needleman, 1984; Mahnken, 2002). Another possible way of coupling could be keeping the flow rules separate but strongly relating the potentials for plasticity and damage. i.e. each flow rule becomes strongly dependent on the other as proposed in (Voyiadjis and Deliktas, 2000). Concerning crystallographic materials, strong relation between plasticity and crack growth has been shown by (Leverant and Gell, 1975; Crompton and Martin, 1984) and (Aswath, 1994). After the significant work of Rice (Rice, 1987; Flouriot et al., 2003), the crystal plasticity theory has received great interest as a candidate to model crack growth in crystalline solids. In these works, growing cracks are associated to the crystallographic slip with a visco-plastic relation and the structure of the localization bands are linked to the slip systems. Especially in the field of fatigue, growing cracks and strain localization are mentioned together with the localization of plastic strain and damage.
V.1. INTRODUCTION
The crack tip plastic zones in a single crystal grain were further studied by (Gall et al., 1996). In connection with the latter approach (Voyiadjis and Deliktas, 2000), damage localization has been associated to the crystallographic planes and inelastic deformations (Qi and Bertram, 1999; Ekh et al., 2004). A recent predictive cohesive approach has also been proposed by (Bouvard et al., 2009), where plasticity and damage are coupled in order to model creep-fatigue crack growth in single crystals with a prescribed crack path. In this context, we focused on the continuum damage model for single crystals proposed by Marchal et. al. (Marchal et al., 2006b). In this model, three damage systems are associated to each {111} plane in FCC crystals. The first damage system is assigned as an opening system, activated by the normal stress, and mainly reflects a cleavage–like mechanism. The other two accommodate in plane deformations and enable arbitrary movements after fracture. The main advantage of the approach against the methods with prescribed crack paths, like cohesive zone model (CZM) (Bouvard et al., 2009), is the multi-plane damage descriptions which allow to simulate non-straight crack paths with branching and crack bifurcation. However, the model is identified for a given mesh size and type as in many damage models (Besson, 2004). The mesh dependency arises from the loss of ellipticity of the continuum damage model after strong localization. Therefore, the boundary and the initial value problems become ill–posed (Billardon et al., 1988) and the numerical solution does not converge to a physically meaningful solution. The main objective of this chapter, which is partially based on the articles (Aslan and Forest, 2009; Aslan and Forest, 2010) is to solve the above mentioned mesh dependency problem by exploring the regularization capabilities of the micromorphic theory applied to the continuum damage single crystal model. The main motivation for switching to a higher order continuum theory was introducing an intrinsic lengthscale in order to capture size effects and to deal with mesh size and alignment dependency of the approach within a thermodynamically consistent framework. For that purpose, primarily, the continuous damage model developed by Marchal et al. is presented and simplified to concentrate on the regularization problem. In particular, the framework is limited to brittle cleavage fracture in single crystals with one single cleavage plane (suitable for instance for zinc single crystals). Two variants of the micromorphic continuum are considered. First, the microstrain theory (Forest and Sievert, 2006) is applied, which introduce a microstrain tensor associated to each material point. Secondly, another variant of the micromorphic approach, microdamage model, is presented and its numerical capabilities as a powerful regularization technique are illustrated. The theory is shown to be well suited for a finite element formulation and a detailed implementation procedure of an implicit scheme is presented. Afterwards, the numerical model is validated for monotonic loading. Finally, finite element analysis of a single edge notched (SEN)
73
74
CHAPTER V. MICRODAMAGE MODELING OF CRACK PROPAGATION IN SINGLE CRYSTALS
specimen under cyclic loading is analyzed and a comparison between numerical and experimental results has been done. For simplicity, all theory and simulations are presented within the small strain framework.
V.2
Strain-based damage model coupled with crystal plasticity
In this model, viscoplasticity and damage are coupled by introducing an additional damage strain variable ε ˙d , into the strain rate partition equation: ∼ ε ˙=ε ˙e + ε ˙p + ε ˙d ∼ ∼ ∼ ∼
(V.1)
where ε ˙e and ε ˙p are the elastic and the plastic strain rates, respectively. The flow ∼ ∼ rule for plastic part is written at the slip system level and the plastic strain rate ε ˙p is ∼ s: obtained with the orientation tensor m ∼ 1 s m = (n s ⊗ l s + l s ⊗ n s ) ∼ 2
(V.2)
where n s is the normal to the plane of slip system s and l s stands for the corresponding slip direction. Then, plastic strain rate reads: Nslip p
ε ˙ = ∼
X
s γ˙ s m ∼
(V.3)
s=1
The flow rule on slip system s is a classical Norton rule with threshold. s
γ˙ =
�
|τ s − xs | − rs K
�n
sign(τ s − xs )
(V.4)
where rs and xs are the variables for isotropic and kinematic hardening respectively and K and n are the material parameters to be fit (Nouailhas and Cailletaud, 1995). In this work, isotropic hardening is considered constant and no interaction between slip systems is accounted. Therefore, isotropic hardening becomes: rs = r0 (V.5) The kinematic hardening is taken as non-linear: xs = Cαs
with
α˙ s = γ˙ s − Dν˙ s αs
(V.6)
where C and D are material constants and ν˙ s = |γ˙ s |. The damage strain ε ˙d is decomposed in the following crystallographic ∼
V.2. STRAIN-BASED DAMAGE MODEL COUPLED WITH CRYSTAL PLASTICITY
contributions: Ndamage
ε ˙d = ∼
X
sym
sym
δ˙cs n sd ⊗ n sd + δ˙1s n sd ⊗ l sd1 + δ˙2s n sd ⊗ l sd2
(V.7)
s=1
where δ˙ s , δ˙1s and δ˙2s are the strain rates for mode I, mode II and mode III crack d growth, respectively and Ndamage stands for the number of damage planes which are fixed crystallographic planes depending on the crystal structure. Cleavage damage is represented by the opening δ s of crystallographic cleavage planes with the normal vector n s and other damage systems must be introduced for the in-plane accommodation along orthogonal directions l s1 and l s2 , once cleavage has started (Fig. V.1). Material separation is assumed to take place w.r.t. specific crystallographic planes, like cleavage planes in single crystals. Three damage criteria are associated to one cleavage and two accommodation systems: · n sd − Y s fcs = n sd · σ ∼
(V.8)
· l sdi − Y s (i = 1, 2) fis = n sd · σ ∼
(V.9)
where Y s is the critical normal stress. The evolution of crack openings are given by the following equations: δ˙cs =
�
δ˙is =
�
fcs Kd
�nd
fis Kd
�nd
· n sd sign n sd · σ ∼
�
(V.10)
sign n sd · σ · l sdi ∼
�
(V.11)
where Kd and nd are material parameters. The damage evolution is defined as the sum of absolute value of all system evolutions. Nplanes
d˙ =
X
|δ˙cs | + |δ˙1s | + |δ˙2s |
(V.12)
s=1
These equations hold for all conditions except when the crack is closed (δcs < 0) and compressive forces are applied (n sd · σ · n sd < 0). In this case, damage evolution ∼ stops (δ˙cs = δ˙is = 0), due to the unilateral damage conditions (a detailed explanation is provided in the next section). The material softening resulting from damage is achieved by the decrease in critical normal stress which is controlled by the scalar damage variable, d: Y s = Y0s + Hd + σult
(V.13)
where Y0s is the initial damage stress (usually coupled to plasticity), H is a negative modulus which controls material softening rate due to the damage and σult is the
75
76
CHAPTER V. MICRODAMAGE MODELING OF CRACK PROPAGATION IN SINGLE CRYSTALS
ultimate stress. It is important to notice that crack opening variables δcs and δis are strain like variables and they only contribute in the decrease of initial damage stress without modifying the elastic properties.
Figure V.1 : Illustration of the cleavage and two accommodation systems to be associated to the crystallographic planes.
Coupling between plasticity and damage is generated through initial damage stress Y0 in (V.13) which is controlled by cumulative slip variable γcum : Nslips
γ˙ cum =
X
|γ˙ s |
(V.14)
s=1
Then, Y0 takes the form: Y0s = σnc e−Θγcum + σult
(V.15)
This formulation suggests an exponential decaying regime from a preferably high initial cleavage stress value σnc , to an ultimate stress, σult which is close to but not equal to zero for numerical reasons and Θ is the parameter controlling the coupling rate. This form could also be considered as a crack initiation criterion which is activated by cumulative plastic slip. Note that the coupling established in this approach is not reciprocal. The evolution equation of damage is plasticity dependent but the influence of damage evolution on plastic flow is ignored, since, for single crystals, there exists no clear experimental evidence proving a direct influence of damage on the evolution of plastic deformation. Therefore, the coupling is performed only in one way. This model, complemented by the suitable constitutive equations for viscoplastic strain, has been used for the simulation of crack growth under complex cyclic loading at high temperature (Marchal et al., 2006a). Significant mesh dependency of results was found (Marchal, 2006).
V.3. MESH DEPENDENCY AND REGULARIZATION
V.3
77
Mesh dependency and regularization
Local description of damage mechanism for various materials based on phenomenological approaches aims at predictive computations of propagating damaged zones in real-life structures. Even though, in the past decades, there has been a great progress in phenomenological modeling of damage process, numerical modeling of localization phenomenon still remains a challenging objective. The difficulty arises from the ill-posed problem originating from the constitutive equations which describe the structural behaviour. For instance, for elastoplastic solids, the problem exhibits loss of uniqueness and loss of ellipticity and in the context of finite element solutions, this problem manifests itself as spurious mesh-dependency. Any remedy that is able to remove mesh-dependency observed in the simulation of strain localization phenomena is called a regularization method which generally introduces an additional intrinsic length scale into the modeling that lead to harmonic solutions. For a better representation of damage regularization a 1-D model problem is studied. Problem description: For the regularization analysis of damage, the simplest geometry is a 1D rod which obeys a brittle elastic law as it is represented in figure V.2. Since the structure is 1D, the strain and stress fields decay into scalar values, ε and σ respectively. The rod is clamped at one hand and subjected to an increasing displacement U. In the framework of classical continuum, the constitutive law is stated as; while the strain remains smaller than a critical value εy , the stress-strain relation is linear elastic with stiffness E. σ = Eε if ε ≤ εy (V.16) Above the critical value, the stress decreases with a function of strain with slope H, up to a vanishing stress that corresponds to the complete fracture of the rod. σ = Eεy − H(ε − εy ) if ε > εy
(V.17)
Such a law exhibits strain-softening since the threshold, V.17, decreases with the load history. Considering the finite element solution of the problem, the strain field is approximated by piecewise constant functions such that the length of the damaged zone is necessarily a multiple of the size of a single element. Due to the numerical noise, one element reaches the threshold slightly before the others and this encapsulates the damage zone in a single finite element. Therefore, damage simply localizes in a narrow band with a size of one element, regardless of its size, and the rest of the body tends to a pure elastic unloading as it is demonstrated in Figure V.2. However, in a regularized behaviour solution for the damage variable usually has an harmonic form (for some cases hyperbolic) and described in a smoothed damage field addressing the intrinsic length scale introduced within the formulation. For instance, in a sinusoidal form it
78
CHAPTER V. MICRODAMAGE MODELING OF CRACK PROPAGATION IN SINGLE CRYSTALS
Figure V.2 : Localization in a 1D rod specimen
becomes nothing but the wave length of the sine. (See Figure V.3) In the case of a 2D crack growth, the damage field follows a line of element regardless of their size (See Figure V.4). This mesh dependency can only be handled by regularizing damage by introducing non-locality into the classical theory results in a harmonic solution throughout the geometry. Recalling the work of (Marchal et al., 2006b), the crack growth model is identified for given mesh size and type as in many damage models. It has been observed that without regularization the mesh size and allignment strictly influence the localization fields (See Figure V.5). This work aims at solving this problem by exploring the regularization capabilities of the micromorphic theory presented in (Eringen, 1976) and further developed by (Forest and Sievert, 2006), applied to continuum damage single crystal model. After the presentation of the micromorphic continuum two higher order extensions of the theory will be studied.
V.4
Micromorphic continuum
As it is previously discussed classical Cauchy continuum theory fails to capture size effects bringing mesh dependent results, especially if localisation is observed. On the contrary based on the assumption of local action, generalized continuum theories enhance the classical theory by introducing additional degrees of freedom which result in gradient terms delivering intrinsic length scales and regularized field solutions. In
V.4. MICROMORPHIC CONTINUUM
Figure V.3 : Regularized damage zone in a 1D rod specimen
Figure V.4 : Regularization of damage fileds in a 2-D notched geometry under tension
that context, generalized continua can be classified into two main groups. The first group is characterized by higher order derivatives of the displacement or additionally defined degrees of freedom which can be traced back to the work of Cosserat brothers (Cosserat and Cosserat, 1909) in which they consider additional independent rotational degrees of freedom at each continuum point. The second gradient theory of Mindlin (Mindlin, 1964; Mindlin and Eshel, 1968) and micromorphic theory of Eringen (Eringen and Suhubi, 1964; Eringen, 1999), which recovers the Mindlin’s theory, can be considered as the major contributions to that group. The second group takes its bases from the work of Aifantis (Aifantis, 1987; M¨ uhlhaus and Aifantis, 1991) which considers the gradient of internal variables in order to formalise the so-called “strain gradient plasticity”.
79
80
CHAPTER V. MICRODAMAGE MODELING OF CRACK PROPAGATION IN SINGLE CRYSTALS
Figure V.5 : Mesh dependency observed in crack growth simulations of a CTspecimen. Note that the change of mesh size from 100 µm to 10 µm changes the plane of localization entirely.
Containing additional degrees of freedom and balance equations, the micromorphic continuum approach can be considered as the main framework for most generalized continuum models (Forest, 2009). The present work recognizes the micromorphic approach in a broader sense as a unifying theory (Forest, 2009) and uses the same thermodynamical framework in order to introduce two variants of the approach corresponding to each group. Microstrain continuum is proposed as a regularization technique based on the higher order derivatives of the displacement field, while microdamage continuum considers a scalar damage variable as a degree of freedom and introduces its gradient in order to capture size effects. The micromorphic medium introduced by Eringen and Suhubi (Eringen and Suhubi, 1964; Hirschberger et al., 2007) possesses a full microdeformation field χ ∼ representing 9 microdeformation degrees of freedom, in addition to the classical displacement field u . Therefore the material behaviour is characterized by the reference sets of degrees of freedom and state variables on which the free energy density function,psi, may depend such as: DOF := {u , χ}, ∼
ST AT E := {u ⊗ ∇, χ ⊗ ∇} ∼
(V.18)
Generalized strain measures can be introduced as Cauchy strain,ε relative deformation ∼
V.4. MICROMORPHIC CONTINUUM
81
tensor, e and the gradient of micro deformation tensor as follows: ∼ ε = u ⊗ ∇, ∼
e = u ⊗ ∇ − χ, ∼
K = χ ⊗ ∇} ∼
∼
∼
(V.19)
The virtual power of internal forces to the power done by the micromorphic variable and its first gradient can be extended as: P
Z
=−
(i)
p(i) dV
(V.20)
D
.. ˙ p(i) = σ :ε ˙+s :e ˙+S .K ∼ ∼ ∼ ∼ ∼ ∼
(V.21)
where D is a subdomain of the current configuration Ω of the body.-σ , is the ∼ Cauchy stress, s is the relative stress and S is the generalized stress tensor. Then, ∼ ∼ the power of contact forces are extended as: P
(c)
Z =
p(c) dS
(V.22)
∂D
: χ˙ p(c) = t .u˙ + M ∼
(V.23)
∼
where t is the traction vector and M stands for generalized traction. Ignoring ∼ the simple and generalized body forces, generalized principle of virtual power reads for the static case: Z
(i)
Z
p(c) dS = 0,
p dV + D
∀D ⊂ Ω
(V.24)
∂D
From this point, using the method of virtual power suggested by Maugin (Maugin, 1980), standard local balance of momentum and generalized balance of moment of momentum can be derived consequently as follows: (σ +s ).∇ = 0 ∼ ∼
(V.25)
.∇ + s =0 S ∼ ∼
(V.26)
Finally, the associated boundary conditions for the simple and generalized tractions takes the form: t = (σ +s ).n ∼ ∼
(V.27)
M =S .n ∼ ∼
(V.28)
This thermodynamical framework can be used as a standard methodology for all variants of micromorphic continuum in order to derive balance equations with proper boundary conditions. For a detailed systematic method see (Forest, 2009). Note that, in this work, all presented higher order extensions to the classical continuum are accepted as non-dissipative, for the dissipative forms see (Forest and Sievert, 2006). Elasticity relations for micromorphic media and analytical solutions for the elastic
82
CHAPTER V. MICRODAMAGE MODELING OF CRACK PROPAGATION IN SINGLE CRYSTALS
problems for micro extension and microglide are provided in Appendix.
V.5
Microstrain continuum
Splitting microdeformation tensor of the micromorphic continuum into symmetric and skew–symmetric part i.e. pure strain part and rotational part. If one introduces a symmetric tensor by disregarding the skew–symmetric part of the microdeformation, the theory decays into the microstrain model. Therefore, the full micromorphic theory then can be seen as the combination of Cosserat and microstrain theories.
V.5.1
Balance and constitutive equations
A symmetric microstrain tensor χ ε associated with the macrostrain ε is introduced ∼ ∼ and considered as a degree of freedom (DOF) in addition to the displacement vector u: DOF = {u , χ ε } (V.29) ∼ Generalized strain measures can be defined as the strain, relative deformation and gradient of micro-deformation tensors respectively: sym
ε = u ⊗ ∇, ∼
e =ε − χε , ∼ ∼ ∼
= χε ⊗∇ K ∼ ∼
(V.30)
The symmetric part of the displacement gradient is denoted by u ⊗sym ∇. The symmetric force stress tensor σ , the relative stress tensor s and a third order stress ∼ ∼ are associated with these strain measures in the work of internal forces. The tensor S ∼ following balance of momentum and balance of moment of momentum equations must be fulfilled: (σ +s ).∇ = 0 (V.31) ∼ ∼ .∇ + s =0 S ∼ ∼
(V.32)
where ·∇ represents the divergence operator. These equations are coupled by relative stress tensor s . The boundary conditions for the traction vector t and double traction ∼ tensor M read: ∼ t = (σ +s ).n , M =S .n (V.33) ∼ ∼ ∼ ∼ Elasticity relations are of the form: e σ =∼ c:ε , ∼ ∼ ∼
s =∼ b:e , ∼ ∼ ∼
.. S =A .K ∼ ∼ ∼
(V.34)
∼ ∼
In this work, only the symmetric strain tensor is decomposed into elastic and damage part for the sake of simplicity. e d ε =ε +ε (V.35) ∼ ∼ ∼
V.5. MICROSTRAIN CONTINUUM
83
Considering only cleavage, the evolution equation is derived from the yield function fc using normality, such as: ∂fc ˙ d = δ˙ (V.36) ε ∼ ∂σ ∼ For the localization analysis, softening rule (V.13) and damage criteria (V.8) are used.
V.5.2
Application to 1D problem:
Figure V.6 : 1D rod under tension with an initial imperfection
For the 1D problem, a bar with length L under monotonic tension (d = δ) is analyzed (Fig. V.6). For the analysis, a vanishing Poisson ratio is taken and elastic tensors ∼ c and ∼ b are assumed equal. Viscosity is excluded from the solutions and ∼ ∼ the cleavage plane is normal to direction 2. For the damage threshold function, two different cases are investigated. First, the yield function which is controlled by the · n | is studied and a comparison between analytical and numerical normal stress |n · σ ∼ results is drawn. As a second case, the yield function is modified by introducing the relative stress tensor in addition to the Cauchy stress.
V.5.3
Classical linear softening
Recalling the equation (V.13), one can write the classical linear yield function in a complete form for 1D as: fc = |σ22 | − (Y0 + Hδ) (V.37) From the consistency condition of the yield function, f˙c = 0, δ˙ can be solved as: 2µ(ε˙22 − ε˙d22 ) δ˙ = H
(V.38)
where µ is the second Lam´e constant. Inserting (V.36) into the above equation: 2µε˙22 δ˙ = 2µ + H
(V.39)
and for monotonic loading one gets: δ=
2µ Y0 (ε22 − ) 2µ + H 2µ
(V.40)
The balance equations (V.31) and (V.32) must be taken into account for the analytical solution: σ22,2 + s22,2 = 0, S222,2 + s22 = 0 (V.41)
84
CHAPTER V. MICRODAMAGE MODELING OF CRACK PROPAGATION IN SINGLE CRYSTALS
σ22 = 2µ(ε22 − εd22 ) = s22 = 2µ(ε22 −
χ
2µ (Hε22 + Y0 ) 2µ + H
ε22 ), S222 = Aχ ε22,2
(V.42) (V.43)
and a system of equations is obtained for the unknowns ε22,2 and χ ε22,2 which can be solved for boundary conditions (V.33): ¯ 22,2 + 2µ(ε22,2 − Hε Aχ ε22,22 + 2µ(ε22 −
χ
ε22,2 ) = 0,
(V.44)
χ
(V.45)
ε22 ) = 0
¯ = 2µH/(2µ + H). The strain component ε22 can be eliminated from the where H previous system to get: χ
ε22,222 −
¯ 2µH χ ¯ + 2µ) ε22,2 = 0 A(H
(V.46)
¯ + 2µ remains positive, the solution is sinusoidal: When H is negative and H χ
ε22 = α sin(wx2 ) + β cos(wx2 ) + γ
(V.47)
with a wave length: 2π = 2π ω
s
A(H + µ)
µH
(V.48)
Finally, solving (V.44) and (V.45) for ε22 and inserting it into (V.40), the crack opening δ is found to read: δ=
1 [(2µ − Aω 2 )χ ε22 − Aω 2 γ − Y0 ] 2µ + H
(V.49)
From figure V.7, it is concluded that the damage is regularized throughout the rod and the computations are perfectly matching with the analytical solution. However, the model exhibits an inability to soften up to final fracture (Fig. V.8). This is due to to the relative stress s as it is the divergence contribution of the higher order stress S ∼ ∼ postulated in the balance equation (V.32). As long as there exists gradient of S , the ∼ complement relative stress remains. Since the traction vector on the cleavage plane is related to σ22 + s22 , it cannot vanish even for ever-increasing crack opening. This shortcoming is also mentioned by Engelen et al. in the context of gradient enhanced approach for softening (Engelen et al., 2003).
As a remedy, a coupling between the force stress σ and the relative stress s must ∼ ∼ be introduced into the yield function in order to achieve a total softening in all stress spaces, as investigated in the next subsection.
V.5. MICROSTRAIN CONTINUUM
85
0.08
microstrain-computation analytical solution
0.07 0.06
damage
0.05 0.04 0.03 0.02 0.01 0
0
0.5
1 1.5 coordinate x2 (mm)
2
2.5
Figure V.7 : Comparison between numerical and analytical solution of a 1D rod under uniaxial tension with a central initial defect for linear softening. The analytical solution holds for the damaged zone and the rest of the rod behaves purely elastically (A=30 MPa.mm2 , H=400 MPa, µ=200000 MPa).
100
80
Force
60
40
20
0
0
0.05
0.1
0.15 displacement
0.2
0.25
0.3
Figure V.8 : Force vs. displacement diagram of a 1D softening rod for microstrain continua.
V.5.4
Modified damage threshold function
The damage threshold function (V.8) is modified so as to incorporate the effective stress σ +s : ∼ ∼ −Y fc = n · (σ + s ) · n (V.50) ∼ ∼
86
CHAPTER V. MICRODAMAGE MODELING OF CRACK PROPAGATION IN SINGLE CRYSTALS
Similar to the first case, for monotonic loading, one gets: δ=
2µ Y0 (2ε22 − − χ ε22 ) 2µ + H 2µ
(V.51)
and stress terms read: σ22 =
2µ [(H − 2µ)ε22 + 2µχ ε22 + Y0 ] 2µ + H
s22 = 2µ(ε22 −
χ
ε22 ), S222 = Aχ ε22,2
(V.52) (V.53)
Writing the first balance equation (V.31) and taking the derivative w.r.t. the second coordinate one gets: σ22,2 + s22,2 = 0 (V.54) 2µ(ε22,2 −
χ
ε22,2 ) +
2µ [(H − 2µ)ε22,2 + 2µχ ε22,2 ] = 0 2µ + H
(V.55)
which reduces to the following relation: ε22,2 =
1 χ ε22,2 2
(V.56)
Rewriting the second balance equation (V.32) and taking the derivative, the following additional relation is obtained: Aχ ε22,222 + 2µ(ε22,2 −
χ
ε22,2 ) = 0
(V.57)
Inserting now (V.56) into (V.57) gives: Aχ ε22,222 − µχ ε22,2 = 0
(V.58)
The general solution can be written in terms of hyperbolic functions, such as: χ
ε22 = α sinh(wx2 ) + β cosh(wx2 ) + γ
(V.59)
with the wave length 2π = 2π w
s
A µ
(V.60)
which is independent of H and acts as a length scale for the model. Note that this solution holds for each side of the defective zone. Furthermore, the analytical solution for ε22 is of the same kind with different constants such that ε22 = C1 sinh(wx2 ) + C2 cosh(wx2 ) + C3
(V.61)
where C1 = 2α, C2 = 2β and C3 = γ. γ is nothing but the elastic strain outside the damaged part of the rod, Y0 /2µ and other constants can be solved by taking S22 = 0
V.5. MICROSTRAIN CONTINUUM
87
at x2 = 0 and x2 = l. 0.03
analytical solution simulation
0.025
Microstrain
0.02 0.015 0.01 0.005 0
0
0.5
1 1.5 coordinate x2 (mm)
2
2.5
Figure V.9 : Comparison between numerical and analytical solution of a 1D rod under uniaxial tension with a central initial defect with modified damage threshold (A=2500 MPa.mm2 , H=1 MPa, µ=200000 MPa). 0.08 0.07 0.06
damage
0.05 0.04 0.03 0.02 0.01 0 -0.01
0
0.5
1 1.5 coordinate x2 (mm)
2
2.5
Figure V.10 : Damage distribution along the rod for the modified damage threshold. Note that damage is trapped in the imperfection zone
Figure V.11 shows that the present model is able to describe final fracture of the bar. However, if we take the derivative of (V.51) and insert (V.56) into it, the derivative of damage variable, δ, w.r.t the second coordinate, is shown to vanish. This means that damage becomes piecewise constant throughout the bar and the damage distribution is trapped into the element which has the imperfection as it is illustrated in figure V.10. Nevertheless, micro and macro strain still possesses the hyperbolic
CHAPTER V. MICRODAMAGE MODELING OF CRACK PROPAGATION IN SINGLE CRYSTALS 100
80
60 Force
88
40
20
0
0
0.02
0.04
0.06 0.08 displacement
0.1
0.12
0.14
Figure V.11 : Force vs. displacement diagram of a 1D softening rod for microstrain with modified damage treshold function.
distribution (Fig. V.9). As a result, this variant of the microstrain model is not satisfying. In general, the higher order stress tensor S could also enter the yield condition ∼ (V.8). Keeping the normality rule implies that elastic and plastic parts should be . This track, although considered for the microstrain χ and the microstrain gradient K ∼ ∼ possible, is not pursued here (See (de Borst, 1993; Forest and Sievert, 2003)).
V.5.5
Examples
In order to demonstrate the mesh dependency of the microstrain approach three 2D blocks with an initial notch on the left are analyzed. Every block is meshed with a different unit mesh size (See Figure V.12) and a tensile load is applied through the vertical axis up to a vertical strain of 8 % is reached. It has been shown that for the material parameters corresponding to the same characteristic length, damage localization bands are same. Therefore, the regularized solution previously demonstrated for a 1D bar also holds for 2D geometries. Figure V.13 demonstrates localization patern of the same 2D block by rotating the cleavage plane of the damage system consequently. As it is shown in Figure V.13, the crack path perfectly follows the cleavage plane oriented 15o from the horizontal axis. However, with an increase in the cleavage plane angle another localization path is formed due to the boundary effects. It is observed that this effect dominates the damage pattern in the case of a further increase in the cleavage angle.
V.5. MICROSTRAIN CONTINUUM
Figure V.12 : Mesh independent crack propagation for microstrain theory, through a 2D block with a single inclined cleavage plane under vertical tension with 8 % strain. Field variable δ. (A = 20 MPa.mm2 , H = 1000MPa, µ = 200000 MPa)
Figure V.13 : Crack propagating through a 2D block for microstrain theory, with a single inclined cleavage plane oriented at 15o , 30o and 45o relative to the horizontal axis consequently, under vertical tension. Field variable δ.
89
90
CHAPTER V. MICRODAMAGE MODELING OF CRACK PROPAGATION IN SINGLE CRYSTALS
V.6
Microdamage continuum
The foundation of the microdamage continuum lies in micromorphic theory introduced by Eringen and Suhubi (Eringen and Suhubi, 1964). As it is previously pointed out alternative micromorphic variables other than the full strain tensor can be chosen d (Forest, 2009). The strain gradient effect can be limited to the damage strain ε ∼ gradient and more specifically to the scalar damage variable d.
V.6.1
Balance and constitutive equations
In microdamage theory, the selected microvariable is a scalar microdamage degree of freedom (DOF) χ d, in addition to the displacement DOFs u . The DOFs and the extended state space on which constitutive functions may depend are as follows: DOF = {u ,
χ
d}
ST RAIN = {ε , ∼
χ
d, ∇ χ d}
(V.62)
The power of internal forces is extended as ˙ + a χ d˙ + b .∇ χ d˙ p(i) = σ :ε ∼ ∼
(V.63)
where generalized stresses a, b have been introduced. equations are (Aslan and Forest, 2009):
The generalized balance
div σ = 0, ∼
(V.64)
a = div b
(V.65)
The free energy density is taken as a quadratic potential in the elastic strain, damage d, relative damage d − χ d and microdamage gradient ∇χ d: 1 e 1 e ρψ = ε :c:ε + ∼ ∼ 2∼ ∼ 2
Ndamage
X
Hd +
s=1
1 χ 1 H(d − χ d)2 + A∇χ d∇χ d 2 2
(V.66)
where H, χ H and A are scalar material constants and H is negative for softening. Then, the elastic response of the material becomes: σ =ρ ∼
∂ψ e =∼ c:ε ∼ e ∼ ∂ε ∼
(V.67)
The generalized stresses read: a=ρ
∂ψ = − χ H(d − ∂χd
χ
d) ,
b = A∇χ d
(V.68)
and the driving force for the damage can be derived as: Yf = ρ
∂ψ = Hd + ∂d
χ
H(d −
χ
d)
(V.69)
V.6. MICRODAMAGE CONTINUUM
91
The damage criterion now takes the form: s f s = n s · σ · n −Ys =0 ∼
(V.70)
where Y s is the critical stress for the damage evolution. Y s = Y0 + Yf + σult
(V.71)
Inserting the generalized stress terms into the balance law (V.65) and assuming homogeneous material properties, the following differential form can be deduced: χ
d−
A χH
∆χ d = d
(V.72)
where the macrodamage d can be considered as a source term. As previously mentioned in (Aslan and Forest, 2009), this type of Helmholtz equations appear in the so–called implicit gradient theory and it is variants, as an additional equilibrium equation (Peerlings et al., 2001; Engelen et al., 2003; Peerlings et al., 2004; Germain et al., 2007). However, in these approaches generalized stresses a and b are not explicitly introduced and the microvariables are called non local variables (Forest, 2009; Dillard et al., 2006). Moreover, χ H seems as a Lagrange multiplier and a very high value leads the formulation to a gradient model (Aifantis, 1999).
V.6.2
Solution for 1D bar
The damage function can be rewritten for the 1D-rod case as follows: f = 2µ(ε22 − d) − Y0 − (H +
χ
H)d + χd
The system of equations to be solved for ε , d and ∼
χ
H χd = 0
reads:
σ22,2 = 2µ(ε22,2 − d,2 ) = 0 A χ d,22 +
χ
H(d −
χ
(V.73)
d) = 0
Due to the equation (V.74), taking the derivative of (V.73) w.r.t. coordinate gives − d,2 (H + χ H) + χ H χ d,2 = 0
(V.74) (V.75) the second (V.76)
Taking the derivative of (V.75) w.r.t. the second coordinate and inserting (V.76) into (V.75) gives: χ HH χ χ d,2 (V.77) d,222 = A(H + χ H) It appears that when
H χH H+ χ H χ
< 0, the solution for
χd
is sinusoidal:
d = α sin(ωx2 ) + β cos(ωx2 ) + γ
(V.78)
CHAPTER V. MICRODAMAGE MODELING OF CRACK PROPAGATION IN SINGLE CRYSTALS
p where ω = |H χ H/A(H + χ H)|. Same solution also holds for ε and d with different constants as shown in figure V.15. In comparison with the microstrain approach, the microdamage theory eliminates the final fracture problem without any modification since there exists no direct coupling between force stress σ and generalized stresses (see Figure V.14). It provides ∼ consistent crack growth on the cleavage plane with various orientation (see Figure V.20 for an inclined cleavage plane with respect to the load axis). 100
microstrain damage modified microstrain damage microdamage
80
Force (N)
92
60
40
20
0
0
0.02
0.04
0.06
0.08
0.1
0.12
0.14
0.16
0.18
displacement (mm)
Figure V.14 : Comparison between force vs. displacement diagram of a 1D softening rod for microstrain and microdamage continua.
It is worth mentioning that the penalization between microdamage and damage variable in the damage criterion (V.66), χ H(d− χ d), stabilizes the softening term, Hd, therefore; the critical stress for damage evolution takes the same value throughout the regularized damage zone (Fig. V.17). When a material element is broken, the stored energy, especially the energy stored by generalized stresses should vanish. Therefore, an exponential drop for the modulus A is suggested: b = Ae−Qd ∇ χ d
(V.79)
where Q is a material parameter. Note that due to the decay of the modulus A, the characteristic length starts to shrink which results in a steeper softening regime as it is illustrated in figure V.19.
V.6.3
Examples
In this section several FE analyses performed by microdamage theory are demonstrated. As a 2D example, a plate under uniaxial tension with an inclined
V.7. FATIGUE CRACK CLOSURE EFFECTS
93
analytical solution simulation
0.2
damage
0.15
0.1
0.05
0
0
0.5
1 1.5 coordinate x2 (mm)
2
2.5
Figure V.15 : Comparison between numerical and analytical solutions of a 1D rod under tension for microdamage continuum. The analytical solution is only valid at the damage zone, the rest undergoes elastic unloading (A=200 MPa.mm2 , H=-16000 MPa, χ H=50000 MPa, µ=200000 MPa).
cleavage plane is investigated (Fig. V.20). In order to trigger localization, an initial geometric defect is created on the left edge and the cleavage plane is oriented at 30 degrees from the horizontal axis. FEA results show that localization path is perfectly matching with the cleavage plane and the size of the localization band is controlled by ω in (V.78). In figure V.21, FEA of a CT-like fracture mechanics specimen under tension is considered (Flouriot et al., 2003). The analysis is done by creating a cleavage plane parallel to the horizontal axis and the loading is performed from the center of the pin. For a given characteristic length (associated with parameters A=200 MPa.mm2 , H=-16000 MPa, χ H=50000 MPa), mesh refinement of the specimen leads to a unique fracture curve and a finite size crack width, as shown in figures V.21 and V.22.
V.7
Fatigue crack closure effects
Finite element analysis of plasticity-induced fatigue crack growth necessitates particular investigation of crack closure phenomenon. The main mechanism behind crack closure is the large tensile plastic strains developed near the crack tip. In a cyclic loading regime, during unloading, previously initiated plastic strains are not fully recovered; therefore, behind the crack tip, formation of a plastic wake develops which reduces the driving force for crack growth. Moreover, during unloading, the zone near the crack tip which has already been plastically deformed, undergoes compression. The compressive residual stress in the vicinity of the crack tip strongly effects the crack
CHAPTER V. MICRODAMAGE MODELING OF CRACK PROPAGATION IN SINGLE CRYSTALS
0.09
microdamage damage
0.08 0.07 0.06 0.05 0.04 0.03 0.02 0.01 0 -0.01
0
0.5
1 1.5 coordinate x2 (mm)
2
2.5
Figure V.16 : Comparison of damage and microdamage values penalized in free energy density function (V.66).
1200 1000
Threshold (MPa)
94
800 600 400 t=10s t=15s t=17s t=20s t=23s
200 0
0
0.5
1 1.5 coordinate x2 (mm)
2
2.5
Figure V.17 : Evolution of critical damage stress stabilized throughout the damaged zone.
V.7. FATIGUE CRACK CLOSURE EFFECTS
95
120 100
Force (N)
80 60 40 20 0
0
0.02
0.04
0.06
0.08
0.1
0.12
displacement (mm)
Figure V.18 : Force vs. displacement diagram of a 1D softening rod with an exponentially decaying modulus A 0.14 0.12
damage
0.1 0.08 0.06 0.04 0.02 0
0
0.5
1 1.5 coordinate x2 (mm)
2
2.5
Figure V.19 : Shrinkage of the damage band observed in a 1D softening rod with an exponentially decaying modulus A
96
CHAPTER V. MICRODAMAGE MODELING OF CRACK PROPAGATION IN SINGLE CRYSTALS
Figure V.20 : Crack propagating through a 2D single crystal block with a single inclined cleavage plane under vertical tension with 8 % strain. Field variable δ.
tip driving force and a proper treatment in mechanical behavior becomes necessary. In the literature, crack closure problem was first investigated by (Elber, 1970) and a more general overview for finite element analysis is recently presented by (Pommier, 2002; Pommier, 2001; Solanki et al., 2004). In the present work, a special treatment of crack closure phenomenon has been established in the numerical model such that a previously damaged Gauss point deforms continuously, if the critical damage stress is reached under compressive forces (n sd · σ · n sd < 0). In that condition, when the crack ∼ is unilaterally closed (δcs ≤ 0) damage evolution stops (δ˙cs = δ˙is = 0) as it is pointed out in the previous section. Figure V.23 demonstrates the crack closure behavior of a 1D specimen subjected to tensile and compressive forces respectively, where plasticity is excluded for a clear representation. The specimen is first broken under tension and then crack opening is closed under compression. Note that the specimen recovers its elastic behavior when the opening is entirely closed. Figure V.24 shows the behavior of the same specimen under consecutive tensile and compressive forces without causing final fracture similar to a possible loading cycle under fatigue. From the figure, one can also observe that during unloading and compression, elastic behavior is preserved up to the critical damage stress, Y s , and the specimen deforms again continuously up to the crack closure. The value of critical damage stress does not change since the unrecoverable damage variable d stays constant due to the unilateral damage conditions. An elastoplastic case for fatigue is shown up to final fracture in fig. V.25.
V.7. FATIGUE CRACK CLOSURE EFFECTS
97
Figure V.21 : Crack growth in a CT-like specimen under tension. Field variable d. 3000
# of dofs: 8811 # of dofs: 16452 # of dofs: 21144
2500
Force (N)
2000 1500 1000 500 0
0
0.2
0.4
0.6 0.8 1 displacement (mm)
1.2
1.4
Figure V.22 : Mesh independency of the numerical solution for the CT-like specimen demonstrated in figure V.21; force vs. displacement diagrams for an increasing number of total degrees of freedom.
98
CHAPTER V. MICRODAMAGE MODELING OF CRACK PROPAGATION IN SINGLE CRYSTALS
Figure V.26 demonstrates a special 1D model problem explaining the interaction between the cleavage and the accomodation systems, in addition to the interaction between the crack opening variable, δ and the damage variable, d. For that purpose, at first, an initial defect has been introduced at the central element of the 1D rod. At stage I, the rod is loaded in the direction 2, up to the initial damage stress, Y0 . The deformation at stage I is totally elastic; therefore, only a change in F2 vs disp2 diagram showing the elastic loading is observed. At stage II, the softening starts at the weak element and continues up to the final fracture. Thus, the crack opening for the cleavage system δ2 starts to initiate and the damage, d evolves untill the critical normal stress reaches the ultimate stress, (Y0 = σult ), which is very close to zero. At stage III, the rod is further deformed in the direction 2 and the crack continues to be opened. However, since the critical normal stress is at its ultimate value, the material can not sustain any force and deforms freely. As it is demonstrated in the d vs. time(s) diagram, when the ultimate values is reached, (Y0 = σult ), the evolution of damage stops regardless of the further evolutions of crack openings. In that sense, at stage IV, the rod is deformed in the direction 1 and no resistance is recorded (F1 = F2 = σult ), even though the accomodation system in that direction is activated (δ1 > 0). Stage V, proves that the cracked element is able to deform freely in all directions. At stage VI, the rod is placed back to its original position in the direction 1; therefore, the crack opening for the accomodation system is closed (δ1 = 0). At stage VII, the rod is totally deformed back and it takes it is initial configuration in all directions; therefore, in addition to the accomodation system, the crack opening for the cleavage system is also closed (δ2 = 0). If the rod is further compressed after the closure of the cleavage system, the material behaves elastically as it is performed at stage VIII and demonstrated in F2 vs. disp2 diagram.
V.8 V.8.1
Finite element implementation Variational formulation and discretization
The variational formulation of the microdamage approach can be derived directly from the principle of virtual power (V.63): −
Z
Z
(i)
Ω
−
Z Ω
χ˙
p(c) dS = 0
p dV +
(V.80)
∂Ω
Z
χ˙
(σ :ε ˙ + a δ + b .∇ δ)dV + ∼ ∼
˙ (t .u˙ + a χ δ)dS =0
(V.81)
∂Ω
Finite element discretization of the displacement field u and the microdamage field χ δ take the following form: u = Nu du ,
∇u = Bu du ,
χ
δ = Nδ dδ ,
∇χ δ = Bδ dδ
(V.82)
V.8. FINITE ELEMENT IMPLEMENTATION
Figure V.23 : Force vs. displacement diagram of a 1D softening rod under fatigue. Final fracture occurs in the first cycle
Figure V.24 : Force vs. displacement diagram of a 1D partially damaged rod under fatigue.
25 20 15
Force (N)
10 5 0 -5 -10 -15 -20 -25
0
2000 4000 6000 8000 10000 12000 14000 16000 18000 20000 time (s)
Figure V.25 : Representation of a material damaging under cyclic loading
99
100
CHAPTER V. MICRODAMAGE MODELING OF CRACK PROPAGATION IN SINGLE CRYSTALS
Figure V.26 : 1D FE problem demonstrating the evolution of forces,F1 , F2 , crack openings, δ1 , δ2 and damage, d, through time(s) with the corresponding loading sequences above.
V.8. FINITE ELEMENT IMPLEMENTATION
101
where du and dδ are the nodal degrees of freedom. Nu and Nδ represent the shape functions and Bu and Bδ stand for their partial derivatives with respect to the coordinates. In this work we use isoparametric quadratic elements for both types of degrees of freedom (Nu = Nδ ). Finally, the discretized equilibrium equations read: Z Z Z T N f Nu T t dS BuT σ dV = dV + (V.83) u ∼ Ω
Ω
Z
(Nδ T a + Bδ T b )dV =
Γ
Z
(V.84)
Γ
Ω
V.8.2
Nδ T ac dS
Implicit incremental formulation
A fully implicit Newton–Raphson incremental formulation is developed for solving (V.83, V.84). The corresponding time discretization is now introduced. Using the e (t), υ s (t) (integrated from υ˙ s = |γ s (t), known values of the state variables ε ˙ s |), δc,i ∼ s δcum (t) for the current time step, the values at t + ∆t are estimated by a straight forward linearization procedure. e e (t) ε (t + ∆t) = ∆t ε ˙e (t + ∆t) +ε ∼ } ∼ | ∼ {z e ∆ε ∼
(V.85)
υ s (t + ∆t) = ∆t υ˙ s (t + ∆t) + υ s (t)
(V.86)
s s s δc,i (t + ∆t) = ∆t δ˙c,i (t + ∆t) + δc,i (t)
(V.87)
˙ + ∆t) + d(t) d(t + ∆t) = ∆t d(t
(V.88)
Note that for the sake of simplicity, kinematic hardening variable is not included in this presentation. The necessary terms for the implementation are provided by (Cailletaud and Chaboche, 1996). The presented model is implemented into the FE code ZeBuLoN (Besson et al., 1998), using a θ–method for the local integration. In order to calculate the state variable increments, the residuals and their Jacobian are written as follows: e Rε ∼
e p d + ∆ε − ∆ε = ∆ε + ∆ε ∼ ∼ ∼ ∼
(V.89)
Nslip e
= ∆ε +
X
s m ∆υ s sign(τ s − xs ) ∼
(V.90)
s=1 Nplanes
+
X s=1
∆δcs n sd ⊗ n sd + ∆δis n sd ⊗ l sdi (i = 1, 2)
(V.91)
102
CHAPTER V. MICRODAMAGE MODELING OF CRACK PROPAGATION IN SINGLE CRYSTALS
Rυs
=
Rδcs
=
Rδis
=
� Φs n ∆υ − ∆t K � s �nd f ∆δcs − ∆t c sign(n sd · σ · n sd ) ∼ Kd � s �nd f i sign(n sd · σ ∆δc − ∆t i · l sdi ) ∼ Kd Nplanes X |δcs | + |δ1s | + |δ2s | ∆d − ∆ �
s
Rd =
(V.92) (V.93) (V.94) (V.95)
s=1
(V.96) ˙ ∂{R} ∂{ϑ} [J] = = 1 − ∆t ∂{∆ϑ} ∂{∆ϑ}
(V.97) t+∆t
where {R}T = {Rεe , Rυs , Rδcs , Rδis , Rd } and ϑ stands for the internal state variables to be integrated locally. Then, the Jacobian matrix becomes:
∂Rεe ∂∆εe
∂Rυs ∂∆εe ∂Rδs c [J] = ∂∆εe ∂Rδs ∂∆εie ∂Rd ∂∆εe
∂Rεe ∂∆υ s
∂Rεe ∂∆δcs
∂Rεe ∂∆δis
∂Rεe ∂∆d
∂Rυs ∂∆υ e
∂Rυs ∂∆δcs
∂Rυs ∂∆δis
∂Rυs ∂∆d
∂Rδcs ∂∆υ e ∂Rδs i ∂∆υ e
∂Rδcs ∂δcs ∂Rδs i ∂δcs
∂Rδcs ∂d ∂Rδs i ∂δis
∂Rδcs ∂d ∂Rδs i ∂d
∂Rd ∂∆υ e
∂Rd ∂∆δis
∂Rd ∂∆δcs
∂Rd ∂∆d
(V.98)
After convergence, the θ–method allows the calculation of the tangent matrix of the behavior. R can be decomposed into two parts as: {R} = {Ri } − {Re }
(V.99)
where Re corresponds to the applied load. After the convergence (i.e. {R} ≈ {0}), an infinitesimal variation can be applied to the residual equation such as: δ{R} = {0} = δ{Ri } − δ{Re }
(V.100)
which can be rewritten in the form: δ∆ϑ = [J]−1 δ{Re }
(V.101)
V.9. MIXED ELEMENT
103
Table V.1 : Jacobian matrix terms for εe . ∂Rεe ∂∆εe ∂Rεe s ∂∆υ ∼ ∂Rεe ∼
∂∆δcs ∂Rεe ∼
∂∆δis ∂Rεe ∼
∂∆d
=∼ I ∼
s = sign(τ s − xs )m ∼
= n sd ⊗ n sd = n sd ⊗ l sdi (n = 1, 2) =0
Table V.2 : Jacobian matrix terms for υ s .
s �n−1 ∂Rυs s s s ), :m g(f ) = ∆t ΦK e = −sign(τ − x )g(f )(c ∼ ∼ ∂∆ε ∼ ∼ ∂Rυs ∂∆υ e ∂Rυs s ∂∆δc,i ∂Rυs ∂∆d
s
= I∼ − g(f ) ∂Φ ∂υ s =0 =0
For the calculation of elastic strain increment, above relation reads: e δ∆ε =J δ∆ε , ∼ ∼ ∼e
δ∆σ =C :J δ∆ε ∼ ∼ ∼ ∼e
∼
∼
(V.102)
∼
h i where J is the upper left part of [J]−1 : ∼e ∼
h [J]−1 =
J ∼e ∼
i
[Jij ]
[Jji ] [Jjj ]
(V.103)
Note that a consistent tangent matrix can directly be obtained from [C :J ] and it ∼ ∼e ∼ ∼ is non-symmetric, since the coupling between plasticity and damage is established in one way.
V.9
Mixed element
A mixed element based on the formulation proposed by Bargellini (Bargellini et al., 2009) is implemented. In that work, Bargellini proposes a three-field formulation in which volume change is a new unknown and try to eliminate volumetric locking. The proposed formulation can be easily adapted to the microdamage formulation where microdamage is taken as the new field. The main advantage would be the possibility to spare additional degrees of freedom by choosing the interpolation of the displacement field quadratic while interpolation of higher degrees of freedom are linear. Another
104
CHAPTER V. MICRODAMAGE MODELING OF CRACK PROPAGATION IN SINGLE CRYSTALS
s . Table V.3 : Jacobian matrix terms for δc,i ∂δcs e ∂∆ε ∼
= −h(f )c : (n sd ⊗ n sd ),
∂δis e ∂∆ε ∼
= −h(f )c : (n sd ⊗ l sdi )
∂δcs ∂∆υ s
c de−dγcum · n sd )h(f )σ = −sign(n sd · σ ∼ ∼n
∂δis ∂∆υ s
= −sign(n sd · σ · l sdi )h(f )σnc de−dγcum ∼
s ∂δc,i s ∂δc,i
nd h(f ) = ∆t K d
D
fcs Kd
End −1
= I∼
∂δcs ∂d
= sign(n sd · σ · n sd )h(f )(H + ∼
χ H)
∂δis ∂d
· l sdi )h(f )(H + = sign(n sd · σ ∼
χ H)
Table V.4 : Jacobian matrix terms for d. ∂d = 0 ∂∆εe ∂d = 0 ∂∆υ s ∂d = −sign(n s · σ · ns ) d ∼ d ∂∆δcs ∂d = −sign(n s · σ · ls ) d ∼ di ∂∆δis ∂d = 1 ∂∆d
V.9. MIXED ELEMENT
Figure V.27 : Mixed element demonstrating a tetrahedron element quadratic for displacemen degree of freedoms and linear for microdamage
advantage would be to attain same order of interpolation in the very important coupling, constructed between strain-like variable damage δ and the microdamage χ δ which is a degree of freedom (see equation V.66). For instance, considering a classical quadratic finite element, interpolation for scalar damage becomes linear while the interpolation for microdamage is quadratic. Therefore, applying the proposed formulation linear interpolation for both variables can be satisfied (see Figure V.27 for a graphical representation).
As a numerical example, damage growth in a plate is reconsidered. An artificial notch is introduced on the left face and a tensile load is applied. Regularized band with is exaggerated. Maps of damage and the microdamage fields are provided in Figure V.28. For the sake of demonstration microdamage field is visualized only on the defined nodes. Therefore, a star-like shape is attained indicating a linear interpolation. Displacement field is interpolated quadratically so that the scalar damage field is visualized everywhere. For the benchmarking of the new element the previous 1-D rod geometry is used. The damage bandwidth and FE mesh is given in Figure V.29. Same parameters provided in microdamage section is used. The bar is subjected to tensile loads up to the final fracture and the normalized computation time and number of iterations are recorded. The outcomes are listed in Table V.9. It has been concluded that even though some of the higher order degrees of freedom are spared, computation time is not improved significantly. The main reason is microdamage is only activated for the cracking elements which are very few compared to the overall geometry. Therefore, sparing degrees of freedom is only possible for a certain number of elements which does not bring the anticipated numerical efficiency. However, for the sake of integrity, mixed elements will be used in the further calculations.
105
106
CHAPTER V. MICRODAMAGE MODELING OF CRACK PROPAGATION IN SINGLE CRYSTALS
Figure V.28 : A plate under tension with an initial notch. FE calculation is performed with mixed elements. Microdamage field on the left, scalar damage field on the right.
Figure V.29 : 1-D rod with an initial defect at the center under tension
Element type
Integration method
Computation time (s)
Number of iterations
Mixed
Theta
1.0
1778
Classical
Theta
1.05
1866
Classical
Runge Kutta
8.85
555
V.10. MODEL VALIDATION
Figure V.30 : Finite element mesh of a CT-like specimen created by ZeBuLoN GUI.
V.10
Model validation
For the model validation, a 2D single crystal CT-like specimen under monotonic loading is analyzed. The corresponding finite element mesh is given in Fig. V.30. Analyses are performed for two different crack widths, obtained by furnishing different material parameters which control the size of intrinsic length scale, L which can be calculated from equation V.78. The propagation of a crack, corresponding stress fields and the comparison with classical elastic solutions are given in Fig. V.32. This comparison shows that the microdamage model is able to reproduce the elastic stress concentration at the crack tip except very close to the crack tip where finite stress values are predicted. Moreover, the size of the zone of departure from the elastic solution is comparable with the size of the intrinsic length scale (process zone ≈ 3L). Another 2D example, namely a plate under uniaxial tension with several cleavage planes, is investigated (see Fig. V.33). In order to trigger localization, an initial geometric defect is created on the left edge. First, a cleavage plane is oriented at 30◦ from the horizontal axis. FEA results show that localization path is perfectly matching with the cleavage plane and the size of the localization band is controlled by ω in (V.78)(Fig. V.33 - (left)). Second, two orthogonal cleavage planes are placed with an orientation of 45◦ from the horizontal axis representing {111} planes. For the former case, damage–plasticity coupling leads to merged localization bands forming a straight crack path which can be considered as a type of ductile crack (Fig. V.33 middle). For the latter case, plasticity is excluded from the calculation and crack path is allowed to choose its path between the orthogonal planes resulting in a brittle type of crack propagation (Fig. V.33 - right). Corresponding finite element results validate that the model is able to predict crack bifurcation. However, physical relevance of this fracture has to be investigated in the future.
107
CHAPTER V. MICRODAMAGE MODELING OF CRACK PROPAGATION IN SINGLE CRYSTALS
Figure V.31 : Crack growth in a 2D single crystal CT-like specimen with a single cleavage plane aligned through the horizontal axis under vertical tension. Field variable δ.(Left) A=100 MPa.mm2 , H=-20000 MPa, χ H=30000 MPa, (Right) A=150 MPa.mm2 , H=-10000 MPa, χ H=30000 MPa.
1000
crack-simulation @ t=44s elastic solution crack-simulation @t=52s elastic solution crack-simulation @t=60s elastic solution
800
sig_22 (Mpa)
108
600
400
200
0
28
30
32
34
36 38 coordinate-1 (mm)
40
42
44
Figure V.32 : Evolution of the crack and the stress fields in a CT-like specimen compared with corresponding elastic solutions.
V.11. APPLICATION TO FATIGUE CRACK GROWTH IN SINGLE CRYSTALS
Figure V.33 : Crack growth in a 2D single crystal block with a single inclined cleavage plane (left) and two orthogonal planes oriented at 45 degrees (middle and right) under vertical tension with 10 % strain. Field variable δ.
V.11
Application to fatigue crack growth in single crystals
In this section, the crack growth tests of superalloy PWA1483 performed at 950o C and presented in (Marchal, 2006) are simulated. For this purpose a standard single edge notched specimen geometry is used. The mesh and the boundary conditions are provided in figure V.35. As an initial defect, a 2.25 mm long artificial crack is introduced and the geometric symmetry is taken into account. Crack tip zone is regularly meshed and element size is fixed to 2µm which is considered as a representative value concerning crack growth in single crystals. All elements are chosen to be 2D quadratic 10-node bricks with reduced integration. A single cleavage plane is fixed to horizontal axis and the crack is oriented as (001)[100]. A sinusoidal cyclic loading regime is applied to the geometry with an R ratio=0.1 with a frequency of 0.1 Hz as it is defined in (Marchal, 2006). The parameter identification procedure √ has been performed for ∆K = 25, 35, 45 and 60MPa m respectively, where ∆K is related to the applied force and the geometry with the relation:
(p �) πa � h ) 2 tan( 2w a πa i3 0.752 + 2.02 + 0.37 1 − sin( ) KI = πa cos( 2w ) w 2w B w F √
(V.104)
The parameter values used for the life time prediction are provided in table V.5. One can observe that parameters for the damage Norton rule are taken in the same order of plastic parameters. A and χ H which mainly control the characteristic length were identified in order to obtain a damage band size of 4µm which corresponds to one element size concerning a symmetric calculation as demonstrated in Figure V.35. The parameters Θ, σnc and H control the crack initiation and crack growth rate. Therefore, they were identified from the experimental data provided in figure
109
110
CHAPTER V. MICRODAMAGE MODELING OF CRACK PROPAGATION IN SINGLE CRYSTALS
Figure V.34 : Illustration of a SEN geometry corresponding to the equation (V.104), where B is the specimen thickness.
V.37. The initial threshold value for ∆K determines the σnc and from the slope of the da/dN vs. ∆K diagram, one can identify the parameter Θ which generally deviates from 2. to 7. for single crystals. From tensile test performed up to the final fracture one can fit H which is directly determined from the softening slope. For the FE calculation, mixed type elements presented in the previous section are used and an element removing procedure has been conducted such that the element is removed from the calculation when the critical damage stress becomes zero at all gauss points accomodating in the element. Several FEA results are shown in figure V.36. First, FEA maps for opening stress, σ22 are provided. As it is noticed from the figure, the stress field perfectly moves with the crack tip and the broken elements undergo zero stress representing a realistic crack. The exact place of the crack tip can be easily tracked by the damage field demonstrated at the middle and the plastic wake zone induced by the crack growth is presented underneath. The ability of the model to predict crack growth rate is demonstrated in figure V.37. Experimental and numerical results indicate that model predictions are in good agreement with the experimental observations. The parameter values used for the life time prediction are provided in table V.5. Figure V.38 demonstrates the strain rate behaviour of the model. Experimental investigations show that with the increase of loading frequency, crack growth rates are decreasing. As it has been addressed in previous chapters, this increase in life time result from the decrease in oxidation rates, i.e. specimens under high frequency loadings are less prone to oxidation. In contrast, microdamage model predicts lower life times under higher frequencies. This is due to the viscosity induced higher stresses in the vicinity of the crack tip. High strain rates increases the local stress values; therefore, damage initiations are prematurely activated even though the damage threshold is rather high. Even though the model is quantitatively not very sensitive to strain rates a special care must be taken. Potential remedy to the problem could be considering time dependent creep damage and oxidation which are not explicitly included in the model. Figure V.39 shows the influence of the orientation on the crack growth rate. In connection with the discussions done in Chapter 2, experimental results show no
V.12. MULTI-PLANE CONCEPTS
111
Table V.5 : Microdamage parameters for the life-time assessment of PWA1483 Parameters
A
Units Values
MPamm2 2.
Θ
Kd
nd
σnc
χH
H
σult
– 3.
MPas1/n
– 6.5
MPa 1200
MPa 30000
MPa -15000
MPa 0.1
550
significant dependence on the crack growth rates. It has been shown that numerical results also match with the experimental observations. Orientation dependence is primarily due to the variations in elastic properties with orientation; however the damage criteria introduced in the current work strictly depends on the cumulated plastic slip where orientation dependence is less apparent.
Figure V.35 : Illustration of the finite element mesh of the SEN specimen with boundary conditions
V.12
Multi-plane concepts
It is crucial to state that the selection of the damage plane orientation extremely depends on the temperature and the level of observation which characterizes the morphology of the crack path. For instance, in the work of Geuffrard (Geuffrard, 2010), crack growth tests for AM1, performed relatively at low temperatures (650o C), result in sharp cracks which follow slips on {111} planes with many macro zigzags (See
112
CHAPTER V. MICRODAMAGE MODELING OF CRACK PROPAGATION IN SINGLE CRYSTALS
Figure V.36 : Demonstration of the FEA results of the SEN specimen after 10 cycles for the opening stress, σ22 , cumulative damage, δcum and the plastic strain normal to the crack propagation direction, εp22 , respectively
figure V.40). On the contrary, it has been shown that same type of specimens tested at relatively high temperatures (950o C) experience crack growth on straight paths. The observations have been done for 100µm size. As the Figure V.41 demonstrates, the temperature, crack path character and characteristic size of the observation made in the latter case is in coherence with the numerical simulation represented in Figure V.36. However, if we look closer to the latter case a micro zigzag type crack path lying on {111} planes can be observed (see Figure V.42). Figure V.42 presents that at the micron level high number of crack branching and bifurcations take place on {111} planes under fatigue loading. Note that, this path is previously considered as straight from the observation made from a relatively remote distance.
V.12. MULTI-PLANE CONCEPTS
Figure V.37 : Comparison between the numerical simulation and the experimental data of the fatigue test performed for PWA1483 for different strain rates.
Regarding the numerical modeling, it is substantial to mention that presented microdamage model gives the possibility to associate damage on the preferred planes and able to capture size effects. In that sense, for a given experimental data, same phenomenon can be simulated by simply considering {111} planes as the damage planes and the characteristic length can be adapted to a convenient size, (for instance 500 nm) which can be regarded as the superiority of the approach against the models prescribing the crack path before the numerical analysis like CZM. Figure V.43 qualitatively represents the corresponding numerical simulation performed with micro damage model showing the crack bifurcation and branching through {111} planes. Quantitative analysis are assigned as a prospective work.
113
114
CHAPTER V. MICRODAMAGE MODELING OF CRACK PROPAGATION IN SINGLE CRYSTALS
Figure V.38 : Comparison between the numerical simulation and the experimental data of the fatigue test performed for PWA1483 for different orientations.
Figure V.39 : Comparison between the numerical simulation and the experimental data of the fatigue test performed for PWA1483.
V.12. MULTI-PLANE CONCEPTS
Figure V.40 : Crack growth test of AM1 tubular specimen under fatigue at 650o C, initial notch is oriented at (001)[100] (Geuffrard, 2010).
Figure V.41 : Crack growth test of AM1 tubular specimen under fatigue at 950o C, initial notch is oriented at (001)[100] (Geuffrard, 2010).
Figure V.42 : Crack bifurcation and branching on {111} planes in a single crystal under fatigue (Flouriot, 2004)
115
116
CHAPTER V. MICRODAMAGE MODELING OF CRACK PROPAGATION IN SINGLE CRYSTALS
Figure V.43 : Comparison between the successive crack bifurcations in a (001)[110] CT specimen under fatigue (T=650o C) (Marchal, 2006) and the numerical simulation showing the crack bifurcation and branching through {111} planes. Field variable d.
Chapter -VI-
Conclusion
The main objective of the thesis was to develop a consistent methodology in order to predict crack initiation and crack growth in single crystals in the presence of strong stress and temperature gradients. Life-time prediction of the single crystal components of the turbine blades is accepted as a major task. In that context, damage mechanics is taken as a well-suited theoretical framework for the development of crack initiation and growth modeling in single crystals. On the basis of crystal plasticity theory which provides a solid link between stress and plastic strains, an uncoupled damage mechanics model based on the history of FE calculations was accepted as a fast and robust method to estimate the life-time. The most common method of assessing the fatigue characteristics of an engineering component is to construct a Goodman Diagram. Therefore, main focus was on the generation of Goodman diagrams by using the uncoupled damage mechanics model. In fact, that sort of model requires simple procedures in calibrating the parameters from the standard experimental data. Parameter identification process is explained in detail in chapter 4 and it is concluded that all parameters can be calibrated from the standard tests. It is important to point out that generation of Goodman diagrams become very expensive if it is going to be constructed only from experimental data. Therefore, proper model predictions are highly desirable in order to construct a realistic Goodman curve. For single crystals, it has been shown that life-time is decreased with an increase of temperature and dwell time and multiaxial loadings are undesired. Thus, the model should account for multiaxial loads and introduce creep-fatigue interactions. In that context, presented model is shown to suit these aspects. In the case of a real geometry life-time predictions are highly influenced by stress concentrations which result in conservative life-time estimations. The observed conservatism basically results from high stress gradients and low effective volume of material under high stresses. In that sense, notched specimens have been considered as good candidates to be investigated under the existence of stress gradients. The major
118
CHAPTER VI. CONCLUSION
issue here would be to identify the statistically critical zone in order to perform a nonlocal averaging process which smooths the local high stress values. It is important to notice that averaging process brings certain ambiguity to the determination of crack initiation location. An important conclusion here is standard approach is more suitable for the determination of the crack initiation zone, while proper life-time values can only be obtain by utilizing averaging process. In particular, the presented post-processing model was an uncoupled nonlocal model (damage uncoupled with the mechanics). A reasonable coupling requires further effort. Chapter 6 mainly aimed at introducing a fully coupled nonlocal model based on the mechanics of generalized continua which accounts for intrinsic length scales in order to capture size effects and address mesh, geometry and size independences. Two variants of micromorphic continuum and their regularization capabilities for the modeling of crack propagation in single crystals have been scrutinized. First, a crystallographic constitutive model which accounts for continuum damage with respect to fracture planes has been presented. Then, the theory has been extended from classical continuum to microstrain and microdamage continua, respectively. It has been concluded that both approaches can be good candidates in solving mesh dependency. Analytical fits and numerical results showed both theories are well suited for FEA. However, introducing only one degree of freedom and recovering classical elasticity, microdamage continuum was considered as a more promising approach and further studied. A 1D geometry was investigated for the observation of stable critical damage stress evolution and the crack closure phenomenon. It has been shown that critical stress for damage is continuously stabilized and the model is capable of simulating crack closure in the desired way successfully. After giving the details of numerical implementation procedure a mixed element was presented as a potential numerical enhancement. It has been observed that even though some of the higher order degrees of freedom are spared, computation time is not improved significantly. The main reason is microdamage is only activated for the cracking elements which are very few compared to the overall geometry. Therefore, sparing degrees of freedom is only possible for a certain number of elements which does not bring the anticipated numerical efficiency. Afterwards, the model has been validated through several 2D specimens under monotonic loading. The results have shown that the model is able to reproduce the elastic stress concentration at the crack tip and predict the crack bifurcation by defining multi-plane damage systems which could be considered as the main advantage compared to the cohesive zone models where the crack paths are predefined. After the model validation, a parameter fitting procedure was conducted in order to simulate the crack growth tests performed on single crystal PWA1483 at 950o C. A standard SEN specimen has been analyzed for several K values and a good agreement between the experimental data and the numerical results has been found. It was strictly pointed out that oxidation and creep damage is not considered in the modeling. Therefore, a slight
119
deviation from the experimental results has been observed for different strain rates. Orientation dependency of both numerical and experimental results were insignificant because of the fact that orientation dependence is primarily due to the variations in elastic properties with orientation. However, the damage criteria introduced in the current work strictly depends on the cumulated plastic slip where orientation dependence is less apparent. Finally, in connection with the future aspects the necessity of considering multiplane damage has been pointed out. Strong bifurcation and branching character of the cracks at high temperatures are demonstrated and size effects regarding the crack path character have been addressed. As a prospective issue, introducing a multi plane damage system, a bifurcation analysis under realistic creep-fatigue loadings are to be considered. The influence of crystal orientation and mixed mode loadings (modes I and II) on crack growth rate are to be investigated. Moreover, combining crystal plasticity, continuum damage and a strain gradient formulation, the model possess a great potential for modeling fatigue crack growth in polycrystals. Therefore, simulation of crack growth in polycrystals are considered as a major goal to be accomplished. Microdamage model considers many aspects: crystal plasticity, continuum damage, mixed FE formulations, higher order continuum theory etc. Therefore, numerics will always comprise a boundary for the modeling issues. In that sense, potential enhancements must always be pursued for the numerical efficiency.
Appendix -A-
Elastic relations for micromorphic and microstrain continua
122
APPENDIX A. ELASTIC RELATIONS FOR MICROMORPHIC AND MICROSTRAIN CONTINUA
Degrees of freedom (u , χ) (ui , χij ) ∼
Strain measures =χ⊗∇ ε = u ⊗ ∇, e = u ⊗ ∇ − χ, K ∼ ∼ ∼ ∼
∼
eij = ui,j − χij , Kijk = χij,k Balance equations (σ +s ).∇ + f = 0, S .∇ + s +P =0 ∼ ∼ ∼ ∼ ∼ (σij + sij ),j + fi = 0, Sijk,k + sij + Pij = 0 Boundary conditions .n t = (σ +s ).n , M =S ∼ ∼ ∼ ∼ ti = (σij + sij )nj , Mij = Sijk nk Linear isotropic elasticity potential εij = u(i,j) ,
W
1 1 1 1 λεii εjj + µεij εij + b1 eii ejj + b2 eij eij + b3 eij eji + g1 εii ejj + g2 εij (eij + eji ) 2 2 2 2 1 1 + A1 Kiki Kjjk + A2 Kiki Kkjj + A3 Kiki Kjkj + A4 Kiij Kkkj 2 2 1 1 + A5 Kiij Kjkk + A8 Kijj Kikk + A10 Kijk Kijk + A11 Kijk Kjki 2 2 1 1 1 + A13 Kijk Kjik + A14 Kijk Kkji + A15 Kijk Kikj 2 2 2 Linear isotropic elasticity relations =
σij = λεpp δij + 2µεij + g1 epp δij + g2 (eij + eji ) sij = g1 εpp δij + 2g2 εij + b1 epp δij + b2 eij + b3 eji Spqr = A1 (Kiiq δpr + Kiri δpq ) + A2 (Kqii δpr + Kipi δqr ) + A3 Kiqi δpr + A4 Kiir δpq + A5 (Krii δpq + Kiip δqr ) + A8 Kpii δqr + A10 Kpqr + A11 (Kqrp + Krpq ) + A13 Kqpr + A14 Krpq + A15 Kprq
S111 S112 S121 S122 S211 S212 S221 S222
=
AA 0 0 A2,5,8 0 A1,2,3 A1,4,5 0 0 A4,10,13 A1,11,15 0 A5,11,14 0 0 A1,4,5 0 A1,11,15 A3,10,14 0 A2,11,13 0 0 A1,2,3 A2,5,8 0 0 A8,10,15 0 A2,11,13 A5,11,14 0 0 A5,11,14 A2,11,13 0 A8,10,15 0 0 A2,5,8 A1,2,3 0 0 A2,11,13 0 A3,10,14 A1,11,15 0 A1,4,5 0 0 A5,11,14 0 A1,11,15 A4,10,13 0 0 A1,4,5 A1,2,3 0 A2,5,8 0 0 AA
AA = 2A1 + 2A2 + A3 + A4 + 2A5 + A8 + A10 + 2A11 + A13 + A14 + A15 Table A.1 : Micromorphic meduim: balance equations and isotropic linear elastic relations
K111 K112 K121 K122 K211 K212 K221 K222
123
Degrees of freedom (u , χ ε ) (ui , χ εij ) ∼ Strain measures ε = u ⊗ ∇, e = u ⊗ ∇ − χε εij = ui,j , eij = ui,j − χ εij ∼ ∼ ∼ = χε ⊗∇ Kijk = χ εij,k K ∼ ∼ Balance equations .∇ + s +P =0 (σ +s ).∇ + f = 0, S ∼ ∼ ∼ ∼ ∼ (σij + sij ),j + fi = 0, Sijk,k + sij + Pij = 0 Boundary conditions t = (σ +s ).n , M =S .n ∼ ∼ ∼ ∼ ti = (σij + sij )nj , Mij = Sijk nk Linear isotropic elasticity potential W
1 1 1 λεii εjj + µεij εij + b1 eii ejj + (b2 + b3 )eij eij + g1 εii ejj + 2g2 εij eij 2 2 2 1 + A1 Kiki Kjjk + (A2 + A3 )Kiki Kkjj + A4 Kiij Kkkj 2 1 1 + A5 Kiij Kjkk + A8 Kijj Kikk + (A10 + A13 )Kijk Kijk 2 2 1 + (A11 + A14 )Kijk Kjki + A15 Kijk Kikj 2 Linear isotropic elasticity relations =
σij = λεpp δij + 2µεij + g1 epp δij + 2g2 eij sij = g1 εpp δij + 2g2 εij + b1 epp δij + (b2 + b3 )eij Spqr = A1 Kiiq δpr + (A1 + A5 )Kiri δpq + (A2 + A3 )Kiqi δpr + (A2 + A8 )Kipi δqr + A4 Kiir δpq + A5 Kiip δqr + (A10 + A13 )Kpqr + (A11 + A14 )Kqrp
S111 S112 S 121 S122 S221 S 222
+ (A11 + A15 )Krpq AA 0 0 A+C B 0 0 I F +H 0 0 B 0 F + H D + 2E + G 0 0 A+C = A+C 0 0 G + 2E + D F + H 0 0 0 F +H I 0 B 0 B A+C 0 0 AA
AA = 2A1 + 2A2 + A3 + A4 + 2A5 + A8 + A10 + 2A11 + A13 + A14 + A15 A = A1 + A2 + A3 ; B = A1 + A4 + A5 ; C = A2 + A5 + A8 D = A3 + A10 + A14 ; E = A2 + A11 + A13 ; F = A1 + A11 + A15 G = A8 + A10 + A15 ; H = A5 + A11 + A14 ; I = A4 + A10 + A13 Table A.2 : Microstrain medium: balance equations and isotropic linear elasticity
K111 K112 K121 K122 K221 K222
Appendix -B-
Model problems
Model problems for micromorpic and microstrain continua Simple micro-stretch One of the simplest deformation case of micromorphic continuum is simple microstretch of an infinite layer with a unit height fixed along one side as it is demonstrated in Fig.1. Due to the symmetry of the problem elastic solutions for both micromorphic and microstrain theory are identical in the case of being assigned identical moduli.
Figure B.1 : Simple micro-stretch test for a micromorphic infinite layer and corresponding boundary conditions
The unknowns of the problem are u 2 = u(x2 ) and χ = χ(x2 ). Several boundary ∼ 22 conditions are possible, the chosen boundary condition set is expressed as following u(0) = 0, χ(0) = 0, σ22 + s22 = 0
(B.1)
126
APPENDIX B. MODEL PROBLEMS
For the analytical solution of the problem, a suggested way would be vanishing u and solving the differential equation for χ. To begin with let us recall the elasticity relations for isotropic case.
For micromorphic medium; T σ = λtr(ε )1 + 2µε + g1 tr(e )1 + g2 (e +e ) ∼ ∼ ∼ ∼ ∼ ∼ ∼ ∼
(B.2)
T s = g1 tr(ε )1 + 2g2 (ε ) + b1 tr(e )1 + b2 e + b3 e ∼ ∼ ∼ ∼ ∼ ∼ ∼ ∼
(B.3)
S =A K ∼ ∼ ∼
(B.4)
σ = λtr(ε )1 + 2µε + g1 tr(e )1 + 2g2 (e ) ∼ ∼ ∼ ∼ ∼ ∼ ∼
(B.5)
s = g1 tr(ε )1 + 2g2 (ε ) + b1 tr(e )1 + 2b2 e ∼ ∼ ∼ ∼ ∼ ∼ ∼
(B.6)
S =A K ∼ ∼ ∼
(B.7)
∼ ∼
For microstrain medium;
∼ ∼
Where λ and µ are Lame constants b1 , b2 , b3 , g1 , g2 are additional moduli and A is . Note that assuming no coupling between stress the 6th order elasticity tensor for S ∼ and micro-stress and taking b2 = b3 makes the behavior of both medium identical for this model problem. For b = b1 + b2 + b3 , the evaluation of elasticity law and balance equations leads to the following equations: σ22,2 + s22,2 = (λ + 2µ)u00 + b(u00 − χ0 ) = 0
(B.8)
S222,2 + s22 = Aχ00 + b(u0 − χ) = 0
(B.9)
σ22 + s22 = (λ + 2µ)u0 + b(u0 − χ) = 0
(B.10)
Solving B.8 for u00 one optains: u00 =
b χ0 (λ + 2µ + b)
Taking derivative of B.9 and plugging B.11 into it gives
(B.11)
127
Aχ000 + b(
b − 1)χ0 = 0 λ + 2µ + b
(B.12)
Solving for χ000 equation becomes; χ000 =
b(λ + 2µ) χ0 A(λ + 2µ + b)
(B.13)
From the above differential equation one can solve χ and u as χ = αcosh(wx2 ) + βsinh(wx2 ) + γ
u = αcosh(wx2 )(1 −
A 2 A w ) + βsinh(wx2 )(1 − w2 ) + γ = 0 b b
(B.14)
(B.15)
where, s w=
b(λ + 2µ A(λ + 2µ + b)
(B.16)
To identify the constants, boundary conditions must be used. For instance, from σ22 + s22 = 0, we deduce the following: λu0 + 2µu0 + b(u0 − χ) = 0
(B.17)
which can be solved for u0 as u0 =
b χ λ + 2µ + b
(B.18)
Plugging B.18 into B.9 gives Aχ00 + b(
b ) − 1)χ = 0 λ + 2µ + b
(B.19)
which can be solved for χ00 as χ00 =
b(λ + 2µ) χ λ + 2µ + b
(B.20)
From the above equation it is clear that γ = 0. Moreover, from the boundary condition: χ(0) = 0 it is known that α = −γ which decays the solution into a sinusoidal function with a wave length of 1/w as follows:
128
APPENDIX B. MODEL PROBLEMS
X22 along the symmetry-axis 0.12 micromorphic-computation microstrain-computation analytical sol. 0.1
0.08
0.06
0.04
0.02
0 0
0.2
0.4
0.6
0.8
1
Figure B.2 : Comparison between numerical and analytical solutions of simple micro-stretch test. E = 70000M pa, v = 0.3, b1 = 100000M pa, b2 = b3 = 100000M pa, Ai = 200M pa.mm2 , h = 1mm, χ0 = 0.1
χ = βsinh(wx2 )
(B.21)
where, β can be solved from the boundary condition χ(h) = χ0 as β=
χ0 sinh(wh)
(B.22)
As it is represented in Fig.2, computations perfectly agree with the analytical solution.
Simple micro-glide of micromorphic media Micro-glide of a micromorphic media should be also considered as a special case of deformation. For the model problem, again an infinite layer with a unit height has been taken and fixed along one side as it is demonstrated in figure B.4. microstrain tensor both χ ε12 and χ ε21 are fixed to χ0 at the free edge and everything is fixed at the bottom. χ ε12 =χ ε21 = χ0 The unknowns of the problem are u 1 = u(x2 ) and χ ε∼12 = χ ε∼21 = χ∼ε(x2 ). Several boundary conditions are possible, the chosen boundary condition set is expressed as following ui (0) = 0,
χ
εij (0) = 0, σ12 + s12 = 0
(B.23)
129
Figure B.3 : Simulation of the model problem: Same boundary conditions were applied with fixing lateral displacement due to symmetry
For the analytical solution of the problem, a suggested way would be again vanishing u and solving the differential equation for c hi. To begin with let us recall the elasticity relations of microstrain medium for isotropic case.
σ = λtr(ε )1 + 2µε + g1 tr(e )1 + 2g2 (e ) ∼ ∼ ∼ ∼ ∼ ∼ ∼
(B.24)
s = g1 tr(ε )1 + 2g2 (ε ) + b1 tr(e )1 + 2b2 e ∼ ∼ ∼ ∼ ∼ ∼ ∼
(B.25)
S =A K ∼ ∼ ∼
(B.26)
∼ ∼
Where λ and µ are Lame constants b1 , b2 , g1 , g2 are additional moduli and A is the 6th order elasticity tensor for S . Note that no coupling between stress and micro∼ stress is assumed (g1 = g2 = 0). The evaluation of elasticity law and balance equations leads to the following equations: σ12,2 + s12,2 = µu00 + b2 (u00 − 2χ0 ) = 0
(B.27)
S122,2 + s12 = Aχ00 + b2 (u0 − 2χ) = 0
(B.28)
σ12 + s12 = µu0 + b2 (u0 − 2χ) = 0
(B.29)
130
APPENDIX B. MODEL PROBLEMS
Figure B.4 : Pure microglide test for a micromorphic infinite layer and corresponding boundary conditions
Solving B.45 for u00 leads to u00 =
2b2 χ0 (µ + b2 )
(B.30)
Taking derivative of B.46 and plugging B.48 gives Aχ000 + b2 (
2b2 − 2)χ0 = 0 µ + b2
(B.31)
2µ + b2 χ0 A(µ + b2 )
(B.32)
Solving for χ000 equation becomes; χ000 =
From the above differential equation, χ can be solved as χ = αcosh(wx2 ) + βsinh(wx2 ) + γ
(B.33)
where, s w=
2µb2 A(µ + b2 )
(B.34)
The constants are identified by using boundary conditions. For instance, from σ12 + s12 = 0, we deduce the following: µu0 + b2 (u0 − 2χ) = 0
(B.35)
131
which can be solved for u0 as u0 =
2b2 χ µ + b2
(B.36)
Plugging B.54 into B.46 gives Aχ00 + 2b2 (
b2 ) − 1)χ = 0 µ + b2
(B.37)
2b2 µ χ A(µ + b2 )
(B.38)
which can be solved for χ00 as χ00 =
From B.56 it is clear that γ = 0. Furthermore, from the boundary condition: ij (0) = 0 it is known that α = −γ; therefore, the solution becomes a sinusoidal function with a wave length of 1/w as follows: χε
χ = βsinh(wx2 )
(B.39)
where, β can be solved from the boundary condition χ(h) = χ0 as β=
χ0 sinh(wh)
(B.40)
From the figure B.8, it is concluded that computations are perfectly matching with the analytical solution. Simple micro-glide of microstrain media Another special case of deformation of a microstrain continuum is pure microglide of an infinite layer with a unit height fixed along one side as it is demonstrated in figure B.7. Due to the symmetry of microstrain tensor both χ ε12 and χ ε21 are fixed to χ0 at the free edge and everything is fixed at the bottom. χ ε12 =χ ε21 = χ0 The unknowns of the problem are u 1 = u(x2 ) and χ ε∼12 = χ ε∼21 = χ∼ε(x2 ). Several boundary conditions are possible, the chosen boundary condition set is expressed as following ui (0) = 0,
χ
εij (0) = 0, σ12 + s12 = 0
(B.41)
For the analytical solution of the problem, a suggested way would be again vanishing u and solving the differential equation for c hi. To begin with let us recall the elasticity relations of microstrain medium for isotropic case.
132
APPENDIX B. MODEL PROBLEMS
X12 along the core 0.12 microstrain-computation analytical solution 0.1
0.08
0.06
0.04
0.02
0 0
0.2
0.4
0.6
0.8
1
Figure B.5 : Comparison between numerical and analytical solutions of simple micro-stretch test. E = 70000M pa, v = 0.3, b2 = 76923M pa, Ai = 1000M pa.mm2 , h = 1mm, χ0 = 0.1
Figure B.6 : Simulation of the simpleglide problem: Symmetry conditions were applied to the sides in order to eliminate the boundary effects
133
Figure B.7 : Pure microglide test for a micromorphic infinite layer and corresponding boundary conditions
σ = λtr(ε )1 + 2µε + g1 tr(e )1 + 2g2 (e ) ∼ ∼ ∼ ∼ ∼ ∼ ∼
(B.42)
s = g1 tr(ε )1 + 2g2 (ε ) + b1 tr(e )1 + 2b2 e ∼ ∼ ∼ ∼ ∼ ∼ ∼
(B.43)
S =A K ∼ ∼ ∼
(B.44)
∼ ∼
Where λ and µ are Lame constants b1 , b2 , g1 , g2 are additional moduli and A is . Note that no coupling between stress and microthe 6th order elasticity tensor for S ∼ stress is assumed (g1 = g2 = 0). The evaluation of elasticity law and balance equations leads to the following equations: σ12,2 + s12,2 = µu00 + b2 (u00 − 2χ0 ) = 0
(B.45)
S122,2 + s12 = Aχ00 + b2 (u0 − 2χ) = 0
(B.46)
σ12 + s12 = µu0 + b2 (u0 − 2χ) = 0
(B.47)
Solving B.45 for u00 leads to u00 =
2b2 χ0 (µ + b2 )
(B.48)
Taking derivative of B.46 and plugging B.48 gives Aχ000 + b2 (
2b2 − 2)χ0 = 0 µ + b2
(B.49)
134
APPENDIX B. MODEL PROBLEMS
Solving for χ000 equation becomes; 2µ + b2 χ0 A(µ + b2 )
χ000 =
(B.50)
From the above differential equation, χ can be solved as χ = αcosh(wx2 ) + βsinh(wx2 ) + γ
(B.51)
where, s w=
2µb2 A(µ + b2 )
(B.52)
The constants are identified by using boundary conditions. For instance, from σ12 + s12 = 0, we deduce the following: µu0 + b2 (u0 − 2χ) = 0
(B.53)
which can be solved for u0 as u0 =
2b2 χ µ + b2
(B.54)
Plugging B.54 into B.46 gives Aχ00 + 2b2 (
b2 ) − 1)χ = 0 µ + b2
(B.55)
2b2 µ χ A(µ + b2 )
(B.56)
which can be solved for χ00 as χ00 =
From B.56 it is clear that γ = 0. Furthermore, from the boundary condition: ij (0) = 0 it is known that α = −γ; therefore, the solution becomes a sinusoidal function with a wave length of 1/w as follows:
χε
χ = βsinh(wx2 )
(B.57)
where, β can be solved from the boundary condition χ(h) = χ0 as β=
χ0 sinh(wh)
(B.58)
135
X12 along the core 0.12 microstrain-computation analytical solution 0.1
0.08
0.06
0.04
0.02
0 0
0.2
0.4
0.6
0.8
1
Figure B.8 : Comparison between numerical and analytical solutions of simple micro-stretch test. E = 70000M pa, v = 0.3, b2 = 76923M pa, Ai = 1000M pa.mm2 , h = 1mm, χ0 = 0.1
From the figure B.8, it is concluded that computations are perfectly matching with the analytical solution.
Figure B.9 : Simulation of the simple glide problem: Symmetry conditions were applied to the sides in order to eliminate the boundary effects
Appendix -C-
Parameters
Crystal Plasticity Parameters
Material
slip systems
K MPa1/n
n
ro MPa
q MPa
b
c MPa
d
M
n
octa.
551.3
7.8
108.1
–
–
163514.9
1821.5
–
–
cubic
541.04
7.8
36.8
-4.7
5400.5
97189.9
1879.4
–
–
octa.
770.0
5.3
18.0
–
–
105500.0
900.0
600.
8.0
cubic
570.0
5.3
11.0
–
–
63000.0
850.0
720.
8.0
CMSX-4
PWA1483
Table C.1 : Crystal plasticity parameters for CMSX-4 and PWA1483 at 950o C
temp (o C) σu A r
M 2.9
β 5.8
σl 0.71
b1 0.71
b2 0.71
a 0.1
20 1025. 2000. 30.
600 1025. 2000. 15.
750 1200. 1800. 10.
950 800. 1070. 5.5
1000 630. 845. 5.2
1050 370. 685. 5.
k 5.0
Table C.2 : Parameters for creep-fatigue damage model for CMSX-4. Temperature independent variables are normalized by σu
Bibliography Aifantis, E. (1987). The physics of plastic deformation. International Journal of Plasticity, 3:211–248. Aifantis, E. (1999). Gradient deformation models at nano, micro and macro scales. Journal of Engineering Materials and Technology, 121:189–202. Anand, L. and Kothari, M. (1996). A computational procedure for rate independent crystal plasticity. Journal of the Mechanics and Physics of Solids, 44(4):525–558. Antolovich, B. (1996). ASM Hand book, Vol 19: Fatigue and Fracture, chapter Fatigue and fracture of nickel-base superalloys, pages 854–868. ASM international. Arakere, N. K. and Swanson, G. A. (2001). Fretting stresses in single crystal superalloy turbine blade attachments. Journal of Tribology, 123:413–423. Asaro, R. (1983). Crystal plasticity. Journal of Applied Mechanics, 50:921–934. Aslan, O. and Forest, S. (2009). Crack growth modelling in single crystals based on higher order continua. Computational Materials Science, 45:756–761. Aslan, O. and Forest, S. (2010). Numerical modeling of fatigue crack growth in single crystals based on microdamage theory. International Journal of Damage Mechanics. (In Press). Aswath, P. (1994). The effect of orientation on crystallographic cracking in notched nickel-base supperalloy single crystal subjected to far-field cyclic compression. Metallurgical and Materials Transactions, 25A:287–297. Aviation, U. (2004). Airplane Flying Handbook, volume FAA-8083-3A. Government Printing Office, Washington D.C.
U.S.
Bargellini, R., Besson, J., Lorentz, E., and Michel-Ponnelle, S. (2009). A nonlocal finite element based on volumetric strain gradient: Application to ductile fracture. Computational Materials Science, 45:762–767. Bassani, J. (1993). Plastic flow of crystals, volume 30 of Advances in Applied Mechanics, pages 191–258. Bertram, A. (2005). Elasticity and Plasticity of Large Deformations. Springer.
2
BIBLIOGRAPHY
Besson, J. (2004). Local approach to fracture. Ecole des Mines de Paris–Les Presses. Besson, J., Leriche, R., Foerch, R., and Cailletaud, G. (1998). Object–oriented programming applied to the finite element method. part ii. application to material behaviours. Revue Europeenne des Elements finis, 7:567–588. Bettge, D. and Osterle, W. (1999). “Cube slip“ in near [111] oriented specimens of a single crystal nickel–base superalloy. Scripta Materialia, 40(4):389–395. Billardon, A., Benallal, R., and Geymonat, G. (1988). Some mathematical aspects of the damage softening rate problem. In D. Moinereau, D. S. and Besson, J., editors, Cracking and Damage, Strain localization and size effect, pages 247–258. Elsevier. Borja, R. I. and Wren, J. R. (1993). Discrete micromechanics of elastoplastic crystals. International Journal for Numerical Methods in Engineering, 36:3815–3840. Bouvard, J., Chaboche, J., Feyel, F., and Gallerneau, F. (2009). A cohesive zone model for fatigue and creep-fatigue crack growth in single crystal superalloys. International Journal of Fatigue, 31:868–879. Brooks, C. R. (1984). Heat Treatment, Structure and Properties of Non-ferrous Alloys. American Society for Metals. Bruno, G. et al. (2003). Lattice misfit in CMSX-4 like nickel-base superalloys and its temperature dependence. Zeitschrift Fur Metallkunde, 94(1):12–18. Busso, E., Meissonnier, F., and O’Dowd, N. (2000). Gradient–dependent deformation of two–phase single crystals. Journal of the Mechanics and Physics of Solids, 48:2333–2361. Cailletaud, G. (1987). Une approche microm´ecanique ph´enom´enologique du comportement in´elastique des m´etaux. PhD thesis, Paris 6-Jussieu. Cailletaud, G. and Chaboche, J. (1996). Integration methods for complex plastic constitutive equations. Computer Methods in Applied Mechanics and Engineering, 133:125–155. Cailletaud, G., Chaboche, J., Forest, S., and Remy, L. (2003). On the design of single crystal turbine blades. La Revue de M´etallurgie, F´evrier:165–172. Cailletaud, G. and Chaboche, J. L. (1982). Life time predictions in 304 stainless steel by damage approach. In Proceedings of Pressure Vessel and Piping Conference, Orlando, June 27 – July 2, 1982. Chaboche, J. and Lesne, P. (1988). A non-linear continuous fatigue damage model. Fatigue and Fracture of Engineering Materials and Structures, 11:1–17.
BIBLIOGRAPHY
3
Chandler, H., editor (1996). Heat Treater’s Guide: Practices and Procedure for Nonferrous Alloys. ASM international. Charkaluk, E. and Constantinescu, A. (2000). An energetic approach in thermomechanical fatigue for silicon molybdenum cast iron. Materials at High Temperatures(UK), 17:373–380. Chieragatti, R. and Remy, L. (1991). Influence of orientation on the low cycle fatigue ˆ °c. i. fatigue life behaviour. Materials Science of mar-m 200 single crystals at 650A and Engineering, A141(1):1–9. Cosserat, E. and Cosserat, F. (1909). Th´eorie des corps d´eformables. Hermann, Paris. Crompton, J. and Martin, J. (1984). Crack tip plasticity and crack growth in a singlecrystal superalloy at elevated temperatures. Materials Science and Engineering, 64:37–43. Crone, W., Shield, T., Creuziger, A., and Henneman, B. (2004). Orientation dependence of the plastic slip near notches in ductile fcc single crystals. Journal of the Mechanics and Physics of Solids, 52:85–112. Cuiti˜ no, A. and Ortiz, M. (1993). Computational modelling of single crystals. Modelling and Simulation in Materials Science and Engineering, 1:225–263. Dang-Van, K. (1973). Sur la r´esistance ´a la fatigue des m´etaux. Techniques de l’Armement, 3:647–722.
Science and
Dang-Van, K. and Papadopoulos, I. (1999). High Cycle Metal Fatigue. Springer, New York. Davis, J. R., editor (2001). ASM specialty handbook:Nickel, Cobalt and Their Alloys. ASM international. de Borst, R. (1993). A generalization of J2 -flow theory for polar continua. Computer Methods in Applied Mechanics and Engineering, 103:347–362. Decker, R. F. (1979). Strengthening mechanisms in Ni-based Superalloys. Source book on materials for elevated temperature applications. Ed. ASM. Decker, R. F. and Sims, C. T. (1972). The Metallurgy of Ni Base Alloys. The Superalloys, Eds Sims, C. T. and Hagel, W. C. John Wiley & Sons, New York. DeLuca, D. and Annis, C. (1995). Fatigue in single crystal nickel superalloys. Office of Naval Research, Department of the Navy FR-23800. Dieter, G. (1986). Mechanical Metallurgy. McGraw-Hill, New York. Dillard, T., Forest, S., and Ienny, P. (2006). Micromorphic continuum modelling of the deformation and fracture behaviour of nickel foams. European Journal of Mechanics A/Solids, 25:526–549.
4
BIBLIOGRAPHY
Donachie, M. (1984). Introduction to Superalloys, Superalloy Source Book. American Society for Metals. Donachie, M. J. and Donachie, S. J. (2002). Superalloys. ASM international, Ohio. Duhl, D. (1989). Single crystal superalloys. In J.K. Tien, T. C., editor, Superalloys, Supercomposites, Superceramics, pages 149–182. Academic Press. Duquette, D. J. and Gell, M. (1972). The effects of environtment on the elevated temperature fatigue behaviour of nickel-base superalloy single crystals. Metallurgical Transactions, 3:1899–1905. Durand-Charre, M. (1997). The Microstructure of Superalloys. Gordon & Breach Science Publishers. Ekh, M., Lillbacka, R., and Runesson, K. (2004). A model framework for anisotropic damage coupled to crystal (visco)plasticity. International Journal of Plasticity, 20:2143–2159. Elber, W. (1970). Fatigue crack closure under cyclic tension. Engineering Fracture Mechanics, 2:37–45. Engelen, R., Geers, M., and Baaijens, F. (2003). Nonlocal implicit gradient-enhanced elasto-plasticity for the modelling of softening behaviour. International Journal of Plasticity, 19:403–433. Erickson, G. L. (1993). Superalloy development for aero and industrial gas turbines. In Proceedings of ASM 1993 Materials Congress. Materials week 93. Eringen, A. (1976). Polar and non local fields theories, in Continuum Physics, volume IV. Academic Press. Eringen, A. (1999). Microcontinuum field theories. Springer, New York. Eringen, A. and Suhubi, E. (1964). Nonlinear theory of simple microelastic solids. International Journal of Engineering Science, 2:189–203, 389–404. F¨ahrmann, M. et al. (1995). Influence of coherency stress on microstructural evolution in model ni-al-mo alloys. Acta Metallurgica et Materialia, 43(3):1007–1022. Fatemi, A. and Yang, L. (1998). Cumulative fatigue damage and life prediction theories: a survey of the state of the art for homogenous materials. International Journal of Fatigue, 20:9–34. Fedelich, B. (2002). A microstructural model for the monotonic and the cyclic mechanical behavior of single crystals of superalloys at high temperatures. International Journal of Plasticity, 18:1–49.
BIBLIOGRAPHY
Fleury, E. and Remy, L. (1994). Behavior of nickel-base superalloy single crystals under thermal-mechanical fatigue. Metallurgical and Materials Transactions A, 25(1):99–109. Flouriot, S. (2004). Determination experimentale et simulation numerique des phenomenes de localisation de la deformation en pointe de fissure dans un monocristal c.f.c. PhD thesis, Ecole des Mines ParisTech. Flouriot, S., Forest, S., Cailletaud, G., K¨oster, A., R´emy, L., Burgardt, B., Gros, V., Mosset, S., and Delautre, J. (2003). Strain localization at the crack tip in single crystal CT specimens under monotonous loading : 3D finite element analyses and application to nickel–base superalloys. International Journal of Fracture, 124:43–77. Forest, S. (2009). The micromorphic approach for gradient elasticity, viscoplasticity and damage. ASCE Journal of Engineering Mechanics, 135:117–131. Forest, S. and Sievert, R. (2003). Elastoviscoplastic constitutive frameworks for generalized continua. Acta Mechanica, 160:71–111. Forest, S. and Sievert, R. (2006). Nonlinear microstrain theories. International Journal of Solids and Structures, 43:7224–7245. Gall, K., Sehitoglu, H., and Kadioglu, Y. (1996). Fem study of fatigue crack closure under double slip. Acta Materialia, 44(10):3955–3965. Gallerneau, F. (1995). Etude et modelisation de l’endommagement d’un superalliage monocristallin revetu pour aube de turbine. PhD thesis, Ecole Nationale Superieure des Mines de Paris, France. Gallerneau, F. and Chaboche, J.-L. (1999). Fatigue life predictions of single crystals for turbine blade applications. International Journal of Damage Mechanics, 8:405–427. Germain, N., Besson, J., and Feyel, F. (2007). Simulation of laminate composites degradation using mesoscopic non–local damage model and non–local layered shell element. Modelling and Simulation in Materials Science and Engineering, 15:S425–S434. Geuffrard, M. (2010). Am`elioration des mod´eles d’endommagement de superalliages ` a base nickel. PhD thesis, Ecole des Mines ParisTech. Gumbsch, P. and Pippan, R. (2005). Multiscale Modelling of Plasticity and Fracture by means of Dislocation Mechanics. CISM Lecture Notes, Udine. Gurson, A. L. (1977). Continuum theory of ductile rupture by void nucleation and growth. part i: Yield criteria and flow rules for porous ductile media. Journal of Engineering Materials and Technology, 99:2–15.
5
6
BIBLIOGRAPHY
Hanriot, F., Cailletaud, G., and Remy, L. (1991). High temperature constitutive modeling - Theory and application, chapter Mechanical behaviour of a nickelbased superalloy single crystal, pages 139–150. ASME, New-York. Harris, K. et al. (1993). Development of two rhenium-containing superalloys for single crystal blade and directionally solidified vane applications in advanced turbine engines. Journal of Materials Engineering and Performance, 2:481–488. Havner, K. (1992). Finite plastic deformation of crystalline solids. University Press, Cambridge.
Cambridge
Hayhurst, D. (1972). Creep rupture under multiaxial state of stress. Journal of Mechanics and Physics of Solids, 20(6):381–382. Henderson, P., Berglin, L., and Jansson, C. (1998). On rafting in a single crystal nickel-base superalloy after high and low temperature creep. Scripta Materialia, 40(2):229–234. Hertzberg, H. (1989). Deformation and Fracture Mechanics of Engineering Materials. John Wiley & Sons, 3rd edition. Hill, R. (1966). Generalized constitutive relations for incremental deformation of metal crystals by multislip. Journal of Mechanics and Physics of Solids, 14:95–102. Hill, R. and Rice, J. (1972). Constitutive analysis of elasto-plastic crystals at arbitrary strain. Journal of Mechanics and Physics of Solids, 20:401–413. Hirschberger, C., Kuhl, E., and Steinmann, P. (2007). On deformational and configurational mechanics of micromorphic hyperelasticity - theory and computation. Computer Methods in Applied Mechanics and Engineering, 196:4027–4044. Honeycombe, R. (1984). The Plastic Deformation of Metals. Edward-Arnold, London, 2 edition. Jaoul, B. (1965). Etude de la plasticit´e et application aux m´etaux. Dunod, Paris. Kachanov, L. (1958). Time of rupture process under creep conditions. Izv.Akad.NAUK.SSR-Otd.Nauk, 8:26–31. Kakehi, K. (2000). Effect of primary and secondary precipitates on creep strength of ni-base superalloy single crystals. Materials Science and Engineering, A278(12):135–141. Kaminski, M. (2007). Mod´elisation de l’endommagement en fatigue des superalliages monocristallins pour aubes de turbines en zone de concentration de contrainte. PhD thesis, Ecole des Mines ParisTech.
BIBLIOGRAPHY
Kear, B. H. and Piearcey, B. J. (1967). Tensile and creep properties of single crystals of the nickel base superalloy MAR-M200. Trans. AIME 239. Khan, A. (1995). Continuum theory of plasticity. Wiley, New York. King, J. E. (1987). Fatigue crack propagation in nickel-base superalloys. effects of microstructure, load ratio and temperature. Materials Science and Technology, 3:750–764. Kiyak, Y., Fedelich, B., and Pfennig, A. (2008). Simulation of crack growth under low cycle fatigue at high temperature in a single crystal superalloy. Engineering Fracture Mechanics, 75:2418–2443. Koster, A., Alam, A. M., and R´emy, L. (2002). A physical-base model for life prediction of single crystal turbine blades under creep-fatigue loading and thermal transient conditions. In R´emy, L. and Petit, J., editors, Temperature-Fatigue Interaction, pages 203–212. ESIS Publication 29 - Elsevier, Paris. Koster, A. and R´emy, L. (2000). Am oxidation creep-fatigue damage model for fatigue at high temperature and under thermal transients. In Sehitoglu, H. and Maier, H., editors, Fatigue’99, pages 2139–2144. Elsevier. Kujawski, D. and Ellying, F. A. (1984). A cumulative damage theory of fatigue crack initiation and propagation. International Journal of Fatigue, 6:83–88. Leiholz, H. H. E. (1986). On the modified s-n curve for metal fatigue prediction and its experimental verification. Engineering Fracture Mechanics, 23:495–505. Lemaitre, J. (1992). A Course on Damage Mechanics. Springer Verlag, Berlin. Lemaitre, J. and Chaboche, J.-L. (1994). Mechanics of Solid Materials. University Press, Cambridge, UK. Lemaitre, J. and Desmorat, R. (2004). Engineeering damage mechanics: Ductile, Creep, Fatigue and Brittle Failures. Springer Verlag, Berlin. Lemaitre, J. and Plumtree, A. (1979). Application of damage concepts to predict creep-fatigue failures. Journal of Engineering Materials and Technology, 101:284– 292. Lesne, P. and Savalle, S. (1987). A differential damage rule with microinitiation and micropropagation. La Recherche A´erospatiale, (2):33–47. Leverant, G., Chan, K., and Hack, J. (1987). Fatigue crack growth in mar-m-200 single crystals. Metallurgical Transactions, 18:581–591. Leverant, G. and Gell, M. (1975). The influence of temperature and cyclic frequency on the fatigue fracture of cube oriented nickel-based supperalloy. Metallurgical Transactions, 6A:367–371.
7
8
BIBLIOGRAPHY
Leverant, G. and Kear, B. (1970). The mechanism of creep in γ 0 precipitation hardened nickel-base alloys in intermediate temperatures. Metallurgical Transactions, 1:491–498. Li, M. (1997). Study on long-term oxidation and hot corrosion behaviour of gas turbine superalloys. PhD thesis, University of Cental Florida, Orlando, Florida. Li, S. and Smith, D. (1998). Development of an anisotropic constitutive model for single-crystal superalloy for combined fatigue and creep loading. International Journal of Mechanical Sciences, 40:937–948. Liu, H., Chen, Q., and Lai, D. (1993). Shear fatigue crack growth and its analysis. Materials Science, 29:300–307. Lucas, P., Kunz, L., and Svoboda, M. (2005). High-temperature ultra-high cycle fatigue damage of notched single crystal superalloys at high mean stresses. International Journal of Fatigue, 27:1535–1540. Mahnken, R. (2002). Theoretical, numerical and identification aspects of a new model class for ductile damage. International Journal of Plasticity, 18:801–831. Maier, G. (1970). A matrix structural theory of piecewise linear elastoplasticity with interacting yield planes. Meccanica, 5:54–66. Mandel, J. (1972). Plasticit´e classique et viscoplasticit´e. CISM Courses and Lectures No. 97 Springer Verlag, Berlin. Manson, S. and Halford, G. (1986). Re-examination of cumulative fatigue damage analysis - an engineering perspective. Engineering Fracture Mechanics, 25:539– 571. Manson, S. and Hirschberg, M. (1964). Fatigue : An Interdisciplinary Approach. Syracuse University Press, Syracuse, NY. Marchal, N. (2006). Propagation de fissure en fatigue-fluage ` a haute temp´erature de superalliages monocristallins ` a base de nickel. PhD thesis, Ecole des Mines de Paris. Marchal, N., Flouriot, S., Forest, S., and Remy, L. (2006a). Crack–tip stress–strain fields in single crystal nickel–base superalloys at high temperature under cyclic loading. Computational Materials Science, 37:42–50. Marchal, N., Forest, S., R´emy, L., and Duvinage, S. (2006b). Simulation of fatigue crack growth in single crystal superalloys using local approach to fracture. In Besson, J., Moniereau, D., and Steglich, D., editors, Local approach to fracture, 9th European Mechanics of Materials Conference, Euromech–Mecamat, pages 353–358, Moret–sur–Loing, France. Presses de l’Ecole des Mines de Paris.
BIBLIOGRAPHY
9
Massalski, T. B. (1990). Binary alloy phase diagrams. ASM international, Materials Park, OH. Maugin, G. (1980). The method of virtual power in continuum mechanics : Application to coupled fields. Acta Mechanica, 35:1–70. Maugin, G. (1992). The thermomechanics of plasticity and fracture. Cambridge University Press, Cambridge. M´eric, L., Poubanne, P., and Cailletaud, G. (1991). Single crystal modeling for structural calculations. Part 1: Model presentation. Journal of Engineering Materials and Technology, 113:162–170. Miehe, C. (1996). Multisurface thermoplasticity for single crystals at large strains in terms of eulerian vector updates. International Journal of Solids and Structures, 33:3103–3130. Mindlin, R. (1964). Micro–structure in linear elasticity. Mechanics and Analysis, 16:51–78.
Archive for Rational
Mindlin, R. and Eshel, N. (1968). On first strain gradient theories in linear elasticity. International Journal of Solids and Structures, 4:109–124. Mughrabi, H. and Ott, M. (1999). Dependence of the high temperature low cycle fatigue behaviour of the monocrystalline nickel-base superalloys cmsx-4 and cmsx-6 on the γ − γ 0 morphology. Materials Science and Engineering, 272:24–30. M¨ uhlhaus, H. and Aifantis, E. (1991). A variational principle for gradient plasticity. International Journal of Solids and Structures, 28:845–857. Murakami, S., Hayakawa, K., and Liu, Y. (1998). Damage evolution and damage surface of elastic-plastic-damage materials under multiaxial loading. International Journal of Damage Mechanics, 7:103–128. Nathal, M., Mackay, R., and Garlick, R. (1985). Temperature-dependence of γ − γ’ lattice mismatch in nickel-base superalloys. Materials Science and Engineering, 75(1-2):195–205. Needleman, A., Asaro, R., Lemonds, R., and Pierce, D. (1985). Finite element analysis of crystalline solids. Computer Methods in Applied Mechanics and Engineering, 52:689–708. Nouailhas, D. and Cailletaud, G. (1995). Tension-torsion behavior of single-crystal supperalloys: Experiment and finite element analysis. International Journal of Plasticity, 11(4):451–470. Nouailhas, D. and Culi´e, J. P. (1991). Development and application of a model for single crystal superalloys. In International Conference on High Temperature Constitutive Modeling, Atlanta, USA. ASME.
10
BIBLIOGRAPHY
Paas, M. (1990). Continuum damage mechanics with an application to fatigue. PhD thesis, Eindhoven University of Technology, The Netherlands. Peerlings, R., Geers, M., de Borst, R., and Brekelmans, W. (2001). A critical comparison of nonlocal and gradient–enhanced softening continua. International Journal of Solids and Structures, 38:7723–7746. Peerlings, R., Massart, T., and Geers, M. (2004). A thermodynamically motivated implicit gradient damage framework and its application to brick masonry cracking. Computer Methods in Applied Mechanics and Engineering, 193:3403– 3417. Pollock, T. M. et al. (2002). Dislocation in Solids. Elsevier Science B. V., Amsterdam, Netherlands. Pommier, S. (2001). A study of the relationship between variable level fatigue crack growth and the cyclic constitutive behaviour of steel. International Journal of Fatigue, 23:S111–S118. Pommier, S. (2002). Plane strain crack closure and cyclic hardening. Engineering Fracture Mechanics, 69:25–44. PREMECCY (2006). Premeccy annex i “description of work”. Qi, W. and Bertram, A. (1999). Anisotropic continuum damage modeling for single crystals at high temperatures. International Journal of Plasticity, 15:1197–1215. Rabotnov, Y. N. (1969). Creep problems in structural members. North–Holland, Ed, Amsterdam, Netherlands. Rashid, M. M. and Nemat-Nasser, S. (1992). A constitutive algorithm for ratedependent crystal plasticity. Computer Methods in Applied Mechanics and Engineering, 94:201–228. Reger, M. and Remy, L. (1988). Fatigue oxidation interaction in in 100 superalloy. Metallurgical Transactions, A19(9):2259–2268. Ren, W. and Nicholas, T. (2003). Notch size effects on high cycle fatigue limit stress of udimet 720. Materials Science and Engineering, A357:141–152. Report No5 of BE 96-3911 (1999). Predictive microstructural assessment and micromechanical modeling of deformation and damage accumulation in single crystal gas turbine blading. (MICROMOD-SX). Rice, J. (1971). Inelastic constitutive relations for solids: an internal-variable theory and its application to metal plasticity. Journal of the Mechanics and Physics of Solids, 19:433–455.
BIBLIOGRAPHY
Rice, J. (1987). Tensile crack tip fields in elastic-ideally plastic crystals. Mechanics of Materials, 6:317–335. Schmid, E. (1924). In Proc. Int. Congr. Appl. Mech. (Delft), page 342. Schmid, E. and Boas, W. (1935). Kristalplastizit¨ at. Springer, Berlin. Sehitoglu, H. and Boismier, D. (1990). Thermo-mechanical fatigue pf mar-m247: part1-experiments. Journal of Engineering Materials and Technology, 112(1):68– 79. Simo, J. C. and Ju, J. W. (1989). Finite deformation damage-elastoplasticity: A nonconventional framework. International Journal of Computational Mechanics, 5:375–400. Sims, C. T., Stoloff, N. S., and C., H. W. (1987). Superalloys II. John Wiley & Sons, New York. Smith, W. F. (1981). Structure and Properties of Engineering Alloys. McGraw-Hill. Solanki, K., Daniewicz, S., and Newman, J. (2004). Finite element analysis of plasticity-induced fatigue crack closure. Engineering Fracture Mechanics, 71:149– 171. Steinmann, P. and Stein, E. (1996). On the numerical treatment and analysis of finite deformation ductile single crystal plasticity. Computer Methods in Applied Mechanics and Engineering, 129:235–254. Stouffer, D. and Dame, L. (1996). Inelastic Deformation of Metals: Models, Mechanical Properties and Metallurgy. John Wiley & Sons. Suresh, S. (1998). Fatigue of Materials. Cambridge University Press. Suresh, S. and Ritchie, R. (1984). Propagation of short fatigue cracks. International Metals Review, 29:445–476. Swanson, G. A., Linask, I., and Nisley, D. M. (1986). Life prediction and constitutive models for engine hot section anisotropic materials program. Technical report, Annual Status Report, Contract NAS3-2393. Taylor, G. (1934). The mechanism of plastic deformation of crystals, part i theoretical. Proceedings of the Royal Society of London, A 145:362–387. Teodosiu, C. (1970). A dynamic theory of dislocations and its applications to the theory of the elastic-plastic continuum. In Simmons, J., de Wit, R., and Bullough, R., editors, Fundamental Aspects of Dislocation Theory, pages 837–876. Nat. Bur. Stand. (US) Spec. Publ. 317, II.
11
12
BIBLIOGRAPHY
Teodosiu, C. (1997). Large plastic deformation of crystalline aggregates. Courses and Lectures No. 376, Udine, Springer Verlag, Berlin.
CISM
Tien, J. K. and Copley, S. M. (1971). Effect of orientation and sense of applied uniaxial stress on the morphology of coherent γ precipitates in stress annealed nickel-base superalloy crystals. Metallurgical Transactions, B2(2):543–553. Tinga, T. (2009). Multiscale modelling of Single Crystal Superalloys for Gas Turbine Blades. PhD thesis, Technische Universiteit Eindhoven. Tvergaard, V. and Needleman, A. (1984). Analysis of cup-cone fracture in a round tensile bar. Acta Metallurgica, 32:157–169. Voyiadjis, G. Z. and Deliktas, B. (2000). A coupled anisotropic damage model for the inelastic response of composite materials. Comput. Methods Appl. Mech. Engrg, 183:159–199. Wright, P. (1988). Oxidation-Fatigue interactions in a single crystal superalloy, pages 558–575. Low cycle fatigue. ASTM STP 942. Zhou, H., Ro, Y., Harada, H., Aoki, Y., and Arai, M. (2004). Deformation microstructures after low-cycle fatigue in a fourth-generation ni-base sc superalloy tms-138. Materials Science and Engineering, A381(1-2):20–27.