Excerpt from the Proceedings of the COMSOL Conference 2009 Milan
Numerical Modeling of Resistance Welding Process in Joining of Thermoplastic Composite Materials Using Comsol Multiphysics R. Carbone*1, A. Langella1 1 Dipartimento di Ingegneria dei Materiali e della Produzione – Università degli Studi di Napoli “Federico II” - Italy *Corresponding author: Piazz.le V. Tecchio 85, 80125 Napoli - Italy,
[email protected] Abstract: This paper deals of a technology involved in the joining of thermoplastic composites, the resistance welding technology. This process take advantage in the repeatable melting process for the thermoplastic resins. The process was numerically modelled to study the effect of the two main process parameters, the electric power density applied to the heating elements and the exposure time at the electric current. Keywords: Thermoplastic composites, resistance welding, Differential Scanning Calorimetric analysis, heat transfer problems.
1. Introduction The thermoplastic fibre reinforced composites TPCs are become of great interest for the industry, especially in the transport sector. The TPC materials have their greater advantage in the repeatable melting of matrix phase that make possible use pre peg (pre impregnated) laminate for subsequent forming processes, reaching thus high production rate value in the manufacture of TPC parts [1]. However, due to the limited deformations
allowed to the continuous reinforcing fibres, the TPC parts are manufactured in simple geometry, such circumstance require for the use of joining technology [2]. The adhesive technology is not possible for TPC materials as they are chemically inert needing for a “strong”, operator dependent, surface treatment; the mechanical joining technology causes disadvantage as drilling composites can results in delaminations and the metal fastening produces galvanic corrosion. The fusion bonding is a suitable method to join TPC parts using the re-melting thermoplastic matrix. The most future promising methods to melt the joint interfaces are: ultrasonic, resistance and induction welding [3]. In this paper the resistance welding technique is studied, this fusion boundary process is based on a relatively well known physic principle: the Joule effect where the electric power is dissipated in heat form by means a resistor device also heating element [4, 5], figure 1. Several researchers have investigated on the welding feasible using different types of heating elements; carbon fibres or metal meshes [5, 6, 7].
Figure 1 Experimental resistance welding set-up.
Figure 2 Current leakage in resistance welding of TPCs.
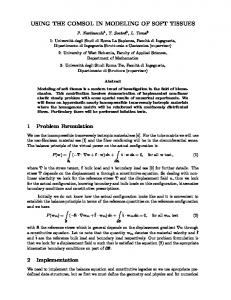
Figure 3 Configuration and dimension of the welded TPC plates.
The first type of element allows a more homogeneity in the material structure of the joints, no interruption is introduced in the material, but on the other hand the squeeze out of the melting resin from the joining area increase the negative phenomenon of current leakage in the TPC adherents [4], figure 2. The second type of heating elements allows to carry out the welding process easiest without the use of polymer foils in the staking sequence between laminate adherents and the resistor element. A common disadvantage in the resistance welding for TPCs without regard the type of used heating elements is the current leakage, figure 2; the difference in the heat transfer coefficient at the ends of the overlapping area
produce a localized overheating, the matrix squeeze out and the heating elements may to come into contact with those of the laminate. The current leakage is a limit for the extension length of the joint [4, 8]. The object of this paper is part of a more wide research program to study in depth the available joining technologies for the TPC parts. The resistance welding process is here numerically modelled by a transient t-dependent Heat Transfer simulation using Comsol Multyphisics. The main process parameters, the power density and the process time, were the simulation parameters to study their influence on the temperature prediction and consequently the joining feasibility, finally the experimental C-
scanning investigation was employed comments the simulation results.
to
2. Modelling of the resistance welding process The simulated process is carried out on Glass/ polyphenylene sulfide (PPS) laminate of 2.3 mm thick where the fibre reinforcing phase consists of eight layers in plane weave form and the heating element is made of a stainless steel mesh with 0.1 mm of diameter dimension. The three dimensional resistance welding geometry configuration is similar to the one in figure 1. The dimensions are the same of that involved in the experimental program, figure 3, where two plates are welded by means an heating element in the form of metal mesh. The simulated model is made up of a lower TPC laminate as first adherent, a metal mesh as heating element, an upper TPC laminate as second adherent and, finally, a wood block that pushes on the overlapping zone to carry out an uniform pressure distribution, figure 4.
The matrix, PPS resin, thermal properties employed in this numerical model were temperature dependent as reported in the figure 5; just the thermal conductivity of the TPC laminate was instead computed by means a second numerical heat transfer transient simulation carry out on a representative portion (with resin and fibres sub domains) of the thermoplastic laminate, figure 4; this parameter was valued in the three cartesian component {kx, ky, kz}. The following equation was applied to the representative TPC subdomain:
k=
qA ∇T
(1)
where q is the heat flux vector, A is the section area trough flow the heat, ∇T the temperature gradient. The figure 6 showed that the temperature influence on k was negligible. From this result, in the numerically modelled RW process, the TPC thermal conductivity was considered constant with the temperature and equal to the previously computed average values (red and blue lines in figure 6).
Figure 4 The numerical models involved in the TPCs resistance welding simulation.
3. Thermal parameters evaluation The subdomain in the joining “interface” zone (JZ) was a combination of three phases: air,
PPS resin and metallic mesh; their evolution followed the heating of the joining area as showed in the main steps in the figure 7. Another important parameter introduced in this work to study the RW process was the
Figure 5 PPS temperature dependent parameters [10].
Figure 6 thermal conductivity versus temperature in the three coordinate directions.
temperature which the PPS strength matched the applied pressure process, T* (262°C for the PPS resin). For TT* the phases in the same zone were: air, PPS resin and metal mesh. When the temperature overcame the fusion temperature Tm (T>Tm) the present phases were PPS resin and metal mesh. The thermal properties in the JZ were evaluated as in the following general expression to account the evolution in the JZ phases:
X JZ (T ) = X MM (T ) ⋅ν MM +
+ (1 − ν MM ) ⋅ [X PPS (T ) ⋅ RA f + X AIR (T ) ⋅ (1 − RA f )] (2), where XJZ is the generic thermal property on the whole JZ , XMM is the correspondent metal mesh thermal property, XPPS is the correspondent PPS property, XAIR is the correspondent air property, νMM is the metal mesh volume fraction in the JZ and RAf is a coefficient to account the PPS resin presence in the JZ during the heating process. The last coefficient was defined to be zero when T is lower T*, equal to unity when T is higher than Tm and changeable from zero to the unit with linear dependence for T between T* and Tm. To account the latent heat during the resin heating a Differential Scanning Calorimetric (DSC) analysis was performed on a PPS sample, the figure 8 showed the heat flow with respected to the temperature; this measurements were used to insert in the numerical model an heat sink dependent from the temperature with linear law.
Figure 7 Steps evolution in the RW joining zone.
Figure 8 Heat flow in a PPS DSC analysis.
In the simulated model the convection heat transfer conditions were assumed on all the top and vertical surfaces as temperature dependent
coefficients. On the horizontal surfaces the following equation was employed to account the convection heat transfer coefficient h: 1 k (3), (Gr Pr )4 L where k is the air thermal conductivity, Gr and Pr are the Gashof and Prandtl adimensional numbers respectively while L is the dominant geometry dimension [4]. The convection heat coefficient for vertical surfaces was valuated as:
h = 0.54
h=
Nu ⋅ k L
(4),
where Nu is the Nusselt adimensional number [10].
Table 1 RW parameter processes. Simulated process Power density level RW1 RW2 RW3
5 W/cm2 6 W/cm2 8 W/cm2
4. Numerical simulation results Three simulations were performed on a transient time-dependent heat transfer numerical model, the employed parameter processes were reported in table 1 together with the simulation’s name. Only half RW experimental configuration was modelled taking advantage from its symmetry shape; all the subdomains present in the model were meshed using hexahedral quadratic elements. In figure 9 A, B and C the time-temperature profiles were reported for three points along the joining line as showed in figure 9 D at the interface upper surface.
Pressure process
Current [A]
Voltage [V]
Time [s]
Energy [kJ]
3 bar 3 bar 3 bar
15.29 17.17 19.00
8.07 8.61 10.20
140 100 80
1.73 1.48 1.55
B
A
C
D
Figure 9 Time-temperature profile for RW1 (A), RW2 (B) and RW3 (C) resistance welding simulated process for three acquisition points in D.
As can be seen the computed peak temperature was reached in the position closer to the overlapping edge where the current leakage could take place and drop toward the middle of the overlapped plates. The higher temperature prediction was obtained with a power level equal to 8 W/cm2 (RW3 simulation) though the energy supplied to the joining was lower with respect to the RW1 simulation. The reason could be explained with the existence of a power level window where the RW process give satisfying results; the figure 10 showed the time to melt for the different power density. Theoretically, low power level density means higher time to melt but the effective process could take so long time that the heat flows in the bulk of the laminate far from the interface,
Figure 10 Time to melt - power density numerically computed.
Figure 11 C-scanning images for the three experimental RW parameter process (left) and the numerical prediction for the same parameter (right).
failing the joining process or producing matrix squeeze flow in the laminate . In the other hand,
high power density could result in higher temperature at the joining interface overcoming the limit of the processing matrix temperature.
However the predicted temperature profiles in figure 9 are believed overestimate the real temperature distributions, in fact in all the simulated cases the temperature grown over the upper processing temperature T=343°C for PPS resin [11]. In fact, in figure 11 the numerical temperature distributions at the joining interface were compared with the C-scanning images; in it, with the exception of the RW3 case, no squeeze flow were showed in the C-scanning investigation against the high temperature predictions.
3
4
5
5. Conclusions 6 A numerical model to study the RW process in the TPC laminate was build up using Comsol Multiphisics user interface. The modelled geometry reproduced the experimental RW process set-up. The transient heat transfer module was employed to carry out three process simulations with different power density levels. The material thermal parameters in the model were temperature dependent; in particular to model the TPC laminates as a continuum material another numerical model was carry out to compute the equivalent thermal conductivity accounting for the matrix and the reinforcement fibre in the composite. The numerical results showed a weak temperature dependence on the TPC laminate thermal conductivity and an inverse quadratic shape dependence between the time to melt and the applied power density. A comparison between the experimental joint quality images by C-scanning investigation and the temperature distribution in the joint interface made possible verify a temperature overestimation in the numerical results.
6. References 1
2
I.Y. Chang, J.K. Lees; Recent developments in thermoplastic composites: a review of matrix system and processing methods. J. Thermoplastic Composite Materials, 1988: 277-296. M. Hou, L Ye and Y.W. Mai; resistance welding of carbon fibre fabric reinforced polyethermide (CFfabric/PEI). ICCM – 11, VI 36-45, Ed. M.L. Scott Australian Composite Structure Society, Brisbane,
7
8
9
10
11
1997. C. Ageorges, L. Ye, M. Hou. Advances in fusion bonding techniques for joining thermoplastic matrix composites: a review. Composites: Part A; 32, 2001 839-857. C. Ageorges, L. Ye, Y.W. Mai and M. Hou. Characteristics of resistance welding of lap shear coupons. Part I: Heat transfer. Composites: Part A; 29, 1998 899-909. C. Ageorges, L. Ye, M. Hou. Experimental investigation of the resistance welding for thermoplastic-matrix composites. Part I: heating element and heat transfer. Composite Science and Technology; 60, 200 1027-1039. D. M. Maguire. Joining thermoplastic composites. SAMPE Journal; 25, 1989 1114. S.M. Todd. Joining thermoplastic composites. Proceedings of the 22nd International SAMPE Technical Conference; 22, 1990 383-392. M. Dubé, P. Hubert, A. Yousefpour, J. Denault. Current leakage prevention in resistance welding of carbon fibre reinforced thermoplastics. Composites Science and Technology; 68, 2008 15791587. Ryton® PPS thermal properties datasheet, 1995 Chevron Phillips Chemical Company, LP J. H. Linhard IV, J. H. Linhard V. A heat transfer textbook. Philogiston Press, Cambridge Massachusetts 2008 ASM Handbook. Volume 21 Composite. ASM International the materials information company.