NUMERICAL MODELS AS TOOLS TO ALLOW PREDICTION OF MNR WORKING DRAFT, JUNE 2004 Tim Dekker (
[email protected], Limno-Tech Inc., Ann Arbor, Michigan, USA )
John Davis (The Dow Chemical Company, Midland, Michigan, USA )
Victor S. Magar (Battelle, Columbus, Ohio, USA)
Clayton R. Patmont (Anchor Environmental Inc, Seattle, Washington, USA)
Michael Swindoll (ExxonMobil, Annadale, New Jersey, USA)
In order for monitored natural recovery (MNR) to be considered as a viable remedial alternative at a contaminated sediment site, it is necessary to document several elements of the natural recovery process, including verifiable source control, ongoing fate and transport processes driving recovery, and a record of physical and biological data that shows a history of quantifiable improvement. A framework for applying these elements to demonstrate MNR has been developed by the Remediation Technologies Development Forum (RTDF) Sediment workgroup. A critical step in documenting the potential for MNR as a management alternative is to show that observed reductions in sediment and biological risks can reasonably be expected to continue into the future. In systems in which fate and transport processes driving recovery may be complex and changing with time, simple extrapolation of historical trends may not be appropriate. In such cases, a well-constructed numerical model can be a useful tool for predicting future behavior of the system. This paper discusses the role of numerical models in evaluating the potential for long-term MNR, as tools for: • Providing a physically-constrained system in which to integrate available data from multiple compartments of the system under investigation, • Providing an objective means by which alternate theories about the current or past behavior of the system can be tested, and • Predicting future behavior of the system being modeled. This working draft paper outlines a “weight-of-evidence” approach for evaluating the use of monitored natural recovery (MNR) for the remediation of contaminated sediments. This paper is one in a series of five papers proposing a framework, based on site-specific information, of five interrelated elements to assess the use and effectiveness of MNR. Developed by individual members of the Sediments Remediation Action Team under the Remediation Technologies Development Forum (RTDF), the papers are meant to serve as a resource to interested parties, but are not intended to be comprehensive or provide detailed information. The five working draft papers represent the views of the authors and have not been subjected to EPA peer review. Therefore, it does not necessarily reflect the views of the EPA, and no official endorsement should be inferred. The working draft papers are not a regulation, and therefore, they do not impose legally binding requirements on EPA, States, or the regulated community, and may not apply to a particular situation based upon the circumstances. Interested parties are free to raise questions and objections regarding the “weight-of-evidence” approach provided in the papers. The RTDF Sediments Remediation Action Team is seeking and welcomes public comments on the papers. The papers are working drafts and may be revised periodically without public notice. Use or mention of trade names does not constitute endorsement or recommendation for use.
Working Draft
1
June 2004
Working Draft
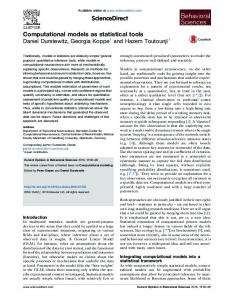
Calculation of k ey Calculation attenuation attenuat ion rates based on determ determination inat ion of process coeff coefficients icients and forecasting forecast ing from current sediment concentrat concentrations. ions.
Phenom enol ogical and Phenomenological mass ba balance lance modeling modeling of sediment bed and overlying overly i ng water column
Integrated, mechan mechanistic istic hydrodynamic, hydrodynam ic, sediment transport, contam contaminant inant fate and transport mode models ls
Increasing system complexity
Tier 1
Contaminated sediment sites are subject to many different types and degrees of contamination, are exposed to a broad range of environmental conditions, and can be found in widely varying geologic and geomorphologic environments. Contaminated sediments may be located in rivers,
Tier 2
Levels of Modeling Complexity
Empirical Emp irical trend analysis anal ys is and forecast forecasting ing of future declines dec lines iin n bioavailability b ioavail ability based on water, sed sediment, iment, and ffish ish data.
Tier 3
Ultimately, models can be used to develop a line of evidence that either supports or contradicts longterm recovery of a contaminated site. Information gathered under the other four elements of the MNR evaluation framework developed by the RTDF, including 1) source control, 2) identification of fate and transport processes driving recovery, and 3) identification of recovery trends in sediments and 4) biota, can be synthesized within a modeling framework and used to develop a single, consistent picture of the behavior of the system of interest.
Tier 4
In particular, models are often used to predict long-term reductions in exposure due to processes that operate on annual or decadal scales, as well as very short-term changes to the sediment bed that occur in response to extreme meteorological or anthropogenic events (e.g., dam removal). A model may need to incorporate the combined effects of changes in contaminant loadings, biological and chemical degradation, and natural transport and mixing processes that occur over a wide range of spatial and temporal scales. For models to be useful, applications must also be crafted so as to be as simple as possible while still being constrained by the physical processes that control the system. A modeling effort must necessarily be constrained by the resources available to the investigation, must be developed with a scope that is in proportion to the magnitude of the decisions being made, and must be designed in a way that is consistent with management questions that will be asked of it. This paper also discusses the balance between available data, project resources, and modeling effort that must exist in any sediment remediation study, and how modeling efforts can be adapted to address most sites.
Figure 1: Tiers of increasing model complexity
2
June 2004
lakes, bays and estuaries, or dam impoundments, and may be impacted by tidal or seicheing effects, high flows due to spring runoff, wind-generated waves and currents, or human activities such as dam and lock maintenance, boat traffic, or navigational dredging. Assimilating all this information typically requires a model of some form, which serves to integrate and analyze available data. Many factors contribute to the overall complexity of the system being studied, and may or may not necessitate more complex models to accurately describe system behavior. The term “model” can be used to describe a broad range of tools. Figure 1 shows one way of classifying different modeling approaches into a set of progressively more complex tiers. The first tier includes simple empirical and statistical models that are useful for detecting statistically significant trends in contaminant exposure, exploring and testing for correlation between environmental variables (e.g., river discharge, temperature, water column contaminant concentrations, etc.) and for making limited projections of future system behavior. However, it is important to recognize that such simple statistical models are inherently limited in their ability to predict the future. Such models typically are “fits” to available historical and contemporary data, and as such are unconstrained by the physics of the system being simulated. Extrapolating such a fitted model beyond just a few years risks error as the system changes and key system drivers change as well. The second tier builds on the first by using observations about trends and observed correlations, combined with process understanding, to develop a conceptual model of the system. By exploring different dependencies and drawing inferences from them, conclusions can be drawn about the behavior of the system and the likely factors driving ongoing exposure. A scientist or engineer studying a contaminated system might notice a difference in the way contaminants in carp and smallmouth bass trend over time, and link them to the differences in feeding habits of the two species and the degree to which they are linked to trends in the sediment bed. Or a researcher might notice that water column concentrations of a hydrophobic contaminant increase over a given reach of a river in a way that can’t be correlated to high flow events, and infers that pore water diffusion is a major vector by which buried contaminants are transported to the water column. By making such observations, general knowledge of the physical behavior of contaminated sediment systems is superimposed on the empirical observations of the specific site. Following this method, it may be possible to quantify pieces of what could become a more formal numerical model: process coefficients, rates, etc. Tiers 3 and 4 are then the logical extension of the first two tiers into more formal numerical models. Tier 3 modeling involves organizing the knowledge of mass of water, solids, and contaminants in different compartments of the system into a quantitative framework that measures fluxes into and out of these compartments, and rates of accumulation within them. Such “mass balance” modeling allows a researcher to draw important conclusions about the system that are very relevant to an MNR evaluation: e.g., what is the rate of accumulation of solids in the sediment bed? What is the rate of suspended solids and contaminant export downstream? To what extent does erosion of the banks contribute to the solids and contaminant mass balance?
Working Draft
3
June 2004
In some cases, the complexity of the site, the scope of decisions being made, and the specific management questions being asked necessitates a more detailed modeling evaluation, often to provide an improved understanding of some component of the system. A Tier 4 model is an extension of the Tier 3 mass balance models described above that may incorporate more detailed, fine-scale and multi-dimensional hydrodynamics, a more mechanistic description of sediment transport and sediment bed handling, and other supporting modeling evaluations such as simulation of wind-wave dynamics, wind-induced currents, and extreme event modeling (Erickson et al., 2004). The division of all model applications into a discrete set of tiers is, of course, an oversimplification of a highly complex and system-specific continuum of approaches. In reality, most modeling applications are hybrids of several different models that may include elements of several different tiers. Even the most complex “Tier 4” model may contain critical elements that are essentially Tier 1 statistical models. However, the development of a tiered structure for describing models is valuable as it establishes a vocabulary for discussing and comparing models, helping to increase the transparency of the modeling process. It is also important to recognize that progression to a higher tier of model development does not necessarily mean that a model is “better” than other models occupying a lower tier of development, or even better than the given model was at an earlier stage of development. The next section describes the relationship between model complexity, available resources, and the utility or reliability of the model.
Selection of an Appropriate Level of Modeling Complexity The selection of an appropriate level of modeling complexity will ultimately be dependent on the existing balance between available data, project resources, and the scope of decisions being made that exists in any sediment remediation study. Figure 2 illustrates a commonly observed relationship between model utility or reliability and the complexity of the models being used (DePinto et al., 2002). At a certain level of model complexity (and corresponding investment in modeling effort), there is a point of diminishing returns, after which additional investment in model complexity realizes very little in terms of improved model utility. Just short of this point, on the “knee” of the curves shown in Figure 2, is a point at which the model can be thought of as optimally designed, providing the most economical blend of utility/reliability and complexity. The two curves represent different levels of resources that might be typical of different “tiers” of modeling effort. In a resource and information-rich environment in which data for model calibration/validation are relatively abundant, it may be possible to find a higher level of model reliability and justify greater complexity and dollars spent (Point “B”). Point “B” also may represent a model that can address a more complex set of management questions than can be addressed at operating point “A”. In an atmosphere of more limited resources and data, a lower operating point (“A”) might be appropriate.
Working Draft
4
June 2004
Utility / Reliability
Optimum point for model m odel developm development ent
Substantial Resources
B B A
Limited Resources
Complexity / $$$
Figure 2: Model utility as a function of modeling effort.
The right side of the graph presented in Figure 2 is also instructive: beyond an even higher level of model complexity, additional complexity actually can begin to degrade the utility of the model. Many engineers, scientists and site managers can relate stories of a modeling effort that became so cumbersome and lacking in transparency that the model became essentially useless as a tool for decision making. Also, a model can be built that has more processes and coefficients than can be constrained with the available dataset. Such an “overspecified” model may not provide unique solutions useful for decision making.
A Well-Constrained Model Regardless of the level of modeling selected, some basic rules apply for ensuring that the model is true to the data, and is consequently able to predict future behavior with a reasonable level of certainty. A model is “well-constrained” if it meets the following criteria: 1. Sufficient knowledge of key processes and relevant rate coefficients (See previous paper on Element 2: Fate and Transport Processes). Models of contaminated sediment systems can be complex and subject to a broad array of potentially relevant processes. The well-constrained model provides a way to identify the most critical processes and quantify the most relevant parameters so that the basic functions of the system are well represented. 2. Calibration to long-term trends, and model verification (See previous papers on Elements 3 and 4). Models used to predict contaminant fate over long periods of time need to be constrained by data that spans a comparably long-term period. And if possible, calibration should be followed by an independent verification step in which the model is used to predict data external to the calibration dataset. Ideally, long-term trends in both sediments and biological receptors should be used to constrain a model. 3. An understanding of long-term stability. Prediction of long-term recovery trends requires sufficient understanding of the long-term behavior of the system to indicate that future conditions will be similar to conditions experienced during the period of model calibration. If the system of interest is subject to periodic extreme events or a shift in controlling processes that could dramatically alter long-term burial or dilution processes, then recovery trends observed during the calibration period may not be applicable in the long term. To be useful for long-term prediction, a model requires either a high degree of certainty that future disruption will not occur, or a means for the model to anticipate and account for such changes.
Working Draft
5
June 2004
4. An understanding of major sources of uncertainty. No matter how well-constrained a model is, it will still be subject to a degree of uncertainty that will increase with the length of the forecast period. An analysis of the sensitivity of the model to critical coefficients or probabilistic modeling approaches can be used to provide an estimate of the uncertainty bounds about future estimates.
Other Model Selection Criteria There are many other important criteria to consider in selecting a modeling framework or approach. While the space available for this paper does not permit a complete discussion of all of these, a short list of relevant criteria includes: • Transparency: Because models are often perceived as a “black box” of unknown algorithms, models need to be open and well-documented. This transparency applies to both the model framework and the model application itself: its input files, parameterization, and post-processing tools. • Widespread use: Also because of the “black box” perception, it is helpful when models are either well-known or based on generally acknowledged process equations and solution methods. A good “track record” of model applications helps to improve the general perception of model application. • Regulatory acceptance: In addition to the widespread use criterion described above, it is very helpful when a model is familiar to and accepted by the regulatory community. • Appropriate level of process representation: A model should generally use the simplest approach that is supported by the data (“Occam’s Razor”). Additional complexity may be added to the model as more data becomes available and project requirements justify the need. • A means for providing testable hypotheses: Mathematical/numerical models can be used to answer yes/no questions about system behavior that help to develop and test the validity of the conceptual model. Such questions can be used to guide where to go with monitoring in the future. A systematic approach for evaluating and proving cause-and-effect links is commonly attributed to Sir Bradford Hill (1966), and includes proving co-occurrence of cause and effect, specificity of cause, and the consistency and coherence of the available evidence. • A means for realistically comparing relative benefits of different alternatives. The model’s level of conceptual representation, scale, and spatial resolution should be such that the model can provide a meaningful and fair comparison of different cleanup alternatives being considered.
Model Applications While there is insufficient space to provide an extensive description of modeling efforts performed at other sites and their contributions to evaluations of MNR, some general observations can be made. At sites such as the Hudson River in New York, the Fox River in Wisconsin, the Kalamazoo River in Michigan, Bellingham Bay in Washington, and Lake Hartwell in South Carolina, models have been used to simulate many aspects of
Working Draft
6
June 2004
contaminated sediment systems relevant to decisions about remedies: river, lake, and estuary hydrodynamics, sediment transport, wind-wave and wind-current interactions, extreme events (wind and rain), contaminant fate and transport, bioaccumulation in fish and terrestrial biota, and even fish consumption patterns in humans. At all of these sites, models facilitated the process of developing a technical understanding of contaminated sites and guiding management decisions, by serving as integrators of information and powerful analytical tools. Even in cases where models were ultimately not used in final remedial decision making, they had the effect of shaping discussion, guiding data gathering efforts, and establishing boundaries for reasonable conceptual understanding of the site of interest. At all of the sites listed above, data collection and application of numerical models was generally focused on evaluating the need for and expected efficacy of more “active” remediation methods than MNR. However, by performing such evaluations, models and their supporting analyses typically identified significant portions of contaminated sites that could be amenable to an MNR approach. While MNR is often not explicitly selected as a remedial option at such sites, it typically does become a selection for portions of the site not selected for more active methods. Models can and should play a role in making direct evaluations of the suitability of MNR for these selections. In addition, the important issue of sediment stability, or vulnerability of sediment beds to extreme events, is also often critical at contaminated sediment sites. The use of models for such evaluations is described in a companion to this paper (Erickson et al., 2004).
Conclusions A framework for evaluation of monitored natural recovery at contaminated sediment sites has been developed by the Remediation Technologies Development Forum (RTDF) Sediment workgroup. The proposed framework identifies key elements of such an evaluation, including a demonstration of verifiable source control, identifying ongoing fate and transport processes driving recovery, and a developing a record of physical and biological data that shows a history of quantifiable improvement. The final element involves development of site models: conceptual, then appropriately-scaled mathematical and numerical models, to verify that identified ongoing recovery processes can be expected to continue into the future. Experience at the many contaminated sediment sites where models have been used indicates that well-conceptualized, well-constrained models with adequate supporting data can be used to support decision making, and to identify portions of sites that may be amenable to monitored natural recovery as a remedial selection.
References Bradford-Hill A -"The Environment and Disease: Association or Causation?" Proc. Royal Soc. Med. 58:295 (1966)
Working Draft
7
June 2004
DePinto, J.V., D.M. Dilks, W.M. Larson, P.L. Freedman. 2002. Guiding Principles for Modeling in TMDL Process. Proceedings of the TMDL Sciences Conference, Phoenix, AZ (November, 2002). Erickson, M., J. Davis, T. Dekker, V. Magar, C. Patmont, and M. Swindoll, 2004. Sediment Stability Assessment to Evaluate Natural Recovery as a Viable Remedy for Contaminated Sediments. Working Draft. June. http://www.rtdf.org/public/sediment/seddoc.htm.
Working Draft
8
June 2004