KNIGHT, D.J. and p.v. HOBBS. 1988. The mesoscale and microscale structure and organization of clouds and precipitations in midlatitude cy- clones. Part XV: A ...
Numerical Prédiction of an Intense Convective System Associated with thé July 1987 Montréal Flood. Part II: ATrailing Stratiform Rainband Stéphane Bélair and Da-Lin Zhang Department of Atmospheric and Oceanic Sciences McGill University, Montréal, Québec, H3A 2K6, Canada and
Jocelyn Mailhot Recherche en prévision numérique Atmospheric Environment Service Dorval, Québec, H9P 1J3, Canada
[Original manuscript received 20 September 1994; in revised form 28 December 1994]
ABSTRACT In this study, thé internai circulation structures of thé 14 July 1987 intense mesoscale convective System (MCS) are investigated using an improved high-resolution version of thé Canadian régional finite-element model. It is found that although thé MCS is characterized by a leading convective Une followed by a trailing stratiform rainband, thé associated circulation structures differ substantially from those in thé classical midlatitude squall System. Thèse include thé rapid propagation and séparation of thé leading convection from thé trailing rainband, thé development of a surface-based instead of an elevated rear-to-front descending flow and a shallow front-to-rear ascendingflow associated with thé stratiform précipitation, thé génération oflow- and mid-level rather than mid- to upper-level stratiform cloudiness and thé development ofa strong anticyclonic vorticity band at thé back edge ofthe stratiform région. It is shown that thé trailing stratiform rainband is dynamically forced by frontogenetical processes, and aided by thé release of conditional symmetric instability and local orographical lifting. The intense leading and trailing circulations resuit from latent heat released by thé convective and explicit cloud schemes, respectively. Sensitivity experiments reveal that thé proper coupling of thèse two cloud schemes is instrumental in obtaining a realistic prédiction of thé above-mentioned various mesoscale components. Vorticity budget calculations show that tilting of horizontal vorticity contributes thé most to thé amplification ofthe anticyclonic vorticity band, particularly during thé squall's incipient stage. The sensitivity of thé simulated squall System to other model physical parameters is also examined. ATMOSPHERE-OCEAN 33 (3) 1995, 475-500 0705-5900/95/0000-0475SO 1.25/0 © Canadian Meteorological and Océanographie Society
476 / Stéphane Bélair et al. RÉSUMÉ Dans cette étude, les circulations internes de l'intense système convectif mésoéchelle du 14 juillet 1987 sont examinées à l'aide d'une version améliorée et haute-résolution du modèle canadien régional aux éléments finis. On trouve que même si le système mésoéchelle est caractérisé par une ligne convective suivie d'une bande de précipitation stratiforme, la structure des circulations associées diffère substantiellement de celle typique pour les lignes de grain aux latitudes moyennes. Les différences incluent la propagation rapide de la confection à l'avant et sa séparation d'avec la bande de précipitation stratiforme à l'arrière, le développement d'une circulation descendante de l'arrière vers l'avant dans les bas niveaux au lieu de niveaux élevés et d'un courant ascendant peu profond de l'avant vers l'arrière, la génération de nuages stratiform.es dans les bas niveaux au lieu des niveaux moyens et élevés, et le développement d'une bande de tourbillon anticyclonique dans la région de précipitation stratiforme. On montre que la bande de précipitation stratiforme à l'arrière est dynamiquement forcée par des processus frontogénétiques, et est aidée par le relâchement d'instabilité symétrique conditionnelle et par un forçage orographique local. Les intenses circulations à l'avant et à l'arrière résultent du relâchement de chaleur latente par les schémas de nuages convectifs et explicites, respectivement. Des études de sensibilité révèlent qu'un couplage approprié de ces deux types de schémas de nuages est important pour obtenir une prédiction réaliste des différentes composantes mésoéchelles mentionnées plus haut. Des calculs de bilan de tourbillon montrent que la génération par l'inclinaison de tourbillon horizontal contribue pour une majeure partie à l'amplification de la bande de tourbillon anticyclonique, particulièrement pendant les stages initiaux de la ligne de grain. La sensibilité du système convectif prédit à d'autres paramètres physiques est aussi étudiée.
1 Introduction There hâve been many observational studies of mesoscale banded cloudiness and précipitation associated with extratropical cyclones (e.g., Browning and Harrold, 1969; Hobbs, 1978; Houze and Hobbs, 1982; Sanders and Bosart, 1985; Reuter and Yau, 1990; Snook, 1992) and mesoscale convective Systems (MCSs) or squall lines (Ogura and Liou, 1980; Smull and Houze, 1985; Leary and Rappaport, 1987; Johnson and Hamilton, 1988; Rutledge et al., 1988; Houze et al., 1989). In particùlar, much progress has been made during thé past two décades on thé understanding of frontal rainbands. Conditional symmetric instability (CSI) has been commonly suggested as one of thé dynamical mechanisms by which thèse rainbands are generated (Bennetts and Hoskins, 1979; Emanuel, 1979; Sun, 1984; Xu, 1986; Thorpe and Rotunno, 1989). In contrast, much less attention has been paid to thé understanding of thé banded stratiform précipitation that often occurs behind a Une of deep convection (i.e., squall Une). Like frontal rainbands, mis type of banded précipitation develops in convectively stable conditions and typically has a width of a few tens to a couple of hundreds of kilometers. However, it has been found that in some cases, thé trailing stratiform précipitation can account for as much as 40% of thé total rainfall of some MCSs (Houze, 1977; Churchill and Houze, 1984), and produce upward motion as strong as 1 m s~' (Ogura and Liou, 1980; Rutledge et al., 1988). Because of thé génération of significant précipitation, latent heating in thé trailing stratiform région tends to hâve more dominant effects on thé structure and évolution of mesoscale cir-
An Intensive Convective System. II / 477 culations than those associated with frontal rainbands. In fact, it has been observed that intense trailing stratiform precipitation is well correlated to the development of midlevel cyclonic (Leary and Rappaport, 1987; Zhang and Fritsch, 1987; 1988; Brandes, 1990; Biggerstaff and Houze, 1991a; Zhang, 1992) and anticyclonic mesovortices (Biggerstaff and Houze, 1991a; Zhang, 1992), strong sloping front-to-rear (FTR) and rear-to-front (RTF) flows (Smull and Houze, 1987; Houze et al., 1989; Zhang and Gao, 1989), surface wake lows (Johnson and Hamilton, 1988; Zhang et al., 1989), and heat bursts (Johnson et al., 1989). Although squall-line systems have been extensively investigated for many years, only a few case studies focused on the processes leading to the formation of trailing stratiform precipitation. Smull and Houze (1985) examined the water budget of a midlatitude squall line and found that most of the trailing stratiform precipitation is produced by the fallout of the rearwardly advected ice particles from the leading convective line. Based on composite high-resolution dual-Doppler radar analyses of the 10-11 June 1985 squall system, Biggerstaff and Houze (1991b) noted that the region of heavier stratiform precipitation tends to be located immediately behind the more intense convective portions of the leading line, and that the width of the stratiform precipitation is determined by a combination of the FTR wind velocity and microphysical fallout scales. Using a numerical simulation of the same case, Zhang and Cho (1992) investigated the dynamical mechanisms whereby the banded stratiform precipitation develops. They found a deep layer of negative moist potential vorticity (MPV) in the upper portion of the FTR ascending flow, indicating that the stratiform region is unstable to slantwise convection. Zhang and Cho (1992) showed that the negative MPV in this region results from upward and rearward transport of low-level convectively unstable air along the sloping FTR ascending flow after the associated potential instability is relieved in the leading convective region. In these previous studies, both the leading convective line and trailing stratiform precipitation are quite intense, so convective processes along the leading line appear to have played an important role in determining the intensity, structure and width of stratiform precipitation. However, there are significant case-to-case variabilities in the development of stratiform precipitation. In fact, for some squall systems, much less or little trailing stratiform precipitation has been observed (e.g., Carbone et al., 1990; Trier et al., 1991; Fankhauser et al., 1992). Therefore, several questions can be raised. For example, what dynamical processes could be responsible for such variabilities? What is the relative importance of the leading convection vs. the prestorm environments in the development of trailing stratiform precipitation? The main purpose of the present study is to address the above issues, using a 20-h numerical prediction of an intense squall system that caused the flooding rainfall in the vicinity of Montreal on 14 July 1987 (see Bellon et al., 1993; Tremblay, 1994; Belair et al., 1995). In Part I of this series of papers (see Belair et al., 1995), we have shown that an improved mesoscale version of the regional finite-element (RFE) model reproduces reasonably well the development and evolution of the squall
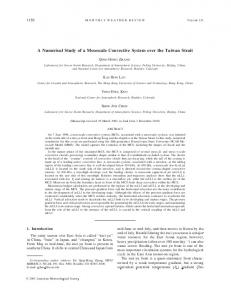
478 / Stephane Belair et al. system associated with the Montreal flood events, as verified against available observations. The model also reproduces a line of squall convection, followed by a band of stratiform precipitation, as occurred in other squall systems (e.g., Ogura and Liou, 1980; Johnson and Hamilton, 1988). However, the flow structure and development mechanisms of the squall system appear to differ from those in the previous squall-line studies. In this paper, we shall focus only on the development of the trailing stratiform rainband, since the generation of the leading squall line has been the subject of Part I. Another purpose of this study is to examine the processes leading to the development and maintenance of an intense anticyclonic vorticity band in the trailing stratiform region. 2 Precipitation band The satellite infrared imagery at 1800 UTC 14 July, given in Fig. la, shows a convective line (denoted by the letter, 'C') followed by a transition zone of low-level clouds and a band of midlevel cloudiness (denoted by the letter, 'R') that extends from western Pennsylvania to western Quebec. The leading convective line, consisting of deep and intense convective cells, has a width of about 200 km, while the width of the trailing midlevel stratiform cloud band is about 150 km. The improved RFE model (see Part I for a detailed description) reproduces reasonably well the scale and orientation of the cloud bands (see Fig. lb). Specifically, the leading convective and trailing stratiform rainfall bands, as seen from the statellite imagery, are well represented by two zones of (instantaneous) parameterized and grid-scale rainfall, respectively. This indicates that the leading line, ' C \ is mainly convective in nature whereas the trailing stratiform band, 'R', develops in a convectively stable environment. This will be further discussed in section 5. Now let us examine the sequence of evolution from the initiation of the squall convection to the formation of the trailing stratiform rainband using vertical crosssections of across-band circulations associated with the squall system (Fig. 2). Because the trailing stratiform rainband extends gradually northward, different locations of cross-sections are taken to better portray the evolution of the internal flow structures (see Fig. lb). At 10 h (Fig. 2a), i.e., shortly before the initiation of the squall line, the prestorm environment near Lakes Erie and Ontario is nearly saturated up to 400 hPa as a result of sustained large-scale ascent that occurs ahead of a midlevel baroclinic trough (see Fig. 2 in Belair et al., 1995). Subsequently, parameterized convection is triggered in the vicinity of the surface cold front and strong upward motion is induced along the leading convective line, ' C (Fig. 2b). In Part I, we have shown that this convective line moves rapidly eastward in a "phase-locked" manner with convectively-forced gravity waves. Of interest here is a zone of organized updrafts (i.e., the stratiform rainband 'R' in Fig. 2c) that begins to separate from the eastward-propagating squall line shortly after 12 h, with a transition zone between. This transition zone could be generated by the descending portion of propagating gravity waves and/or the rapid separation of the convective line from the trailing rainband. Then, the trailing updrafts tilt gradually rearward
An Intensive Convective System. II / 479
Fig. 1
la) GOES satellite infrared imagery at 1800 UTC 14 July 1987; and b) predicted hourly rainfall rates (every 1 mm h~') by implicit (solid) and explicit (dashed) cloud schemes from 18-h integration. The dashed lines in a) and the thick solid line in b) indicate the position of the trailing rainband. The letters, 'R' and ' C , show the stratiform and convective bands, respectively; similarly for the rest of figures. Lines, 'A' to 'E', indicate the locations of crosssections used in subsequent figures. The double dot-dashed lines denote the position of the predicted gust front.
480 / Stephane Belair et al.
2 Pa s-i !_ 20 m s-'
Fig. 2
Vertical cross-sections of relative humidity (every 10%), superposed with across-band flow vectors, from a) 10-h; b) 12-h; c) 14-h; d) 16-h; e) 18-h; and f) 20-h integrations. The letter at the lower-left corner refers to the location of the cross-section given in Fig. lb.
(actually northward in three dimensions) to become a shallow FTR ascending flow, with a value reaching 40 cm s"1 between 18- and 20-h integrations (see Figs. 2ef). Note a surface-based RTF descending flow that emerges beneath the FTR flow around 18 h into the integration. Unlike the 10-11 June case, this RTF flow appears to be associated with the frontal circulation that is enhanced by melting and evaporative cooling from the rainband. Note also that this FTR/RTF circulation moves eastward at a speed much slower than the leading squall line, thus lagging more and more behind with time (see Figs. 2c-f). Clearly, the evolution of these two updraft bands is governed by different dynamical mechanisms and physical processes; and the stratiform rainband could not be related to the propagation of gravity waves. As the leading convection advances much farther ahead, midlevel drier air is advected from the south in the transition zone. The squall-induced compensating subsidence
An Intensive Convective System. II / 481 also tends to dry the air in this area. As a result, a midlevel dry pocket is generated in the transition zone (see Figs. 2e-f). Moreover, the stratiform rainband can only penetrate to about 400 hPa, which is roughly consistent with the midlevel cloud top visible from the satellite imagery (cf. Figs. 1 and 2e-f). Here, it is necessary to compare the internal flow structures presented above with the conceptual model of squall lines by Houze et al. (1989). Midlatitude squall systems, like those studied by Ogura and Liou (1980), Smull and Houze (1985), Johnson and Hamilton (1988), are typically marked by an overturning updraft along the leading line, an intense FTR ascending flow transporting higher-9e air from the boundary layer ahead into the stratiform region, and an elevated RTF descending flow bringing midlevel lower-0,, air down to the boundary layer. These circulations tend to produce characteristic surface pressure perturbations, such as presquall meso-lows, meso-highs and wake lows (see Johnson and Hamilton, 1988; Zhang and Gao, 1989). It is evident from Fig. 2 that the circulation structure of the 14 July 1987 squall systems differs substantially from the above conceptual model. For example, the RTF descending flow associated with the cold front is surfacebased and relatively weak so that wake lows did not form at the rear of the system (see Belair et al., 1995). More importantly, the FTR ascending flow associated with the trailing rainband does not originate from the boundary layer ahead of the leading convective line. Thus, its energy source can only come partly from the south associated with the low-level jet ahead of the surface front (see Belair et al., 1995) and partly from what is left behind by the rapidly propagating convective line. Other circulation features that differ from the Houze et al. conceptual model include: a) the rapid separation of the leading convective line from the trailing rainband due to their different propagation speeds; and b) the nearly upright ascending flow associated with the leading squall convection due to the lack of enough accumulated cold air mass (Rotunno et al., 1988). Therefore, the dynamical forcing mechanisms and physical processes that can account for the development of the trailing stratiform rainband in the present case must be different from those discussed by Smull and Houze (1985) and Zhang and Cho (1992). These subjects will be investigated in sections 4 and 5, respectively. 3 Vorticity structure After showing the different circulations compared to the classic squall systems, it is of interest to investigate the relative vorticity structures associated with the 14 July 1987 squall system. In particular, Biggerstaff and Houze (1991a) and Zhang (1992) have shown the formation of a deep cyclonic vorticity zone along the leading line, followed by a weak anticyclonic vorticity zone and an intense midlevel mesovortex in the trailing stratiform region of the 10-11 June 1985 squall line (see their conceptual models). For this purpose, a horizontal map of relative vorticity at 600 hPa is given in Fig. 3, which shows the development of an elongated cyclonic/anticyclonic couplet of relative vorticity along the trailing stratiform rainband, 'R'. It is evident that the cyclonic vorticity zone is similar to that in the
482 / Stephane Belair et al.
— 15ms-i Fig. 3 Horizontal map of relative vorticity (every 4 x h integration. Solid (dashed) lines are for positive (negative) values. Shadings indicate regions with vertically-integrated cloud water/ice and rainwater/snow greater than 1 mm. The position of the surface cold front is also shown.
stratiform region of the 10-11 June 1985 squall system, except that it contains little curvature vorticity. However, there are two vortical elements that depart from the conceptual models: one is the development of an anticyclonic vorticity zone at the back edge of the trailing stratiform rainband and the other is the absence of deep cyclonic flow along the leading squall line. Vertical cross-sections of relative vorticity and vertical circulations, as given in Fig. 4, show the development of two cyclonic/anticyclonic vorticity couplets which are correlated, respectively, to the leading convective line and the trailing stratiform rainband. Unlike the mesovortices documented in previous squall-line studies, these two vorticity couplets move closely with the two updraft zones; there is little interaction between them due to the absence of deep FTR and RTF flows in the low to mid-troposphere. The convectively generated vorticity couplet is relatively weak and only confined below 650 hPa. This couplet intensifies and dissipates in pace with the leading convective line; it diminishes more rapidly after 18-h integration (see Figs. 4c, d). In contrast, the vorticity couplet associated with the trailing stratiform rainband is deeper, stronger and more persistent. Of importance is that the cyclonic vorticity band is always embedded in the trailing updraft zone during the life cycle of the system, rather than in a descending flow like that in the June 10-11 squall system. This vorticity band dissipates as the
An Intensive Convective System. II / 483
Fig. 4
Vertical cross-sections of relative vorticity at intervals of 4 x 10 (solid/positives, dashed/negatives), superposed with across-band flow vectors, from a) 14-h; b) 16-h; c) 18h; and d) 20-h integrations.
system weakens, in contrast to the June 10-11 mesovortex which intensifies even during the squall's dissipation stage. Again, these differences are attributable to the absence of the classic flow structures usually found in squall systems. Of particular interest is the robustness of the anticyclonic vorticity band that is located at the back edge of the stratiform rainband. This vorticity band intensifies first in an upright ascending flow (Figs. 4a, b), and then in a slantwise circulation with its center located at the interface between the FTR ascending and RTF descending flows (Figs. 4c, d). More interestingly, its intensity even increases during the decaying stage of the system (see Figs. 4c-d), and reaches —2.5 x 10~4 s"1 at 20 h; this value is more than twice the local Coriolis parameter. Thus, this anticyclonic vorticity band becomes the most significant element after 20 h into the integration. This vorticity band lasts for more than 10 hours. It has an across-band scale of 100 km, and its along-band scale is comparable to the length of the stratiform rainband. Such an anticyclonic vorticity band differs from that in the classical squall system, in which the midlevel anticyclonic vortex is relatively shorter-lived due to its interactions with the leading and wake vortices (see Zhang, 1992). So far, considerable work has been done on the understanding of the generation and maintenance of midlevel cyclonic meso-vortices within MCSs. However, much less attention has been paid to the development of midlevel anticyclonic vortices. This is because convectively generated anticyclonic vortices occur at smaller scales and
484 / Stephane Belair et al.
Fig. 5 Vertical cross-section of tilting of horizontal vorticity at intervals of 2 x 10 h ', superposed with across-band flow vectors, from 14-h integration. Solid (dashed) lines are for positive (negative) values.
tend to be transient, as compared to longer-lived cyclonic vortices. In the present case, the anticyclonic vorticity band clearly outlives its cyclonic counterpart. To examine how the midlevel vorticity couplets are generated and maintained, the Lagrangian vorticity budget is computed using the following equation: du Dt
dv
3© dv dn dp
3co 3M 3s dp
(1)
where D(C, +f)/Dt is the Lagrangian absolute vorticity tendency, C, is the relative vorticity and all the other variables assume their standard meteorological meaning. The first term on the RHS of (1) represents the stretching of the existing absolute vorticity by divergent flow, and the second term is the tilting of horizontal vorticity by nonuniform vertical motion. It is found from the vorticity budget calculation that vortex stretching is one order of magnitude smaller than tilting of horizontal vorticity in the early stages of the squall system. Thus, Fig. 5 only shows a vertical cross-section of vortical contribution due to tilting of horizontal vorticity from the 14-h integration. Given that the winds along the bands increase with height (see Fig. 7), updrafts always tend to produce vorticity tendency couplets (cyclonic on the right and anticyclonic on the left) due to the tilting, whereas downdrafts produce an opposite vorticity couplet. The small cyclonic tendency along the leading line is evidently due to the presence of weak vertical shear (see Fig. 7). This result is consistent with that in Biggerstaff and Houze (1991a) and Zhang (1992), who showed that tilting of
An Intensive Convective System. II / 485 horizontal vorticity was mainly responsible for the initial production of a vorticity couplet in the 10-11 June 1985 squall system. During the system's mature stage, i.e., at 18 h, the vortex tilting is still the main vorticity production term at the leading line, ' C (see Figs. 6a, b). However, its contribution to the Lagrangian vorticity tendencies decreases with time as the leading line moves gradually into the weaker baroclinic region ahead (see Fig. 7). By comparison, the Lagrangian vorticity tendencies in the trailing stratiform rainband increase during the period (cf. Figs. 5 and 6a), particularly for the anticyclonic component. It is evident from Figs 6a, b that tilting of horizontal vorticity still plays a dominant role in determining the intensity of the trailing vorticity couplet, but now with additional anticyclonic contribution from the RTF descending flow behind. The vorticity generation also extends to higher levels and becomes rearwardly tilted, in coincidence with the development of the slantwise circulation and vortical couplet in the trailing stratiform rainband (see Figs 2e-f). Because of the development of significant divergent flow during this mature stage, the vortex stretching also makes important contributions to the vorticity production (see Fig. 6c). Its effects are to enhance the anticyclonic vorticity in the (divergent) descending flow and the cyclonic vorticity in the lower (convergent) portion of the slantwise ascent. Furthermore, it destroys the upper (divergent) portion of cyclonic vorticity in the slantwise ascent. The net result is that the trailing anticyclonic vorticity gains an anticyclonic spin-up of 6 — 8 x 10~5 s"1 h~' in a Lagrangian sense. On the other hand, the cyclonic vorticity at its core region tends to weaken due to the offset between the tilting and stretching effects. These results are consistent with the continued growth of anticyclonic vorticity and the decay of cyclonic vorticity in the trailing stratiform rainband (see Figs 4c-d). The above budget calculations are, to a certain degree, in agreement with the findings of Zhang (1992) that the tilting of horizontal vorticity plays a dominant role during the incipient stage and the vortex stretching produces more important contributions during later stages in the development of the 10-11 June 1985 mesovortices. However, in the present case, the trailing vorticity couplet develops along a baroclinic zone, rather than in convectively generated FTR ascending and RTF descending circulations. Thus, the tilting effects are more persistent in the development of the trailing vorticity couplet, particularly for the anticyclonic vorticity band. 4 Dynamical forcing mechanisms As mentioned in the Introduction, few studies have focused on the dynamical development mechanisms of trailing stratiform precipitation. Zhang and Cho (1992) relate the generation of trailing stratiform precipitation in the June 10-11 squall case to the transport of the boundary-layer high-G^ air in the pre-storm environment. In the present case, the leading convective line almost 'shuts off the energy supply from the boundary layer ahead, as previously discussed. Thus, we must look for other dynamical mechanisms to explain the development of the present trailing
?
o 3
1I
O 3.
^1
X n
1
An Intensive Convective System. II / 487
t
20 m s-i
Fig. 7 Horizontal map of vertically-integrated cloud water/ice and rainwater/snow (solid, every 2 mm) and potential temperature at 800 hPa (dashed, every 2 K), superposed with vertical wind shear vectors between 400 and 800 hPa, from 14-h integration. The shadings indicate regions with convective precipitation rate greater than 2 mm h~'. Thick solid line, 'F', indicates the location of vertical cross-sections used in Figs 8 and 9.
stratiform rainband. In the following, we examine the possible effects of largescale baroclinicity, the leading convection, orography and CSI. The effects of large-scale baroclinic forcing can be clearly seen from the distribution of potential temperature and vertical wind shears given in Fig. 7. The convective line is initiated along the leading edge of the low-level baroclinic zone and then propagates rapidly into the warm sector having weaker vertical shears. In contrast, the trailing stratiform rainband develops in a strong baroclinic zone. Figure 8 shows the vertical structure of the squall system in relation to the baroclinic environment during the early stages of the system's development. A moist isentrope of 330 K is used to delineate approximately the frontal zone. The tilted frontal surface and the baroclinic wave trough are evident in the vicinity of the squall system (see Fig. 8a). Strong and deep cold advection occurs behind the trough axis (see Fig. 8b), which provides a favorable forcing in lifting boundarylayer air to saturation. A sounding of equivalent potential temperature, 9 e , taken near the center of the trailing rainband, reveals close to potentially neutral conditions up to 400 hPa (see Fig. 8c), which is in significant contrast to the potentially unstable stratification along the leading line (e.g., see Fig. 4 in Part I). This sounding is too stable to activate the Fritsch and Chappell (1980) (hereafter referred
488 / Stephane Belair et al.
,100 km, Fig. 8
Vertical cross-sections of a) height deviations (every 2 dam) and b) potential temperature deviations (every 1 K), superposed with across-band flow vectors, taken along a line given in Fig. 7, from a 14-h integration. Thick dashed lines represent total cloud water (ice) and rainwater (snow) content greater than 0.1 g kg^ 1 , and the thick solid line is the 8,, = 330 K surface, c) Vertical profile of 6,, taken at point, 'R'.
to as FC) convective scheme; so only the generation of grid-scale precipitation is possible. Note that such a neutral sounding favors the development of upright ascent due to the existence of little resistance in the vertical. Once latent heating occurs, the baroclinically-forced upward motion will be enhanced. Above 400 hPa, however, the presence of an inversion tends to suppress the upward penetration of the stratiform rainband. Thus, it can only develop in the low to mid-troposphere, as compared to the upper-level development of stratiform precipitation in the classical squall-line conceptual model. To further ensure that the aforementioned updraft band is generated by the largescale baroclinicity, another numerical experiment was conducted, in which both the FC and explicit moisture schemes were omitted (Exp. DRY) from the control run (Exp. CTL). Without diabatic heating, the circulations so generated should be dictated by large-scale advective processes. A comparison between Exps. CTL and DRY, as given in Figs 8b and 9, shows that the circulations and thermal structures in these two runs are similar, except that the upward motion in Exp. DRY is much weaker and more widespread than in Exp. CTL. Furthermore, there is no transition
An Intensive Convective System. II / 489
Fig. 9 As in Fig. 8b but for Exp. DRY (i.e., no latent heat release). Note the use of a different scale for vertical motion.
zone nor separation of updraft bands due to the absence of rapidly propagating gravity waves. Therefore, the large-scale baroclinic forcing at least provides a favorable environment for the development of the leading squall convection and the trailing stratiform rainband. One may note from Fig. 8a that the grid-scale precipitation during the incipient stage occurs on the windward side of a mountain range (i.e., the Appalachians), suggesting that orographically-induced circulations may have assisted the production of the stratiform rainband, 'R'. Normally, orography would tend to provide a favorable lifting on its windward side. To evaluate if the orographical effect is significant in the present case, another experiment was conducted in which the mountains were removed. Results show that the upward motion band at 'R' still develops, but it is delayed for a couple of hours (not shown). Thus, the orography in the present case assists the early generation of grid-box saturation; but it does not control the longitudinal extent of the trailing stratiform rainband since the trailing rainband extends much farther to the north of the mountainous region where the cross-section was taken. The slantwise character of the circulation along the rainband, 'R', during the later stages (see Figs 2e, f) suggests that CSI may be operative. To verify this, the dynamical variable, MPV, is computed in three dimensions:
\dQe (dw MPV = I 3 - 3 n \ds
dv 3dz
dQe
du dz
dw dn
dQe (dv 3 ~ 13
du r 5~+/
dz \ dn
ds
P
(2)
where n and .s represent the directions perpendicular and parallel to the cross-
490 / Stephane Belair et al. sectional plane, respectively. According to the two-dimensional CSI theory, a saturated region characterized by negative MPV will be subject to moist symmetric instability (Bennetts and Hoskins, 1979; Moore and Lambert, 1993); this instability is conditional when the atmosphere is subsaturated. Thus, small or negative MPV in a saturated environment will exhibit a stronger response to frontogenetic forcing, which could lead to the formation of intense mesoscale rainbands along the frontal zone (see Emanuel, 1985; Thorpe and Emanuel, 1985; Emanuel et al., 1987; Knight and Hobbs, 1988; Zhang and Cho, 1995). Figure 10 shows vertical cross-sections of MPV during the incipient (i.e., 14h) and dissipating (i.e., 20-h) stages. One can see that the convective region is characterized by positive MPV aloft and negative values below, due to the presence of potential instability in the boundary layer [i.e., in Eq. (2), dQe/dz < 0]. However, the degree of potential instability decreases toward the frontal zone even though the depth of negative MPV increases. At 'R', the vertical stratification is close to neutral during the incipient stage (see Figs 10a and 8c), and convectively stable at the later stages, as indicated by the westward tilt of moist isentropes (Figs 10a, b). Such an evolution corresponds well to the change of updraft types from nearly upright to slantwise motion near the stratiform rainband (see Figs 2b-f). A deep layer of negative MPV at 'R' indicates that the circulation associated with the stratiform rainband, though convectively neutral or stable, is unstable to slantwise convection. Note that the area and magnitude of negative MPV at the top portion of the rainband (i.e., near 400 hPa) increase with time. This is due to the northward and upward transport of negative MPV within the rainband, a mechanism similar to that discussed in Zhang and Cho (1992). Therefore, we may state that the trailing stratiform rainband in the present case develops as a consequence of the frontogenic forcing which is aided by CSI and orographical forcing. 5 Importance of different model physical processes While the dynamical forcings discussed above are crucial in providing the necessary lifting and favorable environment for the development of stratiform precipitation, much weaker vertical motion and different circulations occur when cloud condensational processes were omitted (e.g., like that in Exp. DRY). This indicates that cloud physical processes must also play an important role in determining the development of various mesoscale components of the squall system. We have shown in Fig. lb that the leading convective and trailing stratiform rainbands are produced, respectively, by the parameterized and explicit condensation schemes. Their vertical heating/cooling structures and relationships to the squall circulations can be seen from Fig. 11; namely, the parameterized and explicit schemes are well correlated with deep updrafts along the leading line and shallow and slantwise ascent in the stratiform region, respectively. Although the parameterized scheme is capable of generating grid-box saturation at the upper levels through cloud detrainment and convectively forced ascent (see Fig. lib), it
An Intensive Convective System. II / 491
Fig. 10 Vertical cross-sections of three-dimensional MPV at intervals of 2.5 x 10 7 m 2 K s ' k g ', superposed with across-band flow vectors, from a) 14-h, and b) 20-h integrations. Solid (dashed) lines are for positives (negatives) values. The thick-dashed lines indicate regions with relative humidity greater than 90%. The thick solid line denotes the position of the 330 K moist isentropic surface.
contributes little to the development of the trailing stratiform precipitation. This is in significant contrast to the June 10-11 squall system in which a large portion of the trailing stratiform precipitable water was transported from the leading convection through the FTR ascending flow (Gallus and Johnson, 1991; Biggerstaff and Houze, 1991b; Zhang and Gao, 1989; Zhang et al, 1994). Furthermore, most of the stratiform precipitation in the present case occurs in the low- to mid-troposphere, whereas for typical squall systems it often occurs in the mid- to upper-levels. There
492 / Stephane Belair et al.
Fig. 11
Vertical cross-sections of temperature tendencies generated by a) the FC convective parameterization and b) the explicit moisture scheme at intervals of 1°C h" 1 , superposed with across-band flow vectors, from 18-h integration. Solid (dashed) lines are for positive (negative) values.
are several factors that could be responsible for the different behaviours of precipitation production in the present stratiform region. These include: i) weak convective forcing including the parameterized heating and moistening along the leading line, e.g., a heating rate of 5°C h" 1 in the present case (see Fig. lla) as compared to about 10°C h" 1 in the June 10-11 case (see Fig. 3b in Zhang et al., 1994); ii) the rapid separation of the leading line from the trailing rainband so that coherent vertical circulations forced by these two heating regimes could not develop; and iii) the absence of an elevated strong RTF flow descending to the ground, or the absence of a deep cold pool such that the leading squall's circulation could never
An Intensive Convective System. II / 493
Fig. 12
As in Fig. 2e but for Exp. NOEX (no grid-scale latent heating). The thick solid line denotes the position of the 330 K moist isentropic surface.
tilt upshear during its life cycle. Because of the latter two factors, little convective available potential energy (CAPE) from the boundary layer ahead of the system could be transported into the stratiform region, as mentioned previously. To isolate the individual roles of convective parameterization and grid-scale microphysics in the development of the trailing stratiform rainband, two additional numerical experiments were conducted, in which either the grid-scale latent heating was neglected (Exp. NOEX) or the FC scheme was turned off (Exp. NOFC), while keeping all the other parameters identical to the control run. It is evident from Fig. 12 that in Exp. NOEX, the model fails to reproduce the slantwise circulation or trailing rainband near 'R', even with the favorable frontogenetical and orographical forcing. This further indicates the different roles of dynamical forcing and physical processes in the formation of the trailing rainband. The neglect of grid-scale heating does not significantly affect the structure and evolution of the leading convective line, as expected, except for the magnitude of upward motion. On the other hand, when the FC scheme was turned off (i.e., Exp. NOFC), the model reproduces well the timing and location of the stratiform rainband (Fig. 13); but it misses entirely the deep updrafts associated with the leading convective line. This also could be expected since the grid-box saturation at some distance ahead of the front could not be achieved. Of importance is that both the FTR ascending and RTF descending currents at the rainband, 'R', are much stronger than those in the control run (cf. Figs 2e and 13). This is because the higher-9e air in the boundary layer ahead can now be transported directly into the baroclinic zone and then released in the FTR ascending flow. Thus, the role of the leading convective line is to remove most of CAPE, thereby limiting the rapid development of the trailing stratiform
494 / Stephane Belair et al.
Fig. 13
As in Fig. 2e but for Exp. NOFC (no FC scheme). The thick solid line denotes the position of the 330 K moist isentropic surface.
precipitation in the baroclinic zone. The results also show the importance of the proper coupling between implicit and explicit cloud schemes in mesoscale model (see Molinari and Dudek, 1992; Zhang et al., 1988; 1994). Because of the absence of energy competition between the implicit and explicit precipitation in Exp. NOFC, the rainband circulation has been overamplified. It should be mentioned that when a simple supersaturation removal scheme was used instead of the more sophisticated explicit moisture scheme, a weaker RTF descending flow resulted, indicating that its intensity is sensitive to the melting and evaporative cooling. To test the hypothesis that the weak convective forcing accounts partly for the absence of classical squall-line circulations in the present case, the moistening and heating tendencies in the FC convective scheme are artificially doubled (Exp. 2XFC) after 14-h integration when the leading and trailing rainbands are separated (see Fig. 2c). This is equivalent to a hypothetical situation in which more CAPE, like that in the June 10-11 case, was present in the prestorm environment. It is apparent from Fig. 14 that the circulations so generated are markedly different from those in Exp. CTL. For example, much stronger updrafts (>5 Pa s - 1 ) develop at the leading line, as expected. Meanwhile, a wider and deeper layer of grid-box saturation occurs right behind the leading line, as can also be expected. However, the ascending flow tends to tilt more rearward to form a deep FTR flow, which allows the transport of high-0c air from the boundary layer ahead into the upper-level stratiform region. As the stratiform precipitation occurs, an elevated RTF flow begins to emerge as a result of the development of a strong midlevel meso-low (Smull and Houze 1987), and melting and evaporative cooling (Zhang, 1992). These flow structures look similar to those in the classical squall-line model (i.e., Houze et al., 1989), except that the RTF descending flow only takes place locally due to the lack of large-scale
An Intensive Convective System. II / 495
Fig. 14
As in Fig. 2e but for Exp. 2XFC (double heating and moistening tendencies in the FC scheme). Thick dashed lines represent total cloud water (ice) and rainwater (snow) content greater than 0.1 g kg" 1 , and the thick solid line denotes the position of the 330 K moist isentropic surface.
support (see Zhang and Gao, 1989). On the other hand, this enhanced convective forcing only slightly affects the intensity of the circulations near the frontal zone (note the different scales used in Figs 2 and 14), as compared to that in Exp. CTL. Finally, it is of interest to evaluate the model's sensitivity to the use of the Kuo (1974) convective scheme (Exp. KUO), since this scheme is currently used at the Canadian Meteorological Center (CMC) for operational forecasts. As shown in Part I, the model is still able to produce a line of convection propagating eastward, as can also be seen from Fig. 15, but in a manner different from that produced by the FC scheme. Moreover, this upward motion and the convective feedback from the Kuo scheme are unable to generate a deep saturated layer along both the leading line and frontal zone (cf. Figs. 2e and 15). Thus, the model fails to reproduce the slantwise circulation or stratiform cloudiness observed near the baroclinic zone. These differences can be attributed to the ways to achieve convective stabilization between the FC and Kuo schemes. Namely, the Kuo scheme neglects the effect of moist downdrafts and has a heating maximum typically located at a level lower than that by the FC scheme. This heating profile tends to favor the lower-level mass/moisture convergence and the development of a pressure trough or meso-low at the surface, as discussed in Belair et al. (1994, 1995). Furthermore, the "b" parameter in the Kuo scheme may be too large for an intense MCS like the present one. Hence, the mass perturbation or upward motion generated in Exp. KUO is much weaker than that in Exp. CTL. This in turn reduces the upward transport of moisture to moisten the midtroposphere. Anthes (1985) commented that the
496 / Stephane Belair et al.
Fig. 15
As in Fig. 2e but for Exp. KUO. The thick solid line denotes the position of the 330 K moist isentropic surface.
Kuo type of convective parameterization may only be appropriate in predicting the initiation of MCSs. 6 Summary and conclusions In this study, the mesoscale structures of a trailing stratiform rainband associated with the intense squall system that was responsible for the 14 July 1987 Montreal flood are investigated using 20-h predictions of the case with an improved version of the RFE model. The dynamical and physical processes that are responsible for various components of the squall system, as well as its vortical structures, are examined. The most important findings are summarized as follows. a We found that although the squall system is characterized by a leading convective line followed by a trailing stratiform rainband, the associated circulation structures differ substantially from those in the classical midlatitude squall system. These include the rapid propagation and separation of the leading convection from the trailing rainband, the development of a surface-based instead of an elevated RTF descending flow and a shallow FTR ascending flow associated with the stratiform precipitation, the generation of low- to mid-level rather than midto upper-level stratiform cloudiness and the development of a strong anticyclonic vorticity band at the back edge of the stratiform region. b Because of the above circulation structures, the trailing stratiform rainband is not fed directly by the boundary-layer high-0c air ahead. It is dynamically forced by frontogenetical processes, and aided by the release of conditional symmetric
An Intensive Convective System. II / 497 instability and local orographical lifting. The intensity of the rainband is determined by latent heat released in the frontal circulations. This finding seems to be particularly relevant to other midlatitude squall lines that develop in close proximity to cold fronts in moderate CAPE environments. c A number of sensitivity experiments have been conducted to gain insight into the development of various mesoscale components of the squall system. It is shown that the parameterized and explicit cloud schemes are responsible for the generation of the leading convective line and trailing stratiform rainband, respectively. The results further reveal the importance of an appropriate coupling of a convective parameterization and an explicit moisture scheme in obtaining the realistic prediction of an MCS. It is found that one of the roles of the leading convection is to remove most of the potentially unstable conditions, mainly through parameterized moist downdrafts, and to limit the development of the trailing stratiform precipitation. When Kuo's convective parameterization is used instead of the FC scheme, the model fails to reproduce the trailing rainband due to the lack of parameterized downdrafts and the generation of too weak mass perturbations. d We found that the internal flow structure of a squall system is very sensitive to the intensity of convective forcing along the leading line. When the convective heating and moistening tendencies in the FC scheme are doubled to simulate the presence of larger CAPE in the prestorm environment, the internal circulations of the squall system are much closer to those in the classical midlatitude squall-line model, even though the larger-scale environments differ. e Vorticity budgets have been examined to understand the development of an intense vorticity couplet in the trailing stratiform region. We found that tilting of horizontal vorticity contributes the most to the amplification of the vorticity couplet, particularly during the squall's incipient stage. Because of favorable contributions from the tilting and stretching, the anticyclonic vorticity band can still intensify during the squall's decaying stage and it becomes a dominant mesoscale circulation of the squall system. Finally, it is necessary to point out that some of the above conclusions were obtained only from one numerical case study. More case studies, especially using high-resolution observations, are needed to generalize some of the above conclusions. In particular, more attention needs to be paid to the importance of CAPE in the prestorm environment, low-level wind shear, convectively-generated cold downdrafts, elevated rear inflow jets and orography, in the generation of various internal circulation structures of midlatitude squall systems. Acknowledgments This work has been made possible through Environment Canada Contract KM 1560-9029, and a fellowship from the Natural Sciences and Engineering Research Council of Canada. The authors are very grateful to Drs. Michel Beland and Andrew
498 / Stephane Belair et al. Staniforth of Recherche en previson numerique/Atmospheric Environment Service for their continuing and generous support during the course of this project. Thanks also go to Michel Valin, Bernard Bilodeau, and Mario Lepine for their kindly assistance.
References ANTHES, R.A. 1985. Parameterization of moist convective effects on the thermodynamic and moisture fields in numerical models. ECMWF Seminar, Phys. Param. Numer. Models Atmos. 1: 121-147. BELAIR, s.; D.-L. ZHANG and J. MAILHOT. 1995. Nu-
merical prediction of an intense convective system associated with the July 1987 Montreal flood. Part I: Gravity waves and the squall line. ATMOSPHERE-OCEAN, 33 (3): 447^-73.
; and . 1994. Numerical prediction of the 10-11 June 1985 squall line with the Canadian regional finite-element model. Weather Forecasting. 9: 157-172.
clusters on 10 December 1978. J. Atmos. Sci. 41: 933-960. EMANUEL, K.A. 1979. Inertial instability and mesoscale convective systems. Part I: Linear theory of inertial instability in rotating viscous fluid. J. Atmos. Sci. 36: 2425-2449. — . 1985. Frontal circulations in the presence of small moist symmetric stability. / Atmos. Sci. 42: 1062-1071. ; M. FANTINI and A.J. THORPE. 1987. Baro-
clinic instability in an environment of small stability to slantwise moist convection. Part I: Two-dimensional models. J. Atmos. Sci. 44: 1559-1573.
BELLON, A.; M. DUNCAN a n d G.L. AUSTIN. 1 9 9 3 . A
FANKHAUSER. J.C.; G.M. BARNES a n d M.A. LEMONE.
non-isotropic gauge interpolation scheme applied to the Montreal rainstorm of 14 July 1987.
1992. Structure of a midlatitude squall line formed in strong unidirectional shear. Mon. Weather Rev. 120: 237-260.
ATMOSPHERE-OCEAN, 3 1 : 2 7 - 5 6 . BENNETTS, D.A. and B.J. HOSKINS. 1979. Conditional
symmetric instability - A possible explanation for frontal rainbands. Q. J. R. Meteorol. Soc. 105: 945-962.
FRITSCH, J.M. and C.F. CHAPPELL. Numerical predic-
tion of convectively driven mesoscale pressure systems. Part I: Convective parameterization. J. Atmos. Sci. 37: 1722-1733.
BIGGERSTAFF, M.i. and R.A. HOUZE, JR. 1991a. Mid-
GALLUS, W.A. and R.H. JOHNSON. 1991. Heat and
level vorticity structure of the 10-11 June 1985 squall line. Mon. Weather Rev. 119: 3066-3079. ; and . 1991b. Kinematics and precipitation structure of the 10-11 June 1985 squall line. Mon. Weather Rev. 119: 3034-3065. BRANDES. E.A. 1990. Evolution and structure of the 6-7 May 1985 mesoscale convective system and associated vortex. Mon. Weather Rev. 118: 109-127.
moisture budgets of an intense midlatitude squall line. J. Atmos. Sci. 48: 122-146. HOBBS, p.v. 1978. Organization and structure of clouds and precipitation on the mesoscale and microscale in cyclonic stroms. Rev. Geophys. Space Phys. 16: 741-755. HOUZE, R.A.. JR. Structure and dynamics of a tropical squall-line system. Mon. Weather Rev. 105: 1540-1567.
BROWNING, K.A. and T.w. HARROLD. 1969. Air mo-
tion and precipitation growth in a wave depression. Q. J. R. Meteorol. Soc. 95: 288-309. CARBONE, R.E.; J.W. CONWAY, N.A. CROOK a n d M.W.
MONCRIEFF. 1990. The generation and propagation of a nocturnal squall line. Part I: Observations and implications for mesoscale predictability. Mon. Weather Rev. 118: 26-49. CHURCHILL, D.D. and R.A. HOUZE, JR. 1984. Devel-
opment and structure of winter monsoon cloud
and p.v. HOBBS. 1982. Organization and
structure of precipitating cloud systems. Adv. Geophys. 24: 225-315. ; S.A. RUTLEDGE, M.I. BIGGERSTAFF a n d B.F.
SMULL. 1989. Interpretation of Doppler weather radar displays of midlatitude mesoscale convective systems. Bull. Am. Meteorol. Soc. 70: 608619. JOHNSON, R.H. and P.J. HAMILTON. 1988. The rela-
tionship of surface pressure features to the pre-
An Intensive Convective System. II / 499 cipitation and airflow structure of an intense midlatitude squall line. Mon. Weather Rev. 116: 1444-1472. ; s. CHEN and J.J. TOTH. 1989. Circulations
associated with a mature-to-decaying midlatitude mesoscale convective system. Part I: Surface features - Heat bursts and meso-low development. Mon. Weather Rev. 117: 942-959. KNIGHT, D.J. and p.v. HOBBS. 1988. The mesoscale
and microscale structure and organization of clouds and precipitations in midlatitude cyclones. Part XV: A numerical modeling study of fontogenesis and cold-frontal rainbands. J. Atmos. Sci. 45: 915-930. KUO, H.L. 1974. Further studies on the parameterization of the influence of cumulus convection on large-scale flow. J. Atmos. Sci. 31: 12321240. LEARY.C.A. and E.N. RAPPAPORT. 1987. The life cycle
and internal structure of a mesoscale convective complex. Mon. Weather Rev. 115: 1503-1527. MOLINARI, J. and M. DUDEK. 1992. Parameterization
of convective precipitation in mesoscale numerical models: A critical review. Mon. Weather Rev. 120: 326-344. MOORE. J.T. and T.E. LAMBERT. 1993. The use of
equivalent potential vorticity to diagnose regions of conditional symmetric instability. Weather Forecasting. 8: 301-308. OGURA, Y. and M.-T. LIOU. 1980. The structure of a
midlatitude squall line: A case study. J. Atmos. Sci. 37: 553-567. REUTER, G.w. and M.K. YAU. 1990. Observations of
slantwise convective instability in winter cyclones. Mon. Weather Rev. 118: 447-458. ROTUNNO, R.; J.B. KLEMP a n d M.L. WEISMAN. 1 9 8 8 .
A theory for strong, long-lived squall lines. / Atmos. Sci. 45: 463-485. RUTLEDGE, S.A.; R.A. HOUZE, JR.. M.I. BIGGERSTAFF
and T. MATEJKA. 1988. The Oklahoma-Kansas
mesoscale convective system of 10-11 June 1985: Precipitation structure and single-Doppler radar analysis. Mon. Weather Rev. 116: 14091430. SANDERS, F. and L.F. BOSART. 1985. Mesoscale struc-
ture in the megalopolitan snowstorm of 11-12 February 1983. Part I: Frontogenetical forcing and symmetric instability. /. Atmos. Sci. 42: 1050-1061. SMULL, B.F. and R.A. HOUZE. 1985. A midlatitude squall line with a trailing region of stratiform rain: Radar and satellite observations. Mon.
Weather Rev. 113, 117-133. and . 1987. Dual-Poppler radar analysis of a midlatitude squall line with a trailing region of stratiform rain. J. Atmos. Sci. 44: 2128-2148. SNOOK. JS. 1992. Current technique for real-time evaluation of conditional symmetric instability. Weather Forecasting. 7: 430-439. SUN, w.-Y. 1984. Rainbands and symmetric instability. J. Atmos. Sci. 41: 3112-3426. THORPE, A.J. and K.A.EMANUEL. 1985. Frontogenesis
in the presence of small stability to slantwise convection. J. Atmos. Sci. 42: 1809-1824. and R. ROTUNNO. 1989. Nonlinear aspects of symmetric instability. J. Atmos. Sci. 46: 1285-1299. TREMBLAY, A. 1994. Simulation of the 14 July 1987 squall using a fully compressible model. ATMOSPHERE-OCEAN, 32: 567-603. TRIER, S.B.; D.B. PARSONS a n d J.H.E. CLARK. 1 9 9 1 .
Environment and evolution of a cold-frontal mesoscale convective system. Mon. Weather Rev. 119: 2429-2455. xu, Q. 1986. Conditional symmetric instability and mesoscale rainbands. Q. J. R. Meteorol. Soc. 112: 315-334. ZHANG, D.-L. 1992. The formation of a coolinginduced mesovortex in the trailing stratiform region of a midlatitude squall line. Mon. Weather Rev. 120: 2763-2785. and J.M. FRITSCH. 1987. Numerical simulation of the meso-P scale structure and evolution of the 1977 Johnstown flood. Part II: Inertially stable warm-core vortex and the mesoscale convective complex. /. Atmos. Sci. 44: 2593-2612. and . 1988. A numerical investigation of a convectively generated, inertially stable, extratropical warm-core mesovortex over land. Part I: Structure and evolution. Mon. Weather Rev. 116: 2660-2687. ; E.-Y. HSIE and M.w. MONCRIEFF. 1988. A
comparison of explicit and implicit predictions of convective and stratiform precipitating weather systems with a meso-p"-scale numerical model. Q. J. R. Meteorol. Soc. 114: 31-60. and K. GAO. 1989. Numerical simulation of an intense squall line during 10-11 June 1985 PRE-STORM. Part II: Rear inflow, surface pressure perturbations and stratiform precipitation. Mon. Weather Rev. 117: 2067-2094. ;
and D.B. PARSONS. 1989. Numer-
ical simulation of an intense squall line during
500 / Stephane Belair et al. 10-11 June 1985 PRE-STORM. Part I: Model veridication. Mon. Weather Rev. 117: 960-994.
symmetric instability in the Eady-wave model, Tellus. 47A: 45-61.
- and H.-R. CHO. 1992. The development of
; j.s. KAIN, J.M. FRITSCH and K. GAO. 1994.
negative moist potential vorticity in the stratiform region of a simulated squall line. Mon. Weather Rev. 120: 1322-1341. and . 1995. Three-dimensional simulation of frontal rainbands and conditional
Comments on: "Parameterization of convective precipitation in mesoscale numerical models: A critical review". Mon. Weather Rev. 112: 22222231.