materials Article
Numerical Prediction of the Mechanical Failure of the Intervertebral Disc under Complex Loading Conditions Gloria Casaroli 1, *, Tomaso Villa 1,2 , Tito Bassani 2 , Nikolaus Berger-Roscher 3 , Hans-Joachim Wilke 3 and Fabio Galbusera 2 1 2 3
*
Laboratory of Biological Structure Mechanics (LaBS), Department of Chemistry, Materials and Chemical Engineering “Giulio Natta”, Politecnico di Milano, 20133 Milan, Italy;
[email protected] IRCCS Istituto Ortopedico Galeazzi, 20161 Milan, Italy;
[email protected] (T.B.);
[email protected] (F.G.) Institute of Orthopedic Research and Biomechanics, Trauma Research Center Ulm (ZTF), Ulm University, D-89081 Ulm, Germany;
[email protected] (N.B.-R.);
[email protected] (H.-J.W.) Correspondence:
[email protected]; Tel.: +39-02-2399-4317
Academic Editor: Amir A. Zadpoor Received: 31 October 2016; Accepted: 20 December 2016; Published: 3 January 2017
Abstract: Finite element modeling has been widely used to simulate the mechanical behavior of the intervertebral disc. Previous models have been generally limited to the prediction of the disc behavior under simple loading conditions, thus neglecting its response to complex loads, which may induce its failure. The aim of this study was to generate a finite element model of the ovine lumbar intervertebral disc, in which the annulus was characterized by an anisotropic hyperelastic formulation, and to use it to define which mechanical condition was unsafe for the disc. Based on published in vitro results, numerical analyses under combined flexion, lateral bending, and axial rotation with a magnitude double that of the physiological ones were performed. The simulations showed that flexion was the most unsafe load and an axial tensile stress greater than 10 MPa can cause disc failure. The numerical model here presented can be used to predict the failure of the disc under all loading conditions, which may support indications about the degree of safety of specific motions and daily activities, such as weight lifting. Keywords: finite element analysis; intervertebral disc; ovine model; herniation; annulus fibrosus; anisotropic hyperelastic
1. Introduction The mechanical causes of intervertebral disc (IVD) failures are still partially not understood. In recent decades, many research groups have studied the mechanical behavior of the intervertebral disc using different experimental set-ups and finite element models, obtaining conflicting results. Many biomechanical studies have investigated the response of the functional spinal unit under specific loading conditions, in order to understand which loads or degree of bending were responsible for the disc failure [1–3], and if the degree of degeneration was related to the risk of generating structural failures [4–6]. The early studies investigated the effect of high compressive loads in combination with axial torsion, demonstrating that high loads can cause annulus fibrosus failures or endplates junction failures (AFF and EPJF, respectively), especially when the discs were degenerated or already injured [1–3]. In recent years, combined loads and the increase of the intradiscal pressure were considered the main causes of disc failure. In particular, it has been demonstrated that flexion
Materials 2017, 10, 31; doi:10.3390/ma10010031
www.mdpi.com/journal/materials
Materials 2017, 10, 31
2 of 14
combined with axial rotation or compression led to EPJFs and AFFs, and a high nucleus pulposus pressure was unsafe for the disc [4–6]. Despite the many experimental studies presented, it is still unknown which mechanical condition is mostly responsible for the disc failure. The reason is that experimental studies are not directly comparable because of the different species and the different experimental conditions used during the experimental tests [4,7–13]. Although the human spine is the gold standard in spinal research, there are many disadvantages related to the use of humans. Firstly, they are characterized by a high degree of variability due to the different age and anatomical features of the donors, which causes some difficulties in comparing results. Moreover, human specimens are expensive and not easy to gather in high numbers. For this reason, many biomechanical studies have been performed to investigate which animal model is the most suitable for the human spine, showing that for the lumbar segment, ovine is the most adequate model of human [14–22]. Finite element analysis partly overcomes the problems related to experimental testing, and in our opinion, it is an essential tool to understand which mechanical conditions may induce disc failures. It also allows to explore where the maximum stresses and strains are located and their entity, and their dependence by the degree of degeneration [22–26]. However, finite element models mostly describe the human disc, therefore they cannot be used to investigate the experimental tests on animals [22,24–28]. To authors’ knowledge, few models of the ovine lumbar disc have been described in the literature. Schmidt and Reitmaier presented a model of the lumbar ovine disc, which had some limitations related to its anatomical characteristics and the material properties assigned [22]. Reutlinger and colleagues [29] developed an anisotropic model of the ovine lumbar disc, but it has been validated using human data and they did not perform any experimental test to investigate the mechanical failure. The aim of this study was to develop a criterion for predicting the risk of failure in complex loading conditions. A finite element model of the ovine disc with anisotropic hyperelastic properties [30] was used to perform numerical simulations conducted in a parallel in vitro study [31] on ovine lumbar segments. A statistical investigation based on the experimental and numerical outcomes was performed, leading to estimate the stress condition responsible for the failure of the tissue. 2. Materials and Methods A previously developed FE model of the ovine lumbar intervertebral disc was used for this study. Details of the model have been described elsewhere [30] and are briefly summarized here. The geometry of the model was based on the reconstruction of the endplates (EPs) of the cranial and caudal vertebrae of a L3–4 segment, from which the disc was generated using a custom Python script. The segment was supposed to be representative of the lumbar spine. The disc model was composed by the annulus fibrosus (AF), the nucleus pulposus (NP), the bony and the cartilagineous EPs (BEPs and CEPs, respectively). The anterior and posterior height of the AF was 4.5 mm and 2.5 mm, respectively. The width and the depth were 30 and 22 mm. The CEPs and the BEPs had a thickness of 0.1 and 0.5 mm. The AF was divided in the anterior, lateral and posterior regions. An anisotropic hyperelastic formulation [28] was assigned to the AF and the parameters were determined by a full factorial optimization method. The mechanical parameters of the other structures were taken from the literature (Table 1). The initial NP pressure was set to 0.2 MPa by a specific VUMAT subroutine that simulated the nucleus swelling. The mesh was composed by 56,496 hexahedral elements and 60,145 nodes. A mesh convergence analysis was performed to ensure the reliability of the model, and finally the model was validated comparing its flexibility with the data presented by Reitmaier and colleagues [15], showing a good agreement of the results [30].
Materials 2017, 10, 31
3 of 14
Table 1. Material behavior of the components of the intervertebral disc (IVD). Structure
Material Behavior
NP
Anisotropic hyperelastic Anisotropic hyperelastic Anisotropic hyperelastic Neo-Hookean
CEP BEP
Linear elastic Linear elastic
Anterior AF Lateral AF Posterior AF
C10 (MPa), D (MPa−1 )
K1 (MPa), K2 (MPa), κ
References
0.06046, 0.311
24, 1700, 0.01
[30]
0.0327, 0.6154
5, 940, 0.01
[30]
0.0772, 0.2609
1, 50, 0.01
[30]
0.16779, 0.12 E (MPa), υ 24, 0.4 1000, 0.3
-
[32]
-
[32] [32]
AF means annulus fibrosus, NP means nucleus pulposus, CEP means cartilaginous endplate, BEP means bony endplate.
The boundaries and the loading conditions applied by Berger-Roscher et al. [31] were replicated in the simulations. In the experimental study, thirty ovine lumbar segments were collected and the posterior elements were carefully removed. The cranial and the caudal vertebral bodies were embedded and five different loading scenarios applied (Table 2). Table 2. Loading scenarios investigated in the numerical simulations. Loading Scenario 1 (Case No.)
Axial Compression (800 N)
Axial Rotation (4◦ )
Lateral Bending (10◦ )
Flexion (13◦ )
1 2 3 4 5
X X X X
X X X X
X X X X
X X X X -
1
The loading scenarios corresponded to the experimental groups investigated by Berger-Roscher and colleagues [31].
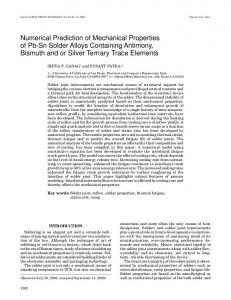
In addition, the finite element model was constrained at the caudal EP in all degrees of freedom, and an application node was defined and coupled to the superior EP, allowing the application of rotations in all directions. Five different loading scenarios were simulated in quasi-static conditions (Table 2); the loads applied replicated the conditions described in the experimental study conducted by Berger-Roscher et al. [31], which obtained AFFs and EPJFs. The loading angles were chosen to be double of the values measured by Reitmaier et al. [15] applying a moment of 3.75 Nm without the posterior elements. A compressive load of 800 N has been demonstrated to correspond to the load on the ovine IVD during regular activities (e.g., standing up and lying down) [33]. The simulations were performed in Abaqus Explicit 6.12-3 (Simulia, Dassault Systemes, Providence, RI, USA). In order to fulfill the requirement of the quasi-static conditions, it was checked that during the simulations the kinetic energy was lower than 10% of the total energy. Because the aim of the study was to investigate which state of stress was responsible for the failure of the AF and of the EP, the stresses in the circumferential, axial and radial direction, and the stress at the interface between the AF and the EPs were analyzed. In particular, three sections of the AF were defined and each section was divided in six subsections (Figure 1).
Materials Materials2017, 2017,10, 10,3131
44ofof14 14
Figure1.1.(a)(a) Section of annulus the annulus fibrosus in the which was (b) analyzed; division in Figure Section of the fibrosus in which stressthe wasstress analyzed; division(b) in subsections subsections of the sections represented in (a). of the sections represented in (a).
The stress was spatially averaged over the inner and outer, and cranial, middle and caudal AF. The stress was spatially averaged over the inner and outer, and cranial, middle and caudal AF. The stress at the interface between the AF and the EP was calculated as the ratio between the nodal The stress at the interface between the AF and the EP was calculated as the ratio between the nodal forces and the cross-sectional area. forces and the cross-sectional area. Multiple linear regression analysis was performed to investigate the role of each stress in Multiple linear regression analysis was performed to investigate the role of each stress in predicting the failure of the disc. predicting the failure of the disc. The statistical analysis for the comparison of the groups was based on a score that described the The statistical analysis for the comparison of the groups was based on a score that described damage of the disc. As described by Berger-Roscher and colleagues, small and large EPJFs were the damage of the disc. As described by Berger-Roscher and colleagues, small and large EPJFs were distinguished. Furthermore, the AFFs were distinguished in large and small. The evaluation was distinguished. Furthermore, the AFFs were distinguished in large and small. The evaluation was based on video and micro-CT and MR images of the experimental tests. A score of 0.5 was assigned based on video and micro-CT and MR images of the experimental tests. A score of 0.5 was assigned when small failures occurred, whereas 1 was assigned when large failures occurred. The score was when small failures occurred, whereas 1 was assigned when large failures occurred. The score was calculated for each specimen using the formula: calculated for each specimen using the formula: (1) ܵ ൌ ܨܬܲܧ݁݃ݎܽܮ ݈݈ܵ݉ܽ ܨܬܲܧ ܨܨܣ݁݃ݎܽܮ ݈݈ܵ݉ܽܨܨܣ S = LargeEPJF + SmallEPJF + LargeAFF + Small AFF (1) A vector containing the values of the experimental results was defined, whereas the predicted stresses werecontaining inserted inthe a matrix each row was referred a specimen andthe thepredicted statistical A vector valuesinofwhich the experimental results was to defined, whereas investigation was performed. Theinoutputs of the analysis were the thatand hadthe a significant stresses were inserted in a matrix which each row was referred to astresses specimen statistical influence in predicting the failure of the disc. investigation was performed. The outputs of the analysis were the stresses that had a significant Additional FE simulations to better understand the influence of each load in influence in predicting the failurewere of theperformed disc. generating an unsafe stress in the disc. The same applied combined in couples alone Additional FE simulations were performed toloads betterwere understand the influence of each or load in (Table 3). The average stress was calculated in the regions in which the stress resulted significant generating an unsafe stress in the disc. The same loads were applied combined in couples or alonein the previous analysisstress and compared with in thethe complex conditions. (Table 3). The average was calculated regionsloading in which the stress resulted significant in the previous analysis and compared with the complex loading conditions.
Table 3. Simple loading scenarios investigated in the numerical simulations.
Simple loading scenarios investigated in the numerical simulations. LoadingTable 3. Axial Compression Axial Rotation Lateral Bending Flexion Scenario (800 N) (4°) (10°) (13°) Axial Compression Axial Rotation Lateral Bending Flexion Loading Scenario AC + FL X (800 N) - (4◦ ) - ◦) (10 (13◦ ) X AC + AR AC + FL X X X AC + AR X AC + LB X X X FL + AR AC + LB X -X X FL + AR X X LB + AR LB + AR X X XX FL + LB X X FL + LB X X AC X AC X AR X AR X -FL X LB FL - -X X LB X -
Materials 2017, 10, 31 Materials 2017, 2017, 10, 10, 31 31 Materials
5 of 14 of 14 14 55 of
3. Results 3. Results Results 3. The numerical results were in good agreement with the experimental ones [31] and allowed The numerical numerical results results were were in in good good agreement agreement with with the the experimental ones ones [31] [31] and and allowed allowed The defining a criterion toto predict the failure ofofthe disc. A statisticalexperimental analysisallowed allowedestablishing establishing which defining a criterion predict the failure the disc. A statistical analysis which defining a criterion to predict the failure of the disc. A statistical analysis allowed establishing which stresses had anan influence ininpredicting stresses had influence predictingAF AFand andEP EPdamaging. damaging. stresses had an influence in predicting AF and EP damaging. 3.1. Complex Loads 3.1. Complex Complex Loads Loads 3.1. The numerical outcomes ofrotations rotationsininallallmain-planes main-planes (case 1 and The numerical numerical outcomesshowed showedthat that the the application application of of (case and 2) 2) The outcomes showed that the application rotations in all main-planes (case 11 and 2) generated thethe highest stress state, especially in in thethe postero-lateral and anterior regions in in thethe axial and generated highest stress state, especially postero-lateral and anterior regions axial generated the highest stress state, especially in the postero-lateral and anterior regions in the axial circumferential direction. In fact, since the AF was considered as a continuum material, in the posterior and circumferential circumferential direction. direction. In In fact, fact, since since the the AF AF was was considered considered as as aa continuum continuum material, material, in in the the and region whereregion the AF is stretched, thestretched, applied loads generated a generated tensile state in the axial direction and posterior where the AF is the applied loads a tensile state in the axial posterior region where the AF is stretched, the applied loads generated a tensile state in the axial a compressive in the circumferential one. In contrast, anterior part wherepart the where annulus direction and andstate compressive state in in the the circumferential circumferential one.in Inthe contrast, in the the anterior part where direction aa compressive state one. In contrast, in anterior was compressed, it was subject to a compressive state in the axial direction and a tensile state in the the annulus was compressed, it was subject to a compressive state in the axial direction and a tensile the annulus was compressed, it was subject to a compressive state in the axial direction and a tensile state in in the the circumferential circumferential one. circumferential one. state one. Removing the axial compression did not not change change the the stress distribution ininthe the AF, whereas it it Removing the axial compression the stress stressdistribution distributionin theAF, AF,whereas whereas Removing the axial compression did did not change it appeared lower when lateral bending or flexion was not applied (case 4 and 5, respectively). This appeared lower when lateral bending or flexion was not applied (case 4 and 5, respectively). This result appeared lower when lateral bending or flexion was not applied (case 4 and 5, respectively). This result demonstrated demonstrated that the applied applied moments had higher influence than the pure compression onthe demonstrated that thethat applied moments had ahad higher influence thanthan the the pure compression onon result the moments aa higher influence pure compression the stress state within the AF. In axial direction, the highest tensile stress was located in the inner AF stress the AF. axial direction, the the highest tensile stress was located the state stresswithin state within theIn AF. In axial direction, highest tensile stress was locatedininthe theinner innerAF AF of of postero-lateral postero-lateral part (Figure 2), whereas whereas in the circumferentialdirection direction it it was was higher ininthe the anterior postero-lateral partpart (Figure 2), whereas in in the circumferential washigher higherin the anterior of (Figure 2), the circumferential direction anterior region (Figure 3).InIn Inthe theradial radialdirection direction the the stress stress was was the the lowest, and the peak was located inin thethe region (Figure the radial direction the stress in the region (Figure 3).3). the lowest, lowest,and andthe thepeak peakwas waslocated located outer caudal region of the postero-lateral AF. The stress distribution did not appear uniform within outer caudal region thepostero-lateral postero-lateralAF. AF.The The stress stress distribution distribution did within outer caudal region ofofthe didnot notappear appearuniform uniform within the AF; AF; in in the the posterior posterior region, region, the the axial axial stress stress was was higher higher in in the the middle middle than than in in the the cranial cranial and and caudal caudal the the AF; in the posterior region, the axial stress was higher in the middle than in the cranial and caudal regions, whereas whereas in the the circumferential circumferential direction direction it was was higher higher close close to to the the EPs. regions, regions, whereas inin the circumferential direction ititwas higher close to theEPs. EPs.
Figure 2. Tensile axial fibrosusin inthe theloading loadingcases cases listed Table Figure 2. Tensile Tensile axialstress stressgenerated generatedin inthe the annulus annulus fibrosus fibrosus listed in in Table 2. 2. Figure 2. axial stress generated in the annulus in the loading cases listed in Table 2. TheThe stress is expressed in MPa. Areas with negative stresses are shown in gray. stress is is expressed expressed in in MPa. MPa. Areas Areas with with negative negative stresses stresses are shown shown in in gray. gray. The stress
Figure 3. Tensile circumferential stress generated Figure 3. Tensile Tensile circumferential stress generatedinin inthe theannulus annulusfibrosus fibrosusinin inthe theloading loadingcases caseslisted listed in Figure 3. circumferential stress generated the annulus fibrosus the loading cases listed Table 2. The stress is expressed in MPa. Areas with negative stresses are shown in gray. in Table Table 2. 2. The The stress stress is is expressed expressed in in MPa. MPa. Areas Areas with with negative negative stresses stresses are are shown shown in in gray. gray. in
Materials 2017, 10, 31
6 of 14
The statistical analysis revealed that the axial and the circumferential stresses were significant to predict the failure of the disc. Because of the non-homogeneous distribution of the stress along the AF, the stress values in three different posterior and postero-lateral regions (POST, POST-LAT1 and POST-LAT2) in which the failure experimentally occurred were calculated and averaged. The most predictive stresses were found in the caudal and in the middle part of the AF, and in the inner region (Table 4). Table 4. Significance of the state of stress in predicting the damaging of the IVD in different locations. The stress responsible for the EPJFs was calculated only for POST-LAT2 (p-values < 0.05 are marked with *). Section
Subsection
Axial
Circumferential
Radial
EP
POST
Cranial Middle Caudal Inner Outer Cranial Middle Caudal Inner Outer Cranial Middle Caudal Inner Outer
* * * * * * * * * * *
* * * * * * * * * -
* * * * -
* -
POST LAT-1
POST LAT-2
In the in vitro experiments, the highest level of damage was observed for the loading cases 1 and 2, whereas no damage was found for group 5 (Table 5). In particular, the application of high lateral bending and flexion had a strong influence in generating AFFs (loading cases 1–3) and the combination of all loads causes EPJFs. Table 5. Annulus and endplate junction failures obtained in the in vitro test. Loading Scenario (Case No.)
Large AFF
Small AFF
Large EPJF
Small EPJF
Total Score 1
1 2 3 4 5
6 4 4 1 0
0 0 1 4 0
6 3 3 1 0
0 3 0 1 0
12 8.5 7.5 4.5 0
1
The sum of the scores describing the level of damage within each experimental group is reported on the basis of macroscopic, micro-CT and MR images evaluation [31].
The statistical analysis revealed that the axial and the circumferential stress, as well as the stress at the interface between the AF and the caudal EP, were predictive of the experimental outcomes (Figures 4–6). In fact, the comparison between the experimental (Table 5) and the numerical results showed that an axial stress of 12 MPa can generate the disc failure (loading cases 1 and 2), whereas an axial stress of 4 MPa does not generate any damage (case 5) (Figure 4).
Materials 2017, 10, 31 Materials 2017, 10, 31 Materials Materials 2017, 2017, 10, 10, 31 31
7 of 14 77 of 14 7 of of 14 14
Figure 4. Average tensile axial stress generated by the loading cases listed in Table 1 in POST-LAT1 Figure 4. Average tensile axial stress generated by the loading cases cases listed listed in in Table Table 11 in POST-LAT1 Figure Average tensile axial stress generated the in section. The red and the green indicated theby thresholds identified as “high risk”1 and “low risk” Figure 4. 4. Average tensile axiallines stress generated by the loading loading cases listed in Table in POST-LAT1 POST-LAT1 section. The red and the green lines indicated the thresholds identified as “high risk” and “low risk” of section. The red and the green lines indicated the thresholds identified as “high risk” and of failure, respectively. section. The red and the green lines indicated the thresholds identified as “high risk” and “low “low risk” risk” failure, respectively. of of failure, failure, respectively. respectively.
In the circumferential direction, a stress of 10 MPa can generate the disc failure (loading In the circumferential direction, aa5stress of 10 MPa can the disc (loading direction, stress of 10 can generate disc failure (loading cases In thecircumferential circumferential direction, stress ofMPa 10not MPa can generate generate the disc failure failure (loading casesIn 1 the and 2), whereas an axial stressa of MPa does generate anythe damage (case 5) (Figure 5). 1 cases 1 and 2), whereas an axial stress of 5 MPa does not generate any damage (case 5) (Figure and 2), whereas an axial stress of 5 MPa does not generate any damage (case 5) (Figure 5). cases 1 and 2), whereas an axial stress of 5 MPa does not generate any damage (case 5) (Figure 5). 5).
Figure 5. Average tensile circumferential (Circum.) stress generated by the loading cases listed in Figure 5. Average tensile circumferential (Circum.) stress stress generated by the loading cases listed in Figure 5. Average circumferential generated the cases listed in Table section. The red and (Circum.) the green lines indicated theby thresholds identified “high Figure1 in 5. POST-LAT1 Average tensile tensile circumferential (Circum.) stress generated by the loading loading cases as listed in Table 1 in POST-LAT1 section. The red and the green lines indicated the thresholds identified as “high risk” Table 1 in POST-LAT1 section. The red and the green lines indicated the thresholds identified as “high risk” risk” of section. failure, The respectively. Tableand 1 in“low POST-LAT1 red and the green lines indicated the thresholds identified as “high and “low risk” of failure, respectively. risk” risk” and and “low “low risk” risk” of of failure, failure, respectively. respectively.
Figure 6. Average tensile stress generated by the loading cases listed in Table 1 at the interface between Figure 6. Average tensile stress generated by the loading cases listed in Table 1 at the interface the annulus and the tensile caudal endplate in the POST LAT-2 section. Thelisted red and the green lines indicated Figure Average stress generated loading cases in 11 at the interface between annulustensile and the caudal endplateby in the the POST LAT-2 red and the green lines Figure 6. 6.the Average stress generated by loading casessection. listed The in Table Table at the interface the thresholds identified as “high risk” and “low risk” of failure, respectively. between the annulus and the caudal endplate in the POST LAT-2 section. The red and the green indicated theannulus thresholds asendplate “high risk” andPOST “lowLAT-2 risk” ofsection. failure,The respectively. between the andidentified the caudal in the red and the green lines lines indicated the thresholds identified as “high risk” and “low risk” of failure, respectively. indicated the thresholds identified as “high risk” and “low risk” of failure, respectively.
Materials 2017, 10, 31 Materials Materials 2017, 2017, 10, 10, 31 31
8 of 14 88 of of 14 14
An axial stress of 10 MPa was qualitatively identified as high risk for the AF failure, whereas the An axial stress of 10 MPa was qualitatively identified as high risk for the AF failure, whereas the limitAn of axial 6 MPa wasofidentified as the thresholdidentified defining as a low In the stress 10 MPa was qualitatively highrisk riskof forfailure the AF(Figure failure,4). whereas limit of 6 MPa was identified as the threshold defining a low risk of failure (Figure 4). In the circumferential direction the thresholds lower defining (9 and 6 MPa forrisk theof high and low risk4). of failure, the limit of 6 MPa was identified as thewere threshold a low failure (Figure In the circumferential direction the thresholds were lower (9 and 6 MPa for the high and low risk of failure, respectively) (Figure 5). the By means of the numerical it was concluded stress higher circumferential direction thresholds were lower (9analysis, and 6 MPa for the high andthat lowarisk of failure, respectively) (Figure 5). By means of the numerical analysis, it was concluded that a stress higher 3.5 MPa at the(Figure interface theofAF the EP was responsible the disc damage (Figure 6). respectively) 5). between By means theand numerical analysis, it wasfor concluded that a stress higher 3.5 MPa at the interface between the AF and the EP was responsible for the disc damage (Figure 6). 3.5 MPa at the interface between the AF and the EP was responsible for the disc damage (Figure 6). 3.2. Simple Loads 3.2. Simple Loads 3.2. Simple Loads The application of flexion with other loads always generated the highest state of stress in all The application of flexion with other loads always generated the highest state of stress in all The application of flexion with other always generated highest an state of stress stresshigher in all directions. In particular, the combination ofloads flexion and axial rotationthe generated axial directions. In particular, the combination of flexion and axial rotation generated an axial stress higher directions. In particular, combination flexion and rotation generated axial stress highera than 10 MPa (Figure 7),the whereas flexionoftogether withaxial lateral bending or axialantorsion generated than 10 MPa (Figure 7), whereas flexion together with lateral bending or axial torsion generated a than 10 MPa (Figure whereas together circumferential stress 7), higher than 8flexion MPa (Figure 8).with lateral bending or axial torsion generated circumferential stress higher than 8 MPa (Figure 8). a circumferential stress higher than 8 MPa (Figure 8).
Figure 7. Axial Axial stress stress generated generated in the the POST POST section section by by combined combined loads. loads. AC AC means axial compression, Figure means axial axial compression, compression, Figure 7. 7. Axial stress generated in in the POST section by combined loads. AC means FL means flexion, AR means axial torsionrotation, LB means lateral bending. FL means flexion, AR means axial torsionrotation, LB means lateral bending. FL means flexion, AR means axial torsionrotation, LB means lateral bending.
Figure 8. Circumferential (Circum.) stress generated in the POST-LAT1 section by combined Figure 8. Circumferential (Circum.) stress generated in the POST-LAT1 section by combined loads. Figure AC 8. Circumferential (Circum.) stress generated in the by combined loads. loads. means axial compression, FL means flexion, ARPOST-LAT1 means axialsection torsionrotation, LB means AC means axial compression, FL means flexion, AR means axial torsionrotation, LB means lateral AC means axial compression, FL means flexion, AR means axial torsionrotation, LB means lateral lateral bending. bending. bending.
The The analysis analysis of of the the application application of of single single rotations rotations or or compression compression only only demonstrated demonstrated that that flexion flexion The analysis of the application of single rotations or compression only demonstrated that flexion generated generated an an axial axial stress stressup upto to77MPa MPa(Figure (Figure9) 9)and andaacircumferential circumferentialone oneup uptoto66MPa MPa(Figure (Figure10). 10). generated an axial stress up to 7 MPa (Figure 9) and a circumferential one up to 6 MPa (Figure 10).
Materials 2017, 10, 31 Materials 2017, 10, 31
9 of 14 9 of 14
9. Axial Figure 9. loads. ACAC means axial compression, FL Figure Axial stress stressgenerated generatedininthe thePOST POSTsection sectionbybypure pure loads. means axial compression, means flexion, ARAR means axial torsionrotation, LBLB means lateral bending. FL means flexion, means axial torsionrotation, means lateral bending.
Figure Figure 10. 10. Circumferential Circumferential (Circum.) (Circum.) stress stress generated generated in in the the POST POST section section by by pure pureloads. loads. AC AC means means axial compression, FL means flexion, AR means axial torsionrotation, LB means lateral bending. axial compression, FL means flexion, AR means axial torsionrotation, LB means lateral bending.
The thresholds thresholds identified identified for for the the high high and and low low risk risk of of failure failure were were qualitatively qualitatively defined defined on on the the The basis of the comparison with the experimental results. In cases 1 and 2, in which the highest total basis of the comparison with the experimental results. In cases 1 and 2, in which the highest total scores scoresreached were reached 5), the axial up to 12 MPa, casethe 4, in whichwas the were (Table 5),(Table the axial stress wasstress up to was 12 MPa, whereas in whereas case 4, in in which damage damage was localized in posterior part of the AF, the stress reached 10 MPa. When flexion was localized in posterior part of the AF, the stress reached 10 MPa. When flexion was removed (case 5), removed 5), noand failures occurred and the stress state neverFinally, reachedaxial 6 MPa. Finally, axial rotation no failures(case occurred the stress state never reached 6 MPa. rotation seemed to have to have a moderate influence of onEPJFs: the generation of EPJFs: theofinthe vitro study half of the aseemed moderate influence on the generation in the in vitro studyin half specimens presented specimens presented EPJFs and the axial stress was between 6 and 10 MPa. EPJFs and the axial stress was between 6 and 10 MPa. onlythe theEPJFs EPJFs occurrence considered, the application of all moments to be IfIf only occurrence waswas considered, the application of all moments seemed seemed to be influent. influent. fact, the groups first two groups was a high occurrence failures and a stress up In fact, inIn the firstintwo there wasthere a high occurrence of failuresofand a stress state up tostate 3 MPa. to 3 MPa. No EPJFs were generated in Group 5, in which the stress at the interface was 1 MPa, whereas No EPJFs were generated in Group 5, in which the stress at the interface was 1 MPa, whereas in in Group 3 and 4 the moderate. Group 3 and 4 the riskrisk waswas moderate. Discussion 4. Discussion 4. A element investigation investigationofofthe therisk risk failure of the intervertebral performed. A finite element ofof failure of the intervertebral discdisc waswas performed. The The analysis was conducted in parallel with an instudy vitro in study in five which five different analysis was conducted in parallel with an in vitro which different complexcomplex loading scenariosscenarios were applied to generate AFFs AFFs and EPJFs. The numerical outcomes confirmed the loading were applied to generate and EPJFs. The numerical outcomes confirmed experimental results, andand their combination allowed defining that the experimental results, their combination allowed definingthresholds thresholdsofofthe thestate state of of stress that identified the the risk risk of of generating generating failures. failures. As As well well as as the the experimental experimental tests tests demonstrated demonstrated that that the the identified combinationofofthe the loads indirections all directions generated in the postero-lateral annulus, the combination loads in all generated failuresfailures in the postero-lateral annulus, the numerical numerical simulations showed thatwas the stress was in the postero-lateral region. The numerical simulations showed that the stress highest in highest the postero-lateral region. The numerical analysis analysisthat showed that the combination all loads (case 1)the generated the highest Axial showed the combination of all loadsof (case 1) generated highest stress values.stress Axial values. compression compression didthenot increase the of probably stress in because the AF,the probably because the axial by load did not increase state of stress in state the AF, axial load was supported thewas NP. supported by the NP. In contrast, lateral bending seemed having a great influence on the axial stress, whereas axial rotation increased the circumferential one. In fact, when lateral bending was not
Materials 2017, 10, 31
10 of 14
In contrast, lateral bending seemed having a great influence on the axial stress, whereas axial rotation increased the circumferential one. In fact, when lateral bending was not applied, the positive stress in the axial direction was lower, whereas when axial rotation was not applied the positive stress was lower in the horizontal direction. The absence of flexion caused the decrease of the tensile stress state in the posterior annulus in both the axial and the circumferential directions. Flexion was considered as the main load responsible for the disc failure. Indeed, when it was combined with lateral bending or with axial rotation only, or when it was applied as a pure load, the predicted stresses were higher than the threshold values determining a high risk of failure. In contrast, the application of complex loading scenarios without flexion kept the AF in a low risk of failure, although the loads were the double of the physiological ones. The major influence of flexion was demonstrated by the fact that it generated stress up to 7 MPa by itself, whereas with the other loads the stress was lower than 4 MPa in all directions (Figure 9). In all cases, the tensile stress values were highest in the axial and in the circumferential directions, which defined the plane in which the collagen fibers lay. For the sake of simplicity, the stress distribution was analyzed only where failures experimentally occurred and not in the other regions of the AF. In the posterior and in the postero-lateral regions, the tensile stress was highest in the axial direction than in the circumferential one, whereas in the anterior region, which was in a compressive state, the stress was highest in the circumferential direction. The numerical results were compared with the experimental responses of the disc under the same loading conditions, giving a better understanding of the mechanical causes of the AF damage. Many numerical investigations [25–27,34–36] showed that the highest stresses and strains were located in the posterior and in the postero-lateral region of the AF. O’Connell et al. showed by an MRI based set-up that in the human discs the strains are the highest in the posterior region of the annulus in all loading conditions [37]. Qasim and colleagues [26,36] developed a model of the human lumbar disc to predict the damage evolution. They showed that in the healthy disc, the damage started in the posterior region of the AF, close to the inferior EP, and then progressed in the postero-lateral region. In accordance to our study, they showed that when pure loads were applied, flexion generated the highest stress state in the AF and in the EPs, identifying flexion as the main responsible for the failure, whereas axial rotation and lateral bending had a lower effect. In contrast to our model, they reported that in a complex scenario, axial compression reduced the number of cycles to failure. This difference could be due to the method that they used to describe the damage evolution, which was based on the mechanical response of the matrix and not of the collagen fibers. Schmidt et al. [25] investigated the effect of combined moments together with compression on the human lumbar disc. The study demonstrated that the collagen fibers had the highest strain in the postero-lateral region, and in general, the strain was higher when combined loads were applied. However, the authors did not simulate damage or failure. In this study, an investigation on the failure of the lumbar intervertebral disc of the sheep has been presented. It has been demonstrated that the ovine disc is a good model of the human lumbar one [20,21], and it has been adopted in many biomechanical studies [13–16,33,38–41]. Schmidt and Reitmaier [22] investigated the differences between the human and the ovine lumbar disc, concluding that despite the large geometrical differences they are adapted to produce similar internal stresses. A finite element model that can support an experimental protocol has been here presented, and it can predict the safety or the risk of failure of the disc in all loading conditions. The implementation of this study on human specimens has some issues: by an experimental point of view, the main problems are related to the large variability and to the lower bone density [21], which could cause some experimental problems as the vertebral failure. As a consequence, different material properties should be assigned to the numerical model according to the level of degeneration of the subjects. Recently, some investigation have been performed to get a subject-specific modeling of the IVD [42], but the inclusion of the anatomical, mechanical and degenerative properties of the disc into a unique model is a big issue [43]. Long and colleagues [43] have defined some design requirements for the repair
Materials 2017, 10, 31
11 of 14
hydrogels for human disc, but no information are available for the ovine one, despite it is often used in research [44–50]. This study has some limitations. First, the FE model used for this investigation did not take into account the viscoelastic and poroelastic properties of the IVD, although many FE models of the human IVD have been developed [48–54]. However, the poroelastic parameters of the ovine disc are not available and only the failure properties of the tissue were investigated, therefore a hyperelastic model was preferred. Second, the radial fibers were not included in the model. Reutlinger et al. [29] showed that in the ovine lumbar disc the inclusion of the interlamellar fibers changed the state of stress in the disc but did not affect his behavior in terms of displacements. Third, the simulation was performed on a model that was representative of a L3–4 disc, whereas the experiments included the whole lumbar spine. Because the geometrical features have a main role in the mechanical response of the IVD [22], further investigations including anatomical differences should be done. In fact, the presented model did not aim to predict the exact stress values generated within the AF: the IVD failure is a complex phenomenon that depends by biological [51–55], pathological [5,6,14,56–59] and mechanical factors [2–14,31,60–62] that cannot be included in the same numerical model. Despite this, the combination of experimental [31] and numerical results on the basis of a statistical investigation allowed identifying if a stress was predictive or not of the failure in a specific region. The conclusions were not based on a pre-defined limit of failure but on the predictivity of the stress values relative to the experimental outcomes. 5. Conclusions A numerical investigation of the state of stress generated by complex loading conditions and responsible for the failure of the AF was presented. The combination of the numerical results with a parallel in vitro study allowed understanding which stress condition was responsible for the disc failure. It was concluded that a tensile axial stress higher than 10 MPa and a positive circumferential stress higher than 8 MPa can generate the failure of the AF, and that flexion is the load that leads the disc to the most unsafe condition. The model can predict the risk of failure in every other loading condition, as well as in models of the entire motion segments or including implantable devices. Author Contributions: G.C., T.V., and F.G. conceived and designed the study; G.C. performed the numerical analyses; G.C. and F.G. analyzed the numerical results; G.C. and T.B. performed the statistical analysis; G.C. and N.B.-R. performed the experimental tests and analyzed the experimental results here reported; H.-J.W. and T.V. contributed materials and analysis tools: G.C. wrote the paper. Conflicts of Interest: The authors declare no conflict of interest.
References 1. 2. 3. 4. 5. 6.
Virgin, W.J. Experimental investigations into the physical properties of the intervertebral disc. J. Bone Jt. Surg. Br. 1951, 33, 607–611. Brown, T.; Hansen, R.J.; Yorra, A. Some mechanical tests on the lumbosacral spine with particular reference to the intervertebral discs; a preliminary report. J. Bone Jt. Surg. Am. 1957, 39, 1135–1164. [CrossRef] Adams, M.A.; Hutton, W.C. The relevance of torsion to the mechanical derangement of the lumbar spine. Spine 1981, 6, 241–248. [CrossRef] [PubMed] Hansson, T.H.; Keller, T.S.; Spengler, D.M. Mechanical Behavior of the Human Lumbar Spine II. Fatigue Strength During Dynamic Compressive Loading. J. Orthop. Res. 1987, 5, 479–487. [CrossRef] [PubMed] Tanaka, N.; An, H.S.; Lim, T.-H.; Fujiwara, A.; Jeon, C.-H.; Haughton, V.M. The relationship between disc degeneration and flexibility of the lumbar spine. Spine J. 2001, 1, 47–56. [CrossRef] Kettler, A.; Rohlmann, F.; Ring, C.; Mack, C.; Wilke, H.J. Do early stages of lumbar intervertebral disc degeneration really cause instability? Evaluation of an in vitro database. Eur. Spine J. 2011, 20, 578–584. [CrossRef] [PubMed]
Materials 2017, 10, 31
7.
8. 9.
10.
11. 12. 13.
14. 15.
16. 17. 18. 19. 20. 21. 22. 23. 24.
25.
26.
27. 28.
12 of 14
Dolan, P.; Luo, J.; Pollintine, P.; Landham, P.R.; Stefanakis, M.; Adams, M.A. Intervertebral disc decompression following endplate damage: Implications for disc degeneration depend on spinal level and age. Spine 2013, 38, 1473–1481. [CrossRef] [PubMed] Callaghan, J.P.; Mcgill, S.M. Intervertebral disc herniation: Studies on a porcine model exposed to highly repetitive flexion/extension motion with compressive force. Clin. Biomech. 2001, 16, 28–37. [CrossRef] Aultman, C.D.; Scannell, J.; McGill, S.M. The direction of progressive herniation in porcine spine motion segments is influenced by the orientation of the bending axis. Clin. Biomech. 2005, 20, 126–129. [CrossRef] [PubMed] Veres, S.P.; Robertson, P.A.; Broom, N.D. ISSLS prize winner: Microstructure and mechanical disruption of the lumbar disc annulus: Part II: How the annulus fails under hydrostatic pressure. Spine 2008, 33, 2711–2720. [CrossRef] [PubMed] Brown, S.H.M.; Gregory, D.E.; McGill, S.M. Vertebral end-plate fractures as a result of high rate pressure loading in the nucleus of the young adult porcine spine. J. Biomech. 2008, 41, 122–127. [CrossRef] [PubMed] Meakin, J.R.; Hukins, D.W.L. Effect of removing the nucleus pulposus on the deformation of the annulus fibrosus during compression of the intervertebral disc. J. Biomech. 2000, 33, 575–580. [CrossRef] Fazzalari, N.L.; Costi, J.J.; Hons, B.E.; Hearn, T.C.; Fraser, R.D.; Vernon-roberts, B.; Hutchinson, J.; Manthey, B.A.; Parkinson, I.H.; Sinclair, C. Mechanical and pathologic consequences of induced concentric anular tears in an ovine model. Spine 2001, 26, 2575–2581. [CrossRef] [PubMed] Thompson, R.E.; Pearcy, M.J.; Barker, T.M. The mechanical effects of intervertebral disc lesions. Clin. Biomech. 2004, 19, 448–455. [CrossRef] [PubMed] Reitmaier, S.; Volkheimer, D.; Berger-roscher, N.; Wilke, H.; Reitmaier, S.; Volkheimer, D. Increase or decrease in stability after nucleotomy? Conflicting in vitro and in vivo results in the sheep model. J. R. Soc. Interface 2014, 11. [CrossRef] [PubMed] Wade, K.R.; Robertson, P.A.; Broom, N.D. Influence of maturity on nucleus-endplate integration in the ovine lumbar spine. Eur. Spine J. 2014, 23, 732–744. [CrossRef] [PubMed] Wilke, H.-J.; Geppert, J.; Kienle, A. Biomechanical in vitro evaluation of the complete porcine spine in comparison with data of the human spine. Eur. Spine J. 2011, 20, 1859–1868. [CrossRef] [PubMed] Wilke, H.J.; Krischak, S.; Claes, L. Biomechanical comparison of calf and human spines. J. Orthop. Res. 1996, 14, 500–503. [CrossRef] [PubMed] Kettler, A.; Liakos, L.; Haegele, B.; Wilke, H.J. Are the spines of calf, pig and sheep suitable models for pre-clinical implant tests? Eur. Spine J. 2007, 16, 2186–2192. [CrossRef] [PubMed] Wilke, H.-J.; Kettler, A.; Claes, L. Are Sheep Spines a Valid Biomechanical Model for Human Spines? Spine 1997, 22, 2365–2374. [CrossRef] [PubMed] Wilke, H.J.; Kettler, A.; Wenger, K.H.; Claes, L.E. Anatomy of the sheep spine and its comparison to the human spine. Anat. Rec. 1997, 247, 542–555. [CrossRef] Schmidt, H.; Reitmaier, S. Is the ovine intervertebral disc a small human one? A finite element model study. J. Mech. Behav. Biomed. Mater. 2013, 17, 229–241. [CrossRef] [PubMed] Holzapfel, G.A.; Schulze-Bauer, C.A.J.; Feigl, G.; Regitnig, P. Single lamellar mechanics of the human lumbar anulus fibrosus. Biomech. Model. Mechanobiol. 2005, 3, 125–140. [CrossRef] [PubMed] Skaggs, D.L.; Weidenbaum, M.; Iatridis, J.C.; Ratcliffe, A.; Mow, V.C. Regional variation in tensile properties and biochemical composition of the human lumbar anulus fibrosus. Spine 1994, 19, 1310–1319. [CrossRef] [PubMed] Schmidt, H.; Kettler, A.; Rohlmann, A.; Claes, L.; Wilke, H.-J. The risk of disc prolapses with complex loading in different degrees of disc degeneration—A finite element analysis. Clin. Biomech. 2007, 22, 988–998. [CrossRef] [PubMed] Qasim, M.; Natarajan, R.N.; An, H.S.; Andersson, G.B.J. Damage accumulation location under cyclic loading in the lumbar disc shifts from inner annulus lamellae to peripheral annulus with increasing disc degeneration. J. Biomech. 2014, 47, 24–31. [CrossRef] [PubMed] Little, J.P.; Adam, C.J.; Evans, J.H.; Pettet, G.J.; Pearcy, M.J. Nonlinear finite element analysis of anular lesions in the L4/5 intervertebral disc. J. Biomech. 2007, 40, 2744–2751. [CrossRef] [PubMed] Eberlein, R.; Holzapfel, G.A.; Schulze-Bauer, C.A.J. An Anisotropic Model for Annulus Tissue and Enhanced Finite Element Analyses of Intact Lumbar Disc Bodies. Comput. Methods. Biomech. Biomed. Eng. 2001, 4, 209–229. [CrossRef]
Materials 2017, 10, 31
29.
30.
31. 32.
33.
34.
35. 36.
37.
38.
39. 40. 41. 42.
43.
44. 45.
46.
47.
13 of 14
Reutlinger, C.; Bürki, A.; Brandejsky, V.; Ebert, L.; Büchler, P. Specimen specific parameter identification of ovine lumbar intervertebral discs: On the influence of fibre-matrix and fibre-fibre shear interactions. J. Mech. Behav. Biomed. Mater. 2014, 30, 279–289. [CrossRef] [PubMed] Casaroli, G.; Galbusera, F.; Jonas, R.; Schlager, B.; Wilke, H.-J.; Villa, T. A Novel Finite Element Model of the Ovine Lumbar Intervertebral Disc with Anisotropic Hyperelastic Material Properties. PLoS ONE 2016, submitted. Berger-Roscher, N.; Casaroli, G.; Rasche, V.; Villa, T.; Galbusera, F.; Wilke, H.-J. Influence of Complex Loaing Conditons on Intervertebral Disc Failure. Spine 2016, 27187053. Ayturk, U.M.; Gadomski, B.; Schuldt, D.; Patel, V.; Puttlitz, C.M. Modeling degenerative disk disease in the lumbar spine: A combined experimental, constitutive, and computational approach. J. Biomech. Eng. 2012, 134, 101003. [CrossRef] [PubMed] Reitmaier, S.; Schmidt, H.; Ihler, R.; Kocak, T.; Graf, N.; Ignatius, A.; Wilke, H.J. Preliminary investigations on intradiscal pressures during daily activities: An in vivo study using the merino sheep. PLoS ONE 2013, 8, e69610. [CrossRef] [PubMed] Schmidt, H.; Heuer, F.; Drumm, J.; Klezl, Z.; Claes, L.; Wilke, H.J. Application of a calibration method provides more realistic results for a finite element model of a lumbar spinal segment. Clin. Biomech. 2007, 22, 377–384. [CrossRef] [PubMed] Shirazi-Adl, A.; Drouin, G. Load-bearing role of facets in a lumbar segment under sagittal plane loadings. J. Biomech. 1987, 20, 601–613. [CrossRef] Qasim, M.; Natarajan, R.N.; An, H.S.; Andersson, G.B.J. Initiation and progression of mechanical damage in the intervertebral disc under cyclic loading using continuum damage mechanics methodology: A finite element study. J. Biomech. 2012, 45, 1934–1940. [CrossRef] [PubMed] O’Connell, G.D.; Vresilovic, E.J.; Elliott, D.M. Human intervertebral disc internal strain in compression: The effect of disc region, loading position, and degeneration. J. Orthop. Res. 2011, 29, 547–555. [CrossRef] [PubMed] Little, J.P.; Pearcy, M.J.; Tevelen, G.; Evans, J.H.; Pettet, G.; Adam, C.J. The mechanical response of the ovine lumbar anulus fibrosus to uniaxial, biaxial and shear loads. J. Mech. Behav. Biomed. Mater. 2010, 3, 146–157. [CrossRef] [PubMed] Wade, K.R.; Robertson, P.A.; Broom, N.D. On how nucleus-endplate integration is achieved at the fibrillar level in the ovine lumbar disc. J. Anat. 2012, 221, 39–46. [CrossRef] [PubMed] Reitmaier, S.; Shirazi-Adl, A.; Bashkuev, M.; Wilke, H.-J.; Gloria, A.; Schmidt, H. In vitro and in silico investigations of disc nucleus replacement. J. R. Soc. Interface 2012, 9, 1869–1879. [CrossRef] [PubMed] Osti, O.L.; Vernon-Roberts, B.; Fraser, R.D. Anulus Tears and Intervertebral Disc Degeneration. An experimental Study Using an Animal Model. Spine 1990, 15, 762–767. [PubMed] Marini, G.; Studer, H.; Huber, G.; Püschel, K.; Ferguson, S.J. Geometrical aspects of patient-specific modelling of the intervertebral disc: Collagen fibre orientation and residual stress distribution. Biomech. Model Mechanobiol. 2016, 15, 543–560. [CrossRef] [PubMed] Long, R.G.; Torre, O.M.; Hom, W.W.; Assael, D.J.; Iatridis, J.C. Design requirements for annulus fibrosus repair: Review of forces, displacements and material properties of the intervertebral disc and a summary of candidate hydrogels for repair. J. Biomech. Eng. 2016, 138, 26720265. [CrossRef] [PubMed] Melrose, J.; Bone, R.P. Assessment of the cellular heterogeneity of the ovine intervertebral disc: Comparison with synovial fibroblasts and articular chondrocytes. Eur. Spine J. 2003, 12, 57–65. [PubMed] Hegewald, A.A.; Medved, F.; Feng, D.; Tsagogiorgas, C.; Beierfuß, A.; Schindler, G.A.; Trunk, M.; Kaps, C.; Mern, D.S.; Thomé, C. Enhancing tissue repair in annulus fibrosus defects of the intervertebral disc: Analysis of a bio-integrative annulus implant in an in vivo ovine model. J. Tissue Eng. Regen. Med. 2015, 9, 405–414. [CrossRef] [PubMed] Woiciechowsky, C.; Abbushi, A.; Zenclussen, M.L.; Casalis, P.; Krüger, J.P.; Freymann, U.; Michaela, E.; Christian, K. Regeneration of nucleus pulposus tissue in an ovine intervertebral disc degeneration model by cell-free resorbable polymer scaffolds. J. Tissue Eng. Regen. Med. 2014, 8, 811–820. [CrossRef] [PubMed] Barthelemy, V.M.P.; Van Rijsbergen, M.M.; Wilson, W.; Huyghe, J.M.; Van Rietbergen, B.; Ito, K. A computational spinal motion segment model incorporating a matrix composition-based model of the intervertebral disc. J. Mech. Behav. Biomed. Mater. 2016, 54, 194–204. [CrossRef] [PubMed]
Materials 2017, 10, 31
48.
49.
50.
51. 52. 53.
54.
55. 56.
57.
58. 59.
60. 61.
62.
14 of 14
Vadalà, G.; Russo, F.; Pattappa, G.; Peroglio, M.; Stadelmann, V.A.; Roughley, P.; Grad, S.; Alini, M.; Denaro, V. A Nucleotomy Model with Intact Annulus Fibrosus to Test Intervertebral Disc Regeneration Strategies. Tissue Eng. C Methods 2015, 21, 1117–1124. [CrossRef] [PubMed] Galbusera, F.; Schmidt, H.; Neidlinger-Wilke, C.; Gottschalk, A.; Wilke, H.-J. The mechanical response of the lumbar spine to different combinations of disc degenerative changes investigated using randomized poroelastic finite element models. Eur. Spine J. 2011, 20, 563–571. [CrossRef] [PubMed] Schmidt, H.; Galbusera, F.; Rohlmann, A.; Shirazi-Adl, A. What have we learned from finite element model studies of lumbar intervertebral discs in the past four decades? J. Biomech. 2013, 46, 2342–2355. [CrossRef] [PubMed] Castro, A.P.G.; Wilson, W.; Huyghe, J.M.; Ito, K.; Alves, J.L. Intervertebral disc creep behavior assessment through an open source finite element solver. J. Biomech. 2014, 47, 297–301. [CrossRef] [PubMed] Schroeder, Y.; Huyghe, J.M.; Van Donkelaar, C.C.; Ito, K. A biochemical/biophysical 3D FE intervertebral disc model. Biomech. Model. Mechanobiol. 2010, 9, 641–650. [CrossRef] [PubMed] Castro, A.P.G.; Paul, C.P.L.; Detiger, S.E.L.; Smit, T.H.; Van Royen, B.J.; Pimenta Claro, J.C.; Mullender, M.G.; Alves, J.L. Long-Term Creep Behavior of the Intervertebral Disk: Comparison between Bioreactor Data and Numerical Results. Front. Bioeng. Biotechnol. 2014, 2, 56. [CrossRef] [PubMed] Malandrino, A.; Jackson, A.R.; Huyghe, J.M.; Noailly, J. Poroelastic modeling of the intervertebral disc: A path toward integrated studies of tissue biophysics and organ degeneration. MRS Bull. 2015, 40, 324–332. [CrossRef] Reid, J.E.; Meakin, J.R.; Robins, S.P.; Skakle, J.M.S.; Hukins, D.W.L. Sheep lumbar intervertebral discs as models for human discs. Clin. Biomech. 2002, 17, 312–314. [CrossRef] Melrose, J.; Smith, S.M.; Little, C.B.; Moore, R.J.; Vernon-Roberts, B.; Fraser, R.D. Recent advances in annular pathobiology provide insights into rim-lesion mediated intervertebral disc degeneration and potential new approaches to annular repair strategies. Eur. Spine J. 2008, 17, 1131–1148. [CrossRef] [PubMed] Cegoñino, J.; Moramarco, V.; Pappalettere, C.; Palomar, A.P. A Constitutive Model for the Annulus of Human Intervertebral Disc: Implications for Developing a Degeneration Model and Its Influence on Lumbar Spine Functioning. J. Appl. Math. 2014, 2014, 658719. [CrossRef] Inoue, N.; Espinoza, O.A.A. Biomechanics of intervertebral disk degeneration. Orthop. Clin. N. Am. 2011, 42, 487–499. [CrossRef] [PubMed] Gooyers, C.E.; McMillan, E.M.; Noguchi, M.; Quadrilatero, J.; Callaghan, J.P. Characterizing the combined effects of force, repetition and posture on injury pathways and micro-structural damage in isolated functional spinal units from sub-acute-failure magnitudes of cyclic compressive loading. Clin. Biomech. 2015, 30, 953–959. [CrossRef] [PubMed] Yates, J.P.; Mcgill, S.M. The Effect of Vibration and Posture on the Progression of Intervertebral Disc Herniation. Spine 2011, 36, 386–392. [CrossRef] [PubMed] Schmidt, H.; Bashkuev, M.; Dreischarf, M.; Rohlmann, A.; Duda, G.; Wilke, H.J.; Shirazi-Adl, A. Computational biomechanics of a lumbar motion segment in pure and combined shear loads. J. Biomech. 2013, 46, 2513–2521. [CrossRef] [PubMed] Drake, J.D.M.; Aultman, C.D.; McGill, S.M.; Callaghan, J.P. The influence of static axial torque in combined loading on intervertebral joint failure mechanics using a porcine model. Clin. Biomech. 2005, 20, 1038–1045. [CrossRef] [PubMed] © 2017 by the authors; licensee MDPI, Basel, Switzerland. This article is an open access article distributed under the terms and conditions of the Creative Commons Attribution (CC-BY) license (http://creativecommons.org/licenses/by/4.0/).