IAHR 24th Symposium on Hydraulic Machinery and Systems OCTOBER 27-31, FOZ DO IGUASSU RESERVED TO IAHR
NUMERICAL SIMULATION AND EXPERIMENTAL INVESTIGATION OF THE FLOW IN AN AXIAL TURBINE J.-M. Gagnon, C. Deschênes, G.D. Ciocan, M. Iliescu LAMH, 1065, avenue de la médecine, Québec, Canada, G1V 0A6, Canada (418) 656-2131 -
[email protected]
ABSTRACT In this paper, a numerical simulation of the flow in a complete model of an axial turbine is performed to investigate circumferential non-uniformities in the distributor and at stay vanes inlet. This phenomenon is of prime importance since it is directly related to torque and power fluctuations of the runner output. Simulations involving a distributor section of the hydraulic machine cannot assess the non-uniformities that mainly take place in the admission channel and spiral casing. Therefore, the admission, distributor and draft tube sections of the model axial turbine are meshed and combined via general grid interfaces for complete machine simulations. Design and off-design operating conditions are simulated with a standard k-epsilon turbulence model and stationary RANS equations. Circumferential non-uniformities of the flow field and effect on stay vanes are investigated for the different operating regimes. Analyses for the conical diffuser are done for sections that have been measured experimentally and where information on the flow field is available. Then, simulations are compared for the different cross sections against experimental results. 3-D PIV and 2-D LDV investigations give insight on the accuracy of the numerical simulations of the flow fields. It is shown that the region near the admission pile has a different velocity distribution than the region away from the pile in the semispiral casing. This indicates non-uniformity at the distributor inlet that may propagate downstream in the runner. Further investigation with 2-D LDV and simulated cases at the runner outlet shows that the vortex rope is playing an important role in the flow rates for different quadrants of the machine. This study took place within the Consortium on Hydraulic Machines held at the Hydraulic Machinery Laboratory of Laval University. KEY WORDS: axial turbine, circumferential non-uniformities, stereo PIV, 2-D LDV, velocity profile, cone, draft tube.
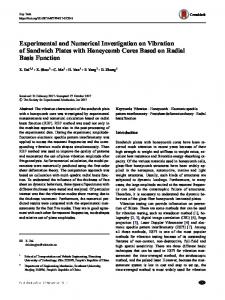
INTRODUCTION It is not obvious to determine whether circumferential non-uniformities of the flow at the cone outlet section originate from the spiral casing or from the draft tube pile of a hydraulic machine. There is a strong acceleration of the flow in the distributor and runner that acts as a mixing device enforcing diffusion and stretching of velocity gradients. Furthermore, laser measurements such as PIV or LDV after the guide vanes and at the runner inlet section are not an easy task to perform because of visual obstruction from the stay vanes, guide vanes and upper distributor that limit optical access. Numerical simulation of the flow is an interesting way to investigate azimuthal non-uniformity phenomena. However, some practical considerations must be taken, in order to prevent a time consuming experience that would give no results on non-uniformities. First, complete machine simulations are necessary to initiate the non-uniformities in the spiral casing and at the outlet of the runner since the admission and the draft tube channel are the main actors of the phenomena [1]. Second, grid and interface should be carefully built and placed to avoid the dampening effect brought on by non-conformal mesh at mating surfaces and accelerating flow [2, 3]. This paper presents a methodology that combines numerical simulations and experimental measurements to study flow phenomena in an axial hydraulic turbine. 2-D LDV and 3-D PIV measurements are presented for two operating points and compared with stationary numerical simulations. METHODOLOGY 2-D LDV AND 3-D PIV MEASUREMENTS 2-D LDV and stereo PIV measurements are done in the conical diffuser of the hydraulic machine and illustrated in Fig. 1 below.
Figure 1. LDV measurement setup (left) and stereo PIV setup (right) at the runner outlet section of the axial hydraulic machine model.
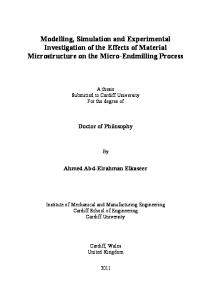
Details of measurement techniques can be found in [4]. In this paper, further azimuthal positions were studied with 2-D LDV to assess circumferential nonuniformities of the flow at the runner outlet. Fig. 2 shows the global coordinates system 24th Symposium on Hydraulic Machinery and Systems
2
with investigated axes. Axis 5a, 5b and 5c correspond to three vertical optical accesses. These accesses were then rotated with the cone to allow measurements at different circumferential positions as illustrated on the right of the figure. Obstruction from the lower distributor casing limits measurements to Axis 5b and 5c for circumferential positions 1 and 3.
Admission
Oz
Circumferential positions Distributor
2
3
Zref
Ox
1
Ox
O Cone
Axis 5a Axis 5b Axis 5c
Draft tube
Cone 7.5° 2D-LDV Probe
Oy 60° 60°
Figure 2. Global coordinates system and axis vertical and circumferential positions.
Stereo PIV measurements are made for a plane at the runner outlet that is orthogonal to circumferential position 2 of LDV measurements. NUMERICAL SIMULATIONS The commercial solver ANSYS CFX was run on parallel processors for all simulations. In Fig. 3, the hydraulic machine geometry and mesh are split into four domains: the admission channel including 24 stay vanes (1), the distributor (2), the runner (3) and the draft tube (4). 1
2 3
Interface
4
Figure 3. - Left. Domains definition. – Right. Tetra and o-grid meshes around stay vanes, spiral tongue and guide vanes with the interface limit (dashed line).
A total of 3,700,000 elements are needed to respect a good aspect ratio in near wall elements. This is important to ensure good accuracy when switching from wall laws to 24th Symposium on Hydraulic Machinery and Systems
3
the k-epsilon turbulence model. Tetra meshing is used in the admission domain whereas block structured meshes and an o-grid are used in the other domains. Boundary conditions are a steady flow rate at the inlet and zero average static pressure at the draft tube outlet. Grid interfaces are needed to connect meshes from adjacent domains. For steady simulations, it is possible to use a standard grid interface or a circumferential averaging grid interface that allows for connecting domains with different mating areas. Both types of interfaces are used for the runner. In the circumferential averaging case, a section presenting a single blade (out of 6 for the runner) is used to limit the runner mesh size. A total of four simulations were done to compare two operating points and two interface types with LDV and PIV measurements. The chosen turbine regimes were optimum and overload conditions with respective guide vane opening angles of α=33 and α=38 degrees. Convergence of simulations is assumed when the hydraulic efficiency reaches a constant asymptotic value. For each domain, momentum and pressure equation residuals drop under 1 × 10⁻⁶ rms values except for the draft tube where residual reaches 1 × 10⁻⁴. The global machine RMS residuals are therefore limited to 1 × 10⁻⁴ for all simulations. Specific draft tube flow phenomena with different time scales are supposed to be at the source of this low convergence. In the post-processing step, planes are built at the same location as the LDV axes presented in Fig. 2 and are used for comparisons in the following section. ANALYSIS ADMISSION AND DISTRIBUTOR Numerical simulations are used to assess flow non-uniformities in the admission duct and distributor. Figure 4 shows the location of the planes utilized for non-uniformity analysis. Plane 1 Plane 2
Figure 4. Planes location for analysis of admission and distributor.
Static pressure results on plane 2 at overload condition for both types of interface are illustrated in figure 5. Plane 2 is a XY plane located at 75% height in the distributor section. One should note that there is almost no difference between left and right figures 24th Symposium on Hydraulic Machinery and Systems
4
except a slightly higher pressure level for simulations at left without averaging interface. The higher pressure on the third quadrant of the distributor plane (top right of planes) indicates pressure non-uniformity in the spiral casing. This non-uniformity originates from one of the channels and is clearly visible from the velocity contour and flow angle of Fig. 6 and left of Fig. 7 where the angle starts from the positive x axis. Integration of the outflow velocity over the area of Plane 1 for each admission channel shows that there is 11% more flow passing in the left channel on the y minus side. P/Pref
P/Pref
rd
3 quadrant
rd
3 quadrant
x y Figure 5. Static pressure contour at overload condition for general interface (left) and averaging interface simulations (right).
Figure 6. X Velocity contour inside the admission channels at Plane 2.
Normalized static pressure corresponding to Fig. 5 is shown in Fig. 7 right. Navg and OLavg acronyms of the legend stand respectively for simulations with the averaging interface at nominal and overload turbine operation.
Figure 7. Velocity flow angle and normalized static pressure in the distributor for all four simulation cases. 24th Symposium on Hydraulic Machinery and Systems
5
From admission and distributor results, it is clear that flow non-uniformities are initiated at the admission duct and are induced by pressure effect. Global pressure effects are reflected in the upstream and downstream flows from the distributor casing by the elliptic nature of the equations. Simulations with the admission and distributor alone have been made and also showed non-uniformities in the distributor section. This leads us to the conclusion that non-uniformities taking place in these two components are build up within them and they do not originate from draft tube or runner pressure effect. The next section will assess azimuthal non-uniformities in the conical diffuser of the hydraulic machine. RUNNER OUTLET Easy optical accesses implementation in the cone of the hydraulic turbine model allowed measuring the flow with PIV and LDV [5]. Comparisons with numerical results give good assesments of the flow behavior as well as quality of simulations. Axial and circumferential averaged velocity profiles at Axis 5b, 5c and at the circumferential position 2 (ref. Fig. 2) are shown in Fig. 8 for both operating points. ∆
Exp.
∆
---- Num.
∆
Exp.
---- Num.
Exp.
∆
---- Num.
Exp.
---- Num.
Figure 8. Axial and circumferential velocity profile comparisons between 2-D LDV measurements and numerical simulations.
Even though the velocity amplitude is not perfectly matched to the measurements, the shape and flow behavior is respected for the operating points investigated. In Fig. 9, notice that the azimuthal non-uniformity of the flow is concentrated at half axis 4 24th Symposium on Hydraulic Machinery and Systems
6
presenting the highest axial velocity differences with respectively 13% and 12% for Axis 5b and Axis 5c.
4 3 2
5
1
6
Figure 9. Velocity difference compared to crown averaged velocity for Axis 5b and 5c at overload condition.
Comparison of the interpolated measured profiles for all operating points and axes is illustrated below. The right color bars show the amplitude of the velocity and qualitative level may be appreciated from the surface plot.
Figure 10. Interpolated axial and circumferential velocity profiles for all axes and operating conditions. 24th Symposium on Hydraulic Machinery and Systems
7
There is not much variation of the velocity amplitude between Axis 5b and 5c. The main differences occur in the circumferential velocity profile of the top and bottom right surfaces, when passing from nominal regime to overload condition. In that case, circumferential velocity tends to increase in the center of the cone as the vortex rope increases in strength. It is hard to infer a clear conclusion on the behavior of the nonuniformity from steady numerical simulations since the vortex rope may take a particular quadrant at the runner outlet. This situation is illustrated in Fig. 10 where the integration of the flow would give biased results for half axis positions 5 and 6 of the simulated case on the right. Unsteady simulations are needed to resolve the unsteady vortex rope precession and flow non-uniformities associated with the averaged velocity profile.
Vortex in the 4th quadrant
Figure 11. Experimental velocity contour (left) and simulated results (right) for the axial velocity at overload condition, α=38, Axis 5c.
The experimental averaged velocity profile on the left gives same results as the axial flow in Fig. 9, with a slightly darker color in the third quadrant indicating a higher velocity. The stereo PIV plane is located in the cone past the runner hub and the comparison of the measurements and simulations for the steady circumferential and axial velocity is made at nominal condition in Fig. 12 and Fig. 13. CFD
Measurements Hub
Hub
Figure 12. Circumferential velocity obtained from measurements (left) and simulated (right).
24th Symposium on Hydraulic Machinery and Systems
8
Hub
Hub
Figure 13. Radial velocity at runner outlet. Left) Measurements. Right) Simulations.
One should note that the velocity amplitudes defined by the colour bars on the right of the simulations match the measurements well. Contours at zero value have been added to all plots to show reversing velocity regions. The radial velocity zero contour plot of Fig. 13 illustrates regions of shear layer mixing and diffusion from blade tip vortices. The velocity distributions in Fig. 12 and Fig. 13 are consistent with the evolution of the stall flow region evidenced on the axial velocity profiles in Fig. 8 top left. The circumferential velocity also indicates the presence of a weak forced vortex near the axis, consistent with the statements in reference [6]. In the experimental case at bottom left, this region moves towards the axis and reaches the centerline at about z/zref= -2.3. In the simulation case, the same region stays close to the wall and indicates less diffusion and mixing of the blade tip vortex. This phenomenon may be induced either by the mesh, that is changing from the runner to draft tube domains, or by the interface, which needs interpolation and reference frame changes within the solver. The radial and axial perturbation of the vortex core is also shown by the shear layer presence near the diffuser axis. The zero contours of the circumferential and radial velocities crossing the axis illustrate the instability of the forced vortex core. CONCLUSION This paper presents a methodology to assess non-uniformity of the flow in an axial hydraulic turbine. The 3-D PIV and 2-D LDV measurements are compared and analyzed with simulations for two operating conditions. It is found that measured and simulated results match and allow studying circumferential non-uniformities of the flow. However, the steady simulation results exposed in the paper should be taken with care since the vortex rope takes a specific configuration that reduced the axial velocity and flow rates in one quadrant of the hydraulic machine. Finally, the PIV analysis has shown that the interface or mesh has a strong impact on radial velocity distribution. It is most probable that a finer mesh or a different interface location would be needed to account for blade tip vortices and radial velocity diffusion.
24th Symposium on Hydraulic Machinery and Systems
9
ACKNOWLEDGMENTS The authors would like to thank all the partners of the Consortium on Hydraulic Machines. Special thanks to Hydro-Quebec, Alstom Hydro Canada, Voith Siemens, Va Tech Hydro, CVG Edelca, NRCan, for their support and contribution to this research project. The Canadian Natural Sciences and Engineering Research Council also provided funding for this research. REFERENCES [1] MUNTEAN, S., BALINT, D., SUSAN-RESIGA, R. ANTON and I., DARZAN, C. (2004), 3D Flow analysis in the spiral case and distributor of a Kaplan turbine, 22nd IAHR Symposium on Hydraulic Machinery and Systems, Stockholm, Sweden [2] GAGNON J.-M., CIOCAN G.D, DESCHÊNES C., ILIESCU M. (2008), "Numerical and Experimental Investigation of Rotor-Stator Interactions in an Axial Turbine: Numerical Interface Assessement", ASME 2008 Fluids Engineering Divisin Summer Meeting, Jacksonville, Florida, USA, August 10-14, FEDSM2008-55183 [3]
ANSYS CFX v11.0: Solver Theory Guide. 2006
[4] GAGNON J.-M., ILIESCU M., CIOCAN G.D, DESCHÊNES C. (2008), ”’Experimental investigation of runner outlet flow in axial turbine with LDV and stereoscopic PIV’’, 24nd IAHR Symposium on Hydraulic Machinery and Systems, accepted for publication, Foz do Iguassu, Brazil [5] CIOCAN, G.D., AVELLAN F. and KUENY J.L. (2000), Optical Measurement Techniques for Experimental Analysis of Hydraulic Turbines Rotor-Stator Interaction, Proceeding of the ASME 2000 Fluids Engineering Division Summer Meeting, Boston, MA. [6] BETTOCCHI R., CANTORE L., MAGRI L. and UBALDI M. (1982), Experimental analysis of the flow in the axial region of propeller-turbine admission ducts La Houille Blanche, 7/8
24th Symposium on Hydraulic Machinery and Systems
10