Numerical simulation of shot noise in disordered graphene Demetrio Logoteta, Paolo Marconcini, Massimo Macucci Dipartimento di Ingegneria dell’Informazione, Universit`a di Pisa, via G. Caruso 16, 56122 Pisa, Italy Email:
[email protected]
I.
I NTRODUCTION
Graphene is a two-dimensional material consisting of sp2 hybridized carbon atoms arranged in a hexagonal lattice. Since its isolation from graphite in 2004 [1], its many appealing properties, such as high mobility, mechanical strength, thermal conductivity, transparency, flexibility, have suggested a large number of applications in a variety of fields, and an intense research activity on the associated physics has developed [2]– [7]. In particular, a large effort has been devoted to the application of graphene in nanoelectronics [8]–[12], because of the potential for the fabrication of high-mobility devices with a purely two-dimensional channel. Another interesting property is that carrier dynamics in graphene can be described, using an envelope-function approach, by means of the Dirac-Weyl equation, which represents also the relativistic wave equation for massless fermions. As a result, graphene exhibits also phenomena (such as Klein tunneling or Zitterbewegung) characteristic of relativistic quantum mechanics at non relativistic speeds. In the framework of the general interest in this material, the activity of a few research groups has focused on the study of the shot noise behavior of graphene, with rather interesting and in part unexpected results. Tworzydło et al. [13] have studied shot noise suppression in a graphene ribbon with width W and length L (see the inset of Fig. 1), focusing specifically on the limit W ≫ L. A peculiar aspect of their model is the treatment of the contacts, which are assumed to be heavily doped and therefore represented with abrupt negative potential steps. Their transport calculation is based on the analytical solution of the Dirac equation, with the ICNF2013
c 978-1-4799-0671-0/13/$31.00 2013 IEEE
0.4 0.3
η
Abstract—Following the intriguing results analytically obtained for the shot noise suppression in wide and short graphene samples with doped contacts, efforts were made to achieve an experimental verification, and, while one experiment yielded a clear confirmation of the theory, another one provided data with no clear dependence of the Fano factor on gate voltage. This was attributed to the presence of a disordered potential. Here we perform a numerical study, based on an envelope function analysis, of disordered graphene samples with different aspect ratios, focusing in particular on the dependence of shot noise suppression on gate voltage. We conclude that such a dependence should survive, unless disorder with an unrealistically large amplitude is considered.
0.2 0.1
W L
0 −0.1
−0.05
0
0.05
0.1
E (eV)
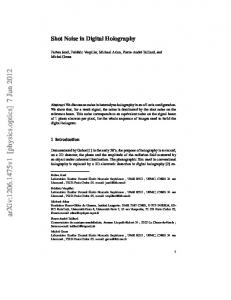
Fig. 1. Fano factor as a function of the injection energy, obtained in a graphene sample with W = 200 nm and L = 40 nm in the absence of potential disorder (dotted curve), or in the presence of a disorder with ND = 5 × 1011 cm−2 and an amplitude range δ = 0.2 eV (solid curve), or with ND = 5 × 1013 cm−2 and δ = 0.02 eV (dashed curve). The horizontal dotted line corresponds to the value 1/3. Inset: sketch of the graphene ribbon with the two contacts.
matching of the envelope function at the two contact-channel interfaces. The calculation has been performed for a range of values of the Fermi energy in the channel, around the Dirac point. For ribbons with an aspect ratio W/L > 4, they find a Fano factor approaching 1/3 exactly at the Dirac point. The potential in such a device corresponds to a thin barrier with a thickness equal to L. When the Fermi energy coincides with the potential in the channel, transport across the device takes place only via evanescent modes. Even though there is no propagating mode, conductance does not vanish because of the extremely small thickness of the barrier. The Fano factor 1/3 obtained in these conditions is identical to that characteristic of diffusive conductors (for a discussion on this topic see Refs. [14]–[18]). This coincidence derives from a similar distribution of the transmission eigenvalues and is attributed to a similarity between the classical diffusive dynamics and the jittering motion (Zitterbewegung) originating in relativistic quantum mechanics from the interference between states with positive and negative energy. Two research groups have then tried to experimentally verify this theoretical result, performing low-temperature shot noise measurements on a mechanically exfoliated graphene sheet, transferred onto a SiO2 /Si substrate, with metallic Ti/Au contacts. For graphene samples with a high aspect ratio W/L (equal to 24), Danneau et al. [19] have found a Fano factor approach-
ing 1/3 at the Dirac point and decreasing as the backgate bias is moved away from the value corresponding to the charge neutrality point. They have instead observed a reduced value of the Fano factor (0.19) at the Dirac point for a smaller aspect ratio, equal to 2. In both cases they have observed a clear dependence of the Fano factor on the gate voltage, with a qualitative behavior analogous to the prediction from the theoretical calculations. On the contrary, DiCarlo et al. [20] have measured a Fano factor between 0.35 and 0.38 in the case of single-layer samples, both for a relatively large aspect ratio (equal to 5.7, and thus anyway smaller than the largest W/L considered in Ref. [19]) and for an almost square aspect ratio, even in the presence of a p-n junction. In their measurements, the shot noise suppression factor appears to be nearly insensitive to the value of the applied gate voltage. In order to explain their findings, they make reference to a theoretical work by Lewenkopf et al. [21], in which small graphene samples (with a few nanometer size) are studied by means of a Green’s function technique based on a tight-binding model. They consider a long-range disorder and samples with different aspect ratios. One of the conclusions of this numerical analysis is that the Fano factor should be nearly independent of the gate bias for sufficiently large disorder strengths. On the basis of this conclusion, DiCarlo et al. [20] explain their own results as due to the presence of strong disorder. However, from Fig. 5 of Ref. [21] the dependence of the Fano factor on gate voltage seems to disappear only for values of their disorder strength parameter K0 greater than 5. Since in realistic samples [22]–[25] the magnitude δ of the potential fluctuations is about 100 meV, with the range ξ of the potential considered in their Fig. 5 and their expression for K0 , the value of the concentration nimp of scatterers assumes an unphysical value (well above 1). Therefore, for realistic values of the potential fluctuations a dependence of the Fano factor on gate voltage should be present, and thus the results by DiCarlo et al. [20] do not have an immediate explanation and could possibly be related to the presence of unusually strong disorder. In order to gain a better insight into the problem and to extend the numerical analysis to larger graphene samples, with sizes comparable to those typical of the experimental studies, we have exploited a code that we have recently developed for the simulation of transport in graphene. II.
N UMERICAL METHOD
In our analysis we have considered transport through graphene ribbons with armchair edges (with proper enforcement of the boundary conditions), and we have adopted an envelope function approach. In detail, graphene is described by four envelope functions, corresponding to the 2 inequivalent Dirac points and to the 2 sublattices [26]. The four envelope functions satisfy the Dirac-Weyl equation, which represents a first-order differential equation. In our simulation (in analogy with the approach we follow for heterostructure-based devices [27], [28]), we divide the ribbon into thin transverse sections in each of which the longitudinal variations of the potential are negligible. In each section, we solve the Dirac equation for the envelope
functions. While in the literature, in order to simplify the calculations, periodic boundary conditions are often assumed at the edges, here we have considered the exact Dirichlet boundary conditions, which have the effect to couple the envelope functions corresponding to the two inequivalent Dirac points. However, we can reformulate our differential problem in terms of a new function, defined on a doubled domain and easily related to the original envelope functions, for which the original Dirichlet boundary conditions become periodic boundary conditions [29], [30]. This new formulation allows to solve the Dirac equation using a Fourier-based approach (or equivalently, in the direct space, a sinc-based method [31]), avoiding the problems related to the standard finite-element discretization of the Dirac equation in the direct space, and increasing the efficiency of the algorithm. The longitudinal wave vectors and transverse eigenfunctions that we obtain from this solution are then exploited to compute the scattering matrix between adjacent sections, enforcing the continuity of the wave function at the interface. Recursively composing these matrices, we obtain the scattering matrix and (from this) the transmission matrix t of the overall device. The Fano factor η is then obtained following the Landauer-B¨uttiker approach [32]: P h i Ti (1 − Ti )i hSI i hSI i P η= = = , (1) h2 e Ii 2 e |V |hGi h i Ti i where e is the elementary charge, I is the current flowing in the sample, G is its conductance, V is the voltage bias we apply, and the Ti ’s are the eigenvalues of the matrix t† t. Energy averages are performed separately for the numerator and the denominator [27]. The use of a continuum, envelope-function method has allowed us to perform simulations for relatively large graphene structures, which could not be dealt with using an atomistic treatment such as the one adopted in Ref. [21] (where actually only samples with a size of a few nanometers are considered). Our envelope function approach has been validated by comparing the obtained results with those from a tight-binding code in the case of device sizes for which tight-binding calculations are still feasible: a very good agreement has been obtained, provided that potentials vary slowly on the lattice constant scale and that not too large energies are considered [30]. The potential disorder has been represented with a sum of Gaussian functions. The number of Gaussian functions depends on the impurity concentration ND that we consider. The amplitude of each Gaussian is randomly generated, with a uniform distribution, in an interval [−δ, +δ] (δ being the parameter which controls the disorder amplitude). The half width at half maximum of each Gaussian is assumed equal to 10 nm. III.
N UMERICAL RESULTS
We have first simulated the shot noise behavior of an ideal (without potential fluctuations) graphene ribbon with a large aspect ratio W/L, in order to recover the results of Tworzydlo et al. [13]. We have considered a graphene sample with W = 200 nm and L = 40 nm (aspect ratio W/L = 5). The potential energy of the graphene sample is zero, while that of the contacts is equal to −0.3 eV. In
1
a)
a)
0.6
0.8 0.6 η
η
0.4
0.4
0.2 0.2
0
0
−0.1
−0.05
0
0.05
0.1
−0.1
−0.05
E (eV)
0
0.05
0.1
0.05
0.1
E (eV) 1
b)
b)
0.6
0.8 0.6 η
η
0.4
0.4
0.2 0.2
0
0
−0.1
−0.05
0
0.05
0.1
E (eV)
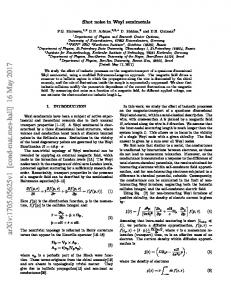
Fig. 2. Fano factor as a function of the injection energy, obtained in a graphene square sample with W = 200 nm and L = 200 nm, for ND = 5 × 1011 cm−2 and with an amplitude range δ equal to 0.16 eV (a) and 0.5 eV (b).
−0.1
−0.05
0 E (eV)
Fig. 3. Fano factor as a function of the injection energy, obtained in a graphene rectangular sample with W = 200 nm and L = 600 nm, for ND = 5 × 1011 cm−2 and with δ equal to 0.16 eV (a) and 0.5 eV (b).
typical for devices of practical interest. Ref. [13] they assume a very large negative value, such that it does not influence the results; we have determined that the main features of the Fano factor are already captured with the value −0.3 eV, which involves considering not too large a number of modes, and used it for all the following simulations, unless otherwise noted. In Fig. 1 with a dotted curve we show the Fano factor that we have obtained for an injection energy ranging from -0.115 eV to 0.115 eV. As we can see, the result is coincident with that found by Tworzydło et al. (apart from the asymmetry with respect to zero energy: as we have verified, symmetry is recovered if a lower value of the potential energy is considered in the contacts, significantly increasing the computational burden, due to the large number of propagating modes in these regions). In agreement with the conclusions by Tworzydło et al., the value 1/3 for the Fano factor is obtained for a zero injection energy. We have then added a disordered potential to this graphene ribbon: results for two different realizations of such a disorder are reported with a dashed and a solid line in Fig. 1. In particular, the data represented with a solid line are for δ = 0.2 eV and ND = 5×1011 cm−2 , and those represented with a dashed line are for δ = 0.02 eV and ND = 5 × 1013 cm−2 . Thus, for the realistic disorder parameters [22]–[25], [33]–[36] that we have considered, the energy dependence of the Fano factor survives, although damped. From this we conclude that Danneau et al. [19] should have indeed measured the effect predicted by Tworzydło et al. [13] in a sample with quite low a level of disorder, i.e. of very high quality. We have then investigated the effect of disorder in graphene samples with a smaller aspect ratio, in which evanescent modes play a lesser role, and which are closer to the geometries
First we have considered a square sample, with W = 200 nm and L = 200 nm. In Fig. 2 we show the behavior of the Fano factor as a function of the injection energy for a concentration of scatterers ND = 5 × 1011 cm−2 and with an amplitude range δ equal to 0.16 eV [panel (a)] and 0.5 eV [panel (b)]. In contrast to what has been observed in the experiment by DiCarlo et al. [20], we find that in the presence of disorder the Fano factor still has a dependence on the Fermi energy, which is clear in the case of a realistic amplitude of the disorder (δ = 0.16 eV), and tends to vanish only for the unrealistic disorder amplitude δ = 0.5 eV. In Fig. 3 we report our results for a rectangular ribbon, with W = 200 nm and L = 600 nm. We again consider ND = 5×1011 cm−2 and two values of δ: δ = 0.16 eV [panel (a)] and δ = 0.5 eV [panel (b)]. Also in this case we observe a clear dependence of the Fano factor on the injection energy (or, equivalently, on the gate voltage) for the realistic value δ = 0.16 eV, while the behavior tends to be more constant for δ = 0.5 eV. In Fig. 4 we show the results that we have obtained for the previous rectangular ribbon with δ = 0.16 eV, considering the potential energy of the contacts at 0 eV. Comparing these data with those obtained with the potential energy of the contacts at -0.3 eV (Fig. 3(a)), we see that the effect of the contact potential is negligible for an injection energy sufficiently away from zero. The effect of the contacts with lowered potential is instead significant for low injection energies, in particular in correspondence of the energy gap of semiconducting ribbons, where no propagating modes exist. Since in Eq. (1) sums are performed only over the modes propagating in the input and output leads, if there are no such modes the conductance vanishes and the Fano factor is undefined. Keeping the contacts
1 0.8
η
0.6 0.4 0.2 0 −0.1
−0.05
0
0.05
0.1
E (eV)
Fig. 4. Fano factor as a function of the injection energy, obtained (outside the energy gap of the semiconducting ribbon) in a graphene rectangular sample with W = 200 nm and L = 600 nm, for ND = 5 × 1011 cm−2 and with δ = 0.16 eV, considering the potential energy of the contacts at 0 eV. Contrary to the situation with potential at the contacts of −0.3 eV, here transmission drops to zero in the gap, and therefore the Fano factor is not defined within the gap.
at a negative energy has instead the beneficial effect to allow a number of propagating modes in the leads also for the values of the injection energy for which there are only evanescent modes in the device channel, leading to a nonzero conductance and therefore to a well-defined Fano factor. This is particularly important in the case of the high aspect ratio considered by Tworzydło et al. [13]. In that case the 1/3 value for the Fano factor is obtained for a zero injection energy (when there is no propagating mode inside the graphene sample) and it is due just to the effect of evanescent modes. IV.
C ONCLUSION
We have investigated shot noise suppression in disordered graphene samples, using an envelope-function approach, with the introduction of exact boundary conditions. Our study has been motivated by the need to interpret available experimental results, and to extend the existing numerical studies, which were limited to samples of the size of a few tens of nanometers, because of the atomistic approaches that had been used. We have shown that our approach recovers the analytical results by Tworzydło et al. [13] in ideal graphene samples with high aspect ratio, and that such an ideal behavior can be modified by the presence of disorder. Our main result is that in samples with low aspect ratio, in which the shot noise behavior is mainly driven by the characteristics of disorder (as in generic disordered conductors), the Fano factor has a clear dependence on the gate voltage (or, equivalently, on the injection energy), that vanishes only if unrealistic values for the disorder amplitude are considered. R EFERENCES [1] K. S. Novoselov, A. K. Geim, S. V. Morozov, D. Jiang, Y. Zhang, S. V. Dubonos, I. V. Grigorieva, A. A. Firsov, Science, vol. 306, p. 666, 2004. [2] A. K. Geim, K. S. Novoselov, Nature Materials, vol. 6, p. 183, 2007. [3] A. K. Geim, Science, vol. 324, p. 1530, 2009. [4] A. H. Castro Neto, F. Guinea, N. M. R. Peres, K. S. Novoselov, A. K. Geim, Rev. Mod. Phys., vol. 81, p. 109, 2009. [5] S. Mikhailov, Physics and Applications of Graphene, Rijeka: InTech, 2011.
[6] M. R. Connolly, R. K. Puddy, D. Logoteta, P. Marconcini, M. Roy, J. P. Griffiths, G. A. C. Jones, P. A. Maksym, M. Macucci, C. G. Smith, Nano Lett., vol. 12, p. 5448, 2012. [7] D. Logoteta, P. Marconcini, M. R. Connolly, C. G. Smith, M. Macucci, “Numerical simulation of scanning gate spectroscopy on bilayer graphene in the Quantum Hall regime,” Proceedings of IWCE 2012, IEEE Conference Proceedings, 6242841, 2012, DOI: 10.1109/IWCE.2012.6242841. [8] H. Raza, Graphene Nanoelectronics: Metrology, Synthesis, Properties and Applications, Heidelberg: Springer, 2012. [9] F. Schwierz, Nature Nanotech., vol. 5, p. 487, 2010. [10] G. Iannaccone, G. Fiori, M. Macucci, P. Michetti, M. Cheli, A. Betti, P. Marconcini, “Perspectives of graphene nanoelectronics: probing technological options with modeling,” Proc. of IEDM 2009, IEEE Conference Proceedings, p. 245, 2009, DOI: 10.1109/IEDM.2009.5424376. [11] P. Marconcini, A. Cresti, F. Triozon, G. Fiori, B. Biel, Y.-M. Niquet, M. Macucci, S. Roche, “Atomistic Boron-Doped Graphene Field-Effect Transistors: A Route toward Unipolar Characteristics,” ACS Nano, vol. 6, p. 7942, 2012. [12] P. Marconcini, A. Cresti, F. Triozon, G. Fiori, B. Biel, Y.M. Niquet, M. Macucci, S. Roche, “Electron-hole transport asymmetry in Boron-doped Graphene Field Effect Transistors,” Proc. of IWCE 2012, IEEE Conference Proceedings, p. 6242844, 2012, DOI: 10.1109/IWCE.2012.6242844. [13] J. Tworzydło, B. Trauzettel, M. Titov, A. Rycerz, C. W. J. Beenakker, Phys. Rev. Lett., vol. 96, p. 246802, 2006. [14] Y. M. Blanter, M. B¨uttiker, Phys. Rep., vol. 336, p. 1, 2000. [15] C. W. J. Beenakker, Rev. Mod. Phys., vol. 69, p. 731, 1997. [16] P. Marconcini, M. Macucci, D. Logoteta, M. Totaro, Fluct. Noise Lett., vol. 11, p. 1240012, 2012. [17] P. Marconcini, M. Totaro, G. Basso, M. Macucci, arXiv:1302.7239. [18] P. Marconcini, M. Macucci, G. Iannaccone, B. Pellegrini, Phys. Rev. B, vol. 79, p. 241307(R), 2009. [19] R. Danneau, F. Wu, M. F. Craciun, S. Russo, M. Y. Tomi, J. Salmilehto, A. F. Morpurgo, P. J. Hakonen, Phys. Rev. Lett., vol. 100, p. 196802, 2008. [20] L. DiCarlo, J. R. Williams, Y. Zhang, D. T. McClure, C. M. Marcus, Phys. Rev. Lett., vol. 100, p. 156801, 2008. [21] C. H. Lewenkopf, E. R. Mucciolo, A. H. Castro Neto, Phys. Rev. B, vol. 77, p. 081410(R), 2008. [22] S. Dr¨oscher, P. Roulleau, F. Molitor, P. Studerus, C. Stampfer, K. Ensslin, T. Ihn, Appl. Phys. Lett., vol. 96, p. 152104, 2010. [23] C. Stampfer, J. G¨uttinger, S. Hellm¨uller, F. Molitor, K. Ensslin, T. Ihn, Phys. Rev. Lett., vol. 102, p. 056403, 2009. [24] J. Martin, N. Akerman, G. Ulbricht, T. Lohmann, J. H. Smet, K. von Klitzing, A. Yacoby, Nature Physics, vol. 4, p. 144, 2008. [25] Y. Zhang, V. W. Brar, C. Girit, A. Zettl, M. F. Crommie, Nature Physics, vol. 5, 722, 2009. [26] P. Marconcini, M. Macucci, La Rivista del Nuovo Cimento, vol. 34, no. 8-9, p. 489, 2011. [27] P. Marconcini, M. Macucci, G. Iannaccone, B. Pellegrini, G. Marola, Europhys. Lett., vol. 73, p. 574, 2006. [28] R. S. Whitney, P. Marconcini, M. Macucci, Phys. Rev. Lett., vol. 102, p. 186802, 2009. [29] M. Fagotti, C. Bonati, D. Logoteta, P. Marconcini, M. Macucci, Phys. Rev. B, vol. 83, p. 241406(R), 2011. [30] D. Logoteta, P. Marconcini, C. Bonati, M. Fagotti, M. Macucci, “Highperformance solution of the transport problem in a graphene structure with a generic potential,” to be published. [31] P. Marconcini, D. Logoteta, M. Macucci, arXiv:1304.4213. [32] M. B¨uttiker, Phys. Rev. Lett., vol. 65, p. 2901 (1990). [33] S. Adam, S. Das Sarma, Solid State Commun., vol. 146, p. 356, 2008. [34] F. Chen, J. Xia, D. K. Ferry, N. Tao, Nano Lett., vol. 9 p. 2571, 2009. [35] Z. H. Ni, T. Yu, Z. Q. Luo, Y. Y. Wang, L. Liu, C. P. Wong, J. Miao, W. Huang, Z. X. Shen ACS Nano, vol. 3, p. 569, 2009. [36] Y.-W. Tan, Y. Zhang, K. Bolotin, Y. Zhao, S. Adam, E. H. Hwang, S. Das Sarma, H. L.‘Stormer, P. Kim, Phys. Rev. Lett., vol. 99, p. 246803, 2007.