23 . Schmucker-Weidelt-Kolloquium für Elektromagnetische Tiefenforschung,. Heimvolkshochschule am Seddiner See, 28 September - 2 Oktober 2009. 137 ...
Electromagnetic Monitoring of CO2 Storage in Deep Saline Aquifers - Numerical Simulations and Laboratory Experiments J. H. B¨orner, V. Herdegen, R.-U. B¨orner, K. Spitzer Institut f¨ ur Geophysik, TU Bergakademie Freiberg, Gustav-Zeuner-Str. 12, 09599 Freiberg
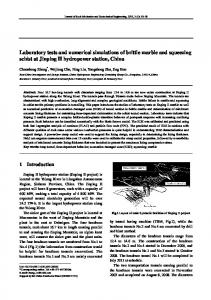
1 Introduction The knowledge of petrophysical parameters and their contrasts is crucial to reliably monitoring CO2 storage processes. The electrical conductivity appears to be a sensitive indicator for a resistive gaseous or supercritical CO2 phase replacing a conductive pore fluid in a porous medium like a saline sandstone aquifer. However, detailed knowledge on the influence of supercritical CO2 on the electrical resistivity of a formation is not sufficiently available yet. Therefore, we have carried out laboratory experiments to predict the contrast in electrical resistivity due to the presence of CO2 in an initially water-saturated sand sample resembling the petrophysical situation typical for a reservoir. Furthermore, the expected parameter contrasts were estimated according to empirical equations and numerical simulations (Fig. 1). On a middle- to long-term perspective, we aim at developing an electromagnetic monitoring technique using a borehole transient electromagnetic sensor which offers a unique opportunity to generate enhanced sensitivity at depth with respect to detecting migrating CO2 in a reservoir. This work is therefore integrated into national CCS research programs with an interdisciplinary variety of partners. / 0����� �� �� -��� ��� ��������� 1����������� � ����������
-��� ��� ������������ .� ����� ������� ��������� ������ ����
��� ��� ��� ������� ������ �������
(������ �� ��� ����������� ��� �������������)*�� �� ���
� ����������������� ���� � ����� ��� ��� �� ����������� ���� ������������ �������������� ��� ���������������
��� ����� �� **�� ���� ��+������ ������� ��� � ������ �,���
� �������� � � ��� �������
������������ � �� � �
(�����*��� � ������� ��� � ��� ���*� ��������� �*������ ���� ���� �
������� �� ���������
���������� !"#� ��$ �� �%� ������ !&'�
������ �� � � � ��������� �
�� ���� ��� ������������ ��� � ������� ����� � ��+������ ������� ��� � ������ �,���
Figure 1: Workflow of the numerical simulation steps necessary for the transformation of water saturation into electrical resistivity.
2 Theory Two-phase flow is governed by two equations simultaneously enforcing continuity of the water (w) and the CO2 (co2) phase flow (Busch et al. 1993). Both equations are linked by retention curves Se (pc ) and relative permeabilities kr (S), such that κkrw ∂(dw Sew ) w w + dw w 0 (∇p + d g∇D)] = −Φ ηw ∂t κkrco2 ∂(dco2 Seco2 ) + dco2 w0 (∇pco2 + dco2 g∇D)] = −Φ ∇ · dco2 [− co2 η ∂t ∇ · dw [−
(1)
with d as density, κ as intrinsic permeability, η as viscosity, Φ as porosity and g as gravitational acceleration. The link between both phases has been established by experimental data or parameterization,
23 . Schmucker-Weidelt-Kolloquium für Elektromagnetische Tiefenforschung, Heimvolkshochschule am Seddiner See, 28 September - 2 Oktober 2009 137
e.g., by van Genuchten (1980) or Mualem (1976) (with effective saturation Se , capillary pressure height Hc and parameters α, n, m, L): 1 (1 + |αHc |n )m �m �2 � � krw = (Sew )L · 1 − 1 − (Sew )1/m
Sew =
Seco2 = 1 − Sew
(2)
�2m � krco2 = (1 − Sew )L · 1 − (Sew )1/m
(3)
The resulting distribution of water saturation S(x, y, z, t) can be transformed into electrical formation resistivity ρ using empirical resistivity models, e.g., Archie’s law (Archie 1942): ρ = a1 · Φ−a2 · S −a3 ·
1 σw
(4)
with σw denoting pore water conductivity. Archie’s empirical parameters a1 , a2 and a3 strongly depend on rock formation characteristics and can be combined with porosity and water saturation yielding the formation factor F , such that ρ = F · ρw .
(5)
For sands and sandstones with considerable clay content Waxman and Smits (1968) expanded Archie’s law to account for both electrolytic conductance and interfacial conductance: ρ =
F∗ Sn
· (σw +
B·Qv −1 S )
(6)
with a unique formation factor F ∗ , the counterion mobility B describing the weak dependance of the interface conductivity on pore water salinity and the shalyness parameter Qv being the cation exchange capacity normalized to the pore volume.
3 Numerical simulation studies The process of CO2 sequestration as well as the indication of a successful storage by observation of changes in electrical resistivity has been simulated following the steps indicated by the workflow shown in Fig. 1.
Figure 2: CO2 saturation after 6 months of constant injection of 1000 m3 per day into a 25 m thick reservoir. The injection well is located at the geometric center. These results were obtained using the FD simulation code Mod2PhaseThermo.
23 . Schmucker-Weidelt-Kolloquium für Elektromagnetische Tiefenforschung, Heimvolkshochschule am Seddiner See, 28 September - 2 Oktober 2009 138
23 . Schmucker-Weidelt-Kolloquium für Elektromagnetische Tiefenforschung, Heimvolkshochschule am Seddiner See, 28 September - 2 Oktober 2009 139
23 . Schmucker-Weidelt-Kolloquium für Elektromagnetische Tiefenforschung, Heimvolkshochschule am Seddiner See, 28 September - 2 Oktober 2009 140
Final experiments have demonstrated that an increase in resistivity may also be achieved under supercritical conditions. However, the sample was not homogeneously infiltrated by the CO2 and preferential flow paths were built up during the experiment. The pore water has been pressed out only partially, leaving behind tube-shaped flow channels and a very heterogeneous water distribution with average residual water contents of more than 70 %. 500 van Genuchten measured data pressure height in m
400
300
200
100
0 0
0.2
0.4 0.6 water saturation
0.8
1
Figure 6: Relation between CO2 pressure and water saturation derived from data obtained by the initial pressure build-up for an experiment with a projected maximum pressure of 50 bar. The reference data have been calculated according to van Genuchten (1980) with α = 0.02 and n = 3.9 (cf. eqs. (2)-(3)).
The complications are due to the density of supercritical CO2 which is large compared to the density of CO2 in its gaseous state. Consequently, the current experimental assembly causes the high density to result in low flow velocities within the measuring cell. In addition to the flow channels, this effect prevents an effective replacement of the pore water by supercritical CO2 . The experiments have shown that theoretical pressure-saturation relations can generally be verified in practice using our set-up (Fig. 6). All experimental data sufficiently agree with Archie’s law. However, we have to carry out further investigations on the effects of CO2 dissolving in the pore water. There are indications that this has an important impact on the pore water resistivity depending on pressure, temperature, and brine salinity.
6 Conclusions Numerical simulation studies and laboratory experiments show that the electrical resistivity of a fluid-saturated porous medium is highly sensitive to the presence of CO2 . Geo-electromagnetic methods are therefore considered as a promising approach for monitoring CO2 storage. Still, the laboratory set-up has to be improved further to provide reliable results at high pressures. Subject to these prerequisites, well-founded simulations of electromagnetic monitoring scenarios can be carried out. Further laboratory experiments will also aim at quantifying the influence of dissolved CO2 on pore water and formation resistivity. A feasibility study could show whether electromagnetic methods are able to monitor, e.g., an expanding plume of CO2 -rich formation water during CO2 injection. Finally, the applicability of the laboratory assembly for measuring reliable retention curves of unconsolidated sedimentary rocks will be further tested in the near future.
23 . Schmucker-Weidelt-Kolloquium für Elektromagnetische Tiefenforschung, Heimvolkshochschule am Seddiner See, 28 September - 2 Oktober 2009 141
References Archie, G. E. (1942). The electrical resistivity log as an aid in determining some reservoir characteristics. Trans. Americ. Inst. Mineral. Met. (146): 54–62. Busch, K.-F., L. Luckner, and K. Tiemer (1993). Geohydraulik. Edited by G. Matthess. 3rd edition. Volume 3. Lehrbuch der Hydrogeologie. Gebr¨ uder Borntraeger. isbn: 3-443-01004-0. H¨ afner, F. and S. Boy (2009). Mod2PhaseThermo Nutzermanual. IBeWa. Mualem, Y. (1976). A new Model for predicting the hydraulic condyctivity of unsaturated porous media. Water Resour. Res. 12: 283–291. Sch¨ on, J. (1996). Physical Properties of Rocks - Fundamentals and Principles of Petrophysics. 1st edition. Volume 18. Handbook of Geophysical Exploration. Section I, Seismic Exploration. Pergamon. van Genuchten, M. (1980). A Closed-form Equation for Predicting the Hydraulic Conductivity of Unsaturated Soils. Soil Science Society of America Journal 44(5): 892–898. Waxman, M. H. and L. J. M. Smits (1968). Electrical conductivities in oil-bearing shaly sands. Society of Petroleum Engineers Journal 8: 107–122.
23 . Schmucker-Weidelt-Kolloquium für Elektromagnetische Tiefenforschung, Heimvolkshochschule am Seddiner See, 28 September - 2 Oktober 2009 142