Map showing the Blackstone River Basin in Massachusetts and Rhode Island ..... Wrentham .... river's outlet to Narragansett Bay to compare loads entering.
Prepared in cooperation with the Massachusetts Department of Environmental Protection
Nutrient, Suspended Sediment, and Trace Element Loads in the Blackstone River Basin in Massachusetts and Rhode Island, 2007 to 2009
Scientific Investigations Report 2015–5026 U.S. Department of the Interior U.S. Geological Survey
Cover. Monitoring station on the Blackstone River at Millville, Massachusetts, in winter 2007. Photograph by Andy Waite, U.S. Geological Survey.
Nutrient, Suspended Sediment, and Trace Element Loads in the Blackstone River Basin in Massachusetts and Rhode Island, 2007 to 2009 By Marc J. Zimmerman, Marcus C. Waldron, and Leslie A. DeSimone
Prepared in cooperation with the Massachusetts Department of Environmental Protection
Scientific Investigations Report 2015–5026
U.S. Department of the Interior U.S. Geological Survey
U.S. Department of the Interior SALLY JEWELL, Secretary U.S. Geological Survey Suzette M. Kimball, Acting Director
U.S. Geological Survey, Reston, Virginia: 2015
For more information on the USGS—the Federal source for science about the Earth, its natural and living resources, natural hazards, and the environment—visit http://www.usgs.gov/ or call 1–888–ASK–USGS. For an overview of USGS information products, including maps, imagery, and publications, visit http://www.usgs.gov/pubprod/.
Any use of trade, firm, or product names is for descriptive purposes only and does not imply endorsement by the U.S. Government. Although this information product, for the most part, is in the public domain, it also may contain copyrighted materials as noted in the text. Permission to reproduce copyrighted items must be secured from the copyright owner.
Suggested citation: Zimmerman, M.J., Waldron, M.C., and DeSimone, L.A., 2015, Nutrient, suspended sediment, and trace element loads in the Blackstone River Basin in Massachusetts and Rhode Island, 2007 to 2009: U.S. Geological Survey Scientific Investigations Report 2015–5026, 112 p., http://dx.doi.org/10.3133/sir20155026. ISSN 2328-0328 (online)
iii
Acknowledgments This report benefitted greatly from the support and assistance of our cooperators and U.S. Geological Survey colleagues. Dennis R. Dunn, Elaine Hartman, Kimberly Groff, Alice Rojko, and Bryant Firmin from the Massachusetts Department of Environmental Protection enthusiastically supported and helped guide the work. Many U.S. Geological Survey staff and scientists contributed to the completion of the study described in this report. Kirk Smith designed, assembled, and installed the water-quality sampling system. Robert Breault served as project chief during the development and monitoring phases of the study. Kim Campo, Mark Nimiroski, and Dominic Murino were responsible for performing most of the intensive fieldwork that the monitoring, sample processing, and equipment maintenance demanded. Lance Ostiguy produced maps and geographic information system-based information. Gina Daniels and Elizabeth Abate provided assistance with data management and the production of figures used in this report. Virginia L. McGuire and David L. Lorenz provided invaluable support for our applications of statistical software.
v
Contents Acknowledgments.........................................................................................................................................iii Abstract............................................................................................................................................................1 Introduction.....................................................................................................................................................2 Previous Studies....................................................................................................................................2 Study Area..............................................................................................................................................4 Purpose and Scope...............................................................................................................................4 Methods...........................................................................................................................................................4 Measuring Streamflow.........................................................................................................................5 Automated, Flow-Proportional, Water-Quality Sampling................................................................5 Data Collection for Turbidity...............................................................................................................12 Manual Water-Quality Sampling.......................................................................................................13 Wastewater Effluent Sampling..........................................................................................................13 Quality-Control Sampling and Data..................................................................................................13 Blank and Replicate Quality-Control Samples.......................................................................13 Effect of Sample Holding Time..................................................................................................21 Concentration Data and Constituent Load Calculations...............................................................21 Concentration Data....................................................................................................................21 Constituent Loads.......................................................................................................................23 Base Flow and Runoff Components of Streamflow.......................................................................24 Constituent Loads in the Blackstone River Basin...................................................................................24 Nitrogen, Phosphorus, and Suspended Sediment Loads in the Massachusetts Segment of the Blackstone River Basin.............................................................................24 Nitrogen........................................................................................................................................32 Total Nitrogen Loads.........................................................................................................32 Nitrogen Loads and Hydrologic Conditions...................................................................32 Nitrogen Attenuation.........................................................................................................36 Phosphorus..................................................................................................................................38 Suspended Sediment.................................................................................................................39 Annual Loads of Nitrogen, Phosphorus, and Suspended Sediment at Millville, Massachusetts..............................................................................................................39 Comparisons of Nutrient, Suspended Sediment, and Trace Element Loads at Millville, Massachusetts, and Pawtucket, Rhode Island.................................................................40 Potential for Resuspension and Transport of Trace Element- and Nutrient-Enriched Bottom Sediment From Two Blackstone River Impoundments.............................................................49 Turbidity Patterns in Relation to Streamflow and Precipitation...................................................52 Turbidity as a Surrogate for Particulate Trace Elements, Nutrients, and Suspended Sediment..................................................................................................................................56 Effects of Sediment Resuspension on Contaminant Concentrations and Loads......................57 Changes in Trace Element Concentrations Resulting From Sediment Resuspension....57 Changes in Constituent Loading Resulting From Sediment Resuspension.......................57 Effects of Flow on Changes in Constituent Loads During Passage Through Impoundments...............................................................................................................62 Summary........................................................................................................................................................66 References Cited..........................................................................................................................................67
vi
Appendix 1. Concentrations of Nitrogen and Phosphorus Analytes and Suspended Sediment in Composite Water-Quality Samples Collected at Monitoring Stations in the Blackstone River, Massachusetts and Rhode Island, 2007 to 2009..........................83 Appendix 2. Concentrations of Nitrogen and Phosphorus Analytes and Suspended Sediment in Equal-Width Increment and Point Water-Quality Samples Collected at Stream Monitoring Stations in the Blackstone River, Massachusetts and Rhode Island, 2007 to 2009......................................................................................................................83 Appendix 3. Concentrations of Trace Elements in Composite Water-Quality Samples Collected at Stream Monitoring Stations in the Blackstone River Basin, Massachusetts and Rhode Island, 2007 to 2009.....................................................................83 Appendix 4. Concentrations of Trace Elements in Equal-Width-Increment and Point WaterQuality Samples Collected at Stream Monitoring Stations in the Blackstone River Basin, Massachusetts and Rhode Island, 2007 to 2009.........................................................83 Appendix 5. Concentrations of Nitrogen and Phosphorus Analytes and Suspended Sediment in Composite Water-Quality Samples Collected at Wastewater Treatment Plants in the Blackstone River, Massachusetts and Rhode Island, 2007 to 2009.............83 Appendix 6. Constituent Loads and Streamflow at the Blackstone River Basin, Massachusetts and Rhode Island, 2007 to 2009.....................................................................85
Figures
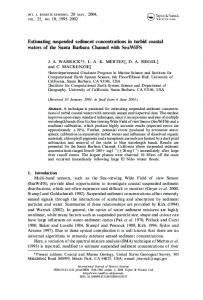
1. Map showing the Blackstone River Basin in Massachusetts and Rhode Island...............3 2. Schematic diagram of the Blackstone River Basin, Massachusetts and Rhode Island, major tributaries, and wastewater treatment plants..................................................8 3. Photograph showing the automated sampling system used in the Blackstone River Basin, Massachusetts and Rhode Island........................................................................9 4. Photographs showing water-quality- and streamflow-monitoring locations in the Blackstone River Basin in Massachusetts and Rhode Island.............................................10 5. Graphs showing loads of total nitrogen, total phosphorus, and suspended sediment at stream monitoring stations and wastewater treatment plants from composite samples in the Blackstone River Basin, Massachusetts and Rhode Island, for the 2-week sampling periods starting A, August 28, 2007, B, April 28, 2008, C, June 24, 2008, D, September 16, 2008, E, May 13, 2009, F, July 7, 2009, and G, September 1, 2009...................................................................................................................25 6. Graphs showing comparison of total nitrogen loads and base-flow index at the stream monitoring station at the Blackstone River at Millville, Massachusetts (01111230), from 2007 to 2009, for A, total nitrogen load and B, total nitrogen load from wastewater treatment plants as percentage of total nitrogen load in the river......36 7. Graphs showing loads of A, total nitrogen, B, total phosphorus, and C, suspended sediment and streamflow in the Blackstone River at monitoring stations in Millville, Massachusetts (01111230), and Pawtucket, Rhode Island (01113895), for September 1 to November 3, 2008, and May 1 to October 1, 2009.......................................41 8. Graphs showing loads of A, total cadmium, B, total chromium, C, total copper, D, total lead, E, total nickel, and F, total zinc and streamflow in the Blackstone River at monitoring stations at Millville, Massachusetts (01111230), and Pawtucket, Rhode Island (01113895), from September 1 to November 3, 2008.................44 9. Satellite images of the A, former Rockdale Pond impoundment and B, Rice City Pond impoundment on the Blackstone River, Massachusetts............................................50
vii
10. Graphs showing turbidity patterns at Blackstone River monitoring stations upstream (01110400) and downstream (01110500) from the former Rockdale Pond impoundment on the Blackstone River, Massachusetts, during water year 2008, in relation to measured streamflow at the monitoring station and to precipitation at the Upper Blackstone Water Pollution Control Abatement District wastewater treatment plant in Millbury, Mass.............................................................................................53 11. Graphs showing turbidity patterns at Blackstone River monitoring stations upstream (01110530) and downstream (01110535) from the Rice City Pond impoundment on the Blackstone River, Massachusetts, during water year 2008, in relation to measured streamflow at the monitoring station and to precipitation at the Upper Blackstone Water Pollution Control Abatement District wastewater treatment plant in Millbury, Mass................................................................................................................54 12. Graphs showing turbidity patterns at four Blackstone River monitoring stations upstream and downstream from the former Rockdale Pond and Rice City Pond impoundment on the Blackstone River, Massachusetts, in relation to measured streamflow at during the A, December 22 to 28, 2007, and B, March 15 to April 4, 2008, storms.....................................................................................................................55 13. Graphs showing the effects of sediment resuspension on estimated particulate trace element concentrations at streamflow and water-quality monitoring stations A, upstream (station 01110400) and B, downstream (station 01110500) from the former Rockdale Pond impoundment on the Blackstone River, Massachusetts, during selected high-flow events in water year 2008............................................................58 14. Graphs showing the effects of sediment resuspension on estimated particulate trace element concentrations at streamflow and water-quality monitoring stations A, upstream (station 01110530) and B, downstream (station 01110535) from the Rice City Pond impoundment on the Blackstone River, Massachusetts, impoundment during selected high-flow events in water year 2008..................................................59 15. Graphs showing the effects of sediment resuspension on particulate chromium loads at four Blackstone River monitoring stations upstream and downstream from the former Rockdale Pond and Rice City Pond impoundments on the Blackstone River, Massachusetts, for A, December 19 to 31, 2007, and B, March 16 to April 2, 2008...................................................................................................................................60 16. Graphs showing the effects of sediment resuspension on particulate phosphorus loads at four Blackstone River monitoring stations upstream and downstream from the former Rockdale Pond and Rice City Pond impoundments on the Blackstone River, Massachusetts, for A, December 19 to 31, 2007, and B, March 16 to April 4, 2008........................................................................................................61 17. Graphs showing the effects of sediment resuspension on suspended sediment loads at four Blackstone River monitoring stations upstream and downstream from the former Rockdale Pond and Rice City Pond impoundments on the Blackstone River, Massachusetts, for A, December 19, 2007, to January 1, 2008, and B, March 16 to April 4, 2008........................................................................................................63 18. Graphs showing the effects of streamflow on changes in maximum daily particulate chromium loads in the A, former Rockdale Pond and B, Rice City Pond impoundments on the Blackstone River, Massachusetts, during high-flow events in water year 2008........................................................................................................................64 19. Graphs showing the effects of streamflow on changes in maximum daily particulate phosphorus loads in the A, former Rockdale Pond and B, Rice City Pond impoundments on the Blackstone River, Massachusetts, during high-flow events in water year 2008........................................................................................................................65
viii
20. Graphs showing the effects of streamflow on changes in maximum daily suspended sediment loads in the A, former Rockdale Pond and B, Rice City Pond impoundments on the Blackstone River, Massachusetts, during high-flow events in water year 2008........................................................................................................................65
Tables
1. Monitoring stations in the Blackstone River Basin, Massachusetts and Rhode Island, and data-collection information........................................................................6 2. Water-quality constituents in quality-assurance blank and replicate samples and relative percent differences between environmental-sample concentrations (composites) and replicate samples for the Blackstone River Basin in Massachusetts and Rhode Island............................................................................................14 3. Loads of total nitrogen, total phosphorus, and suspended sediment at stream monitoring stations and wastewater treatment plants from 2-week composite samples in the Blackstone River Basin, Massachusetts and Rhode Island, from 2007 to 2009...................................................................................................................................72 4. Estimated loads of total nitrogen, total phosphorus, and suspended sediment at stream monitoring stations and wastewater treatment plants from 2-week composite samples in the Blackstone River Basin, Massachusetts and Rhode Island, from 2007 to 2009...................................................................................................................................33 5. Estimated net change in total nitrogen loads along reaches of the main stem Blackstone River between Millbury, Massachusetts and Pawtucket, Rhode Island, from 2007 to 2009..........................................................................................................................37 6. Estimated total annual loads of nutrients, suspended sediment, and selected trace elements in the Blackstone River at Millville, Massachusetts, in water years 2008 and 2009.........................................................................................................................................40 7. Loads of selected trace elements from 2-week composite samples collected at monitoring stations in the Blackstone River at Millville, Massachusetts, and Pawtucket, Rhode Island, in 2007 and 2008.............................................................................47 8. Variables of linear regression equations for constituent loads and measured turbidity for four streamflow and water-quality-monitoring stations on the Blackstone River, Massachusetts, during water year 2008.................................................56
ix
Conversion Factors Inch/Pound to International System of Units
Multiply
By
To obtain
Length inch (in.)
2.54
inch (in.)
25.4
centimeter (cm) millimeter (mm)
foot (ft)
0.3048
meter (m)
mile (mi)
1.609
kilometer (km)
Area square mile (mi2) square mile (mi2)
259.0 2.590
hectare (ha) square kilometer (km2)
Volume gallon (gal)
3.785
liter (L)
gallon (gal)
0.003785
cubic meter (m3)
gallon (gal)
3.785
cubic decimeter (dm3)
million gallons (Mgal) cubic foot (ft ) 3
cubic foot (ft3)
3,785 28.32 0.02832
cubic meter (m3) cubic decimeter (dm3) cubic meter (m3)
Flow rate foot per second (ft/s)
0.3048
meter per second (m/s)
cubic foot per second (ft3/s)
0.02832
cubic meter per second (m3/s)
Mass ounce, avoirdupois (oz) pound, avoirdupois (lb)
28.35 0.4536
gram (g) kilogram (kg)
Temperature in degrees Celsius (°C) may be converted to degrees Fahrenheit (°F) as °F = (1.8 × °C) + 32. Temperature in degrees Fahrenheit (°F) may be converted to degrees Celsius (°C) as °C = (°F – 32) / 1.8.
Datum Vertical coordinate information is referenced to the North American Vertical Datum of 1988 (NAVD 88). Horizontal coordinate information is referenced to the North American Datum of 1983 (NAD 83).
x
Abbreviations BFI
base-flow index
EWI
equal-width increment
FNU
formazin nephelometric unit
MassDEP
Massachusetts Department of Environmental Protection
NWQL
National Water Quality Laboratory
R 2
coefficient of determination
UBWPAD
Upper Blackstone Water Pollution Abatement District
USGS
U.S. Geological Survey
Nutrient, Suspended Sediment, and Trace Element Loads in the Blackstone River Basin in Massachusetts and Rhode Island, 2007 to 2009 By Marc J. Zimmerman, Marcus C. Waldron, and Leslie A. DeSimone
Abstract Nutrients, suspended sediment, and trace element loads in the Blackstone River and selected tributaries were estimated from composite water-quality samples in order to better understand the distribution and sources of these constituents in the river basin. The flow-proportional composite waterquality samples were collected during sequential 2-week periods at six stations along the river’s main stem, at three stations on tributaries, and at four wastewater treatment plants in the Massachusetts segment of the basin from June 2007 to September 2009. Samples were collected at an additional station on the Blackstone River near the mouth in Pawtucket, Rhode Island, from September 2008 to September 2009. The flow-proportional composite samples were used to estimate average daily loads during the sampling periods; annual loads for water years 2008 and 2009 also were estimated for the monitoring station on the Blackstone River near the Massachusetts-Rhode Island border. The effects of hydrologic conditions and net attenuation of nitrogen were investigated for loads in the Massachusetts segment of the basin. Sediment resuspension and contaminant loading dynamics were evaluated in two Blackstone River impoundments, the former Rockdale Pond (a breached impoundment) and Rice City Pond. Total nitrogen and phosphorus loads along the Blackstone River in Massachusetts showed similar general patterns during the sampling periods monitored in this study. Total nitrogen loads were relatively low at the farthest upstream monitoring station in Millbury, Massachusetts (typically less than 430 kilograms per day (kg/d) for total nitrogen and 37 kg/d for total phosphorus). Loads typically increased (5- to 10-fold for nitrogen and 6- to 15-fold for phosphorus) downstream from the first, large wastewater treatment plant along the river, the Upper Blackstone Water Pollution Control Abatement District in Millbury. Further downstream, total nitrogen and phosphorus loads remained elevated but variable (typically about 1,000 to 3,000 kg/d for nitrogen and about 100 to 370 kg/d for phosphorus) from Millbury to the Massachusetts-Rhode Island border near Millville, Mass. Monitored tributaries of the Blackstone River and wastewater
treatment plants other than the Upper Blackstone Water Pollution Control Abatement District rarely contributed more than a small fraction of the total nitrogen and phosphorus loads observed at the main stem monitoring stations. Loads of suspended sediment also were substantially larger along the river’s main stem than in tributaries during most sampling periods. Very large loads of suspended sediment from the West River tributary during several sampling periods may have been associated with flood-control operations. The estimated annual load of total nitrogen in the Blackstone River at Millville, about 1.3 miles upstream from the Massachusetts-Rhode Island border, was 936,000 kilograms (kg) (2,600 kg/d) in water year 2008 and 878,000 kg (2,400 kg/d) in water year 2009. The estimated annual load of total phosphorus at Millville was 81,400 kg in water year 2008 (223 kg/d) and 80,900 kg (222 kg/d) in water year 2009. The estimated annual load of suspended sediment in was 4,940,000 kg (13,600 kg/d) in water year 2008 and 7,040,000 kg (19,300 kg/d) in water year 2009. The higher load in water year 2009 likely reflects several large storms in summer 2009, which resulted in streamflows in the Blackstone River that were 10 times the typical July flows. Loads of total nitrogen, total phosphorus, and trace elements were almost always lower in the Blackstone River at Millville than in the river near its mouth at the Pawtucket monitoring station, when loads were monitored at both stations in the latter part of water year 2008 and in water year 2009. Loads of suspended sediment at Millville and Pawtucket varied by about the same range, but were usually lower at Pawtucket than at Millville. Total nitrogen loads were higher during sampling periods when the base-flow contribution to streamflow was substantially less than the runoff contribution than in sampling periods when the base-flow dominated. During these sampling periods when the runoff component of streamflow was relatively large, loads of total nitrogen in wastewater discharge from Upper Blackstone Water Pollution Control Abatement District also were high but also constituted smaller fractions of the total nitrogen loads in the river. Nitrogen attenuation may have occurred during some sampling periods, based on net changes in total nitrogen load between consecutive monitoring stations, especially in the Blackstone River reach between the South Grafton and Uxbridge monitoring stations.
2 Nutrient, Suspended Sediment, and Trace Element Loads in the Blackstone River Basin in Mass. and R.I., 2007 to 2009 Analysis of the representative constituents (total phosphorus, total chromium, and suspended sediment) upstream and downstream of impoundments indicated that the existing impoundments, such as Rice City Pond, can be sources of particulate contaminant loads in the Blackstone River. Loads of particulate phosphorus, particulate chromium, and suspended sediment were consistently higher downstream from Rice City Pond than upstream during high-flow events, and there was a positive, linear relation between streamflow and changes in these constituents from upstream to downstream of the impoundment. Thus, particulate contaminants were mobilized from Rice City Pond during high-flow events and transported downstream. In contrast, downstream loads of particulate phosphorus, particulate chromium, and suspended sediment were generally lower than or equal to upstream loads for the former Rockdale Pond impoundment. Sediments associated with the former impoundment at Rockdale Pond, breached in the late 1960s, did not appear to be mobilized during the highflow events monitored during this study.
Introduction The Blackstone River Basin in central Massachusetts and Rhode Island comprises an area of 475 square miles (mi2) and includes one of New England’s largest cities, Worcester, Massachusetts (fig. 1). From its origin near Worcester, the river flows 48 miles (mi) through Woonsocket and Pawtucket, Rhode Island, before discharging into Narragansett Bay. The river basin has a long history of contamination, dating back to the industrial revolution. Improved infrastructure and wastewater treatment have resulted in improved water quality, but the river’s water quality is still categorized as impaired along its entire length (Massachusetts Department of Environmental Protection, 2010; Massachusetts Executive Office of Energy and Environmental Affairs, 2015). English settlers colonized the Blackstone River Valley in the 17th century (Kerr, 1990). The landscape and hydrology of the river basin were conducive hydropower development and, as a consequence, to industrialization; cotton mills came first, followed by factories that processed cotton cloth and that built supporting machinery or that just needed readily accessible hydropower. In addition to providing the power that mills and other factories required, the river also served as an open sewer for the wastes that were created by industry and the burgeoning population. The disposal of cotton dyes, industrial wastes, and sewage in the river left behind contaminated sediments containing toxic organic chemicals and metals. Improvements to infrastructure and to wastewater treatment, especially after the passage of the Clean Water Act (33 U.S.C. §1251 et seq.) in 1972, have reduced point- and nonpoint-source contaminant loadings that are eventually transported by the river to Narragansett Bay (Rhode Island Department of Environmental Management, 1998). Loads are currently being reduced through wastewater treatment plant
upgrades, but reductions in contaminant loadings are still needed to achieve water-quality goals (U.S. Environmental Protection Agency, 2007; Upper Blackstone Water Pollution Abatement District, 2012, 2013; Massachusetts Executive Office of Energy and Environmental Affairs, 2015). Nutrients may contribute to eutrophication in the Blackstone River and Narragansett Bay, and trace elements may have toxic effects on aquatic organisms in the Blackstone River. In order to better focus reduction efforts, more detailed information is needed about loadings to the Blackstone River and its major tributaries. To address this need, the Massachusetts Department of Environmental Protection (MassDEP) and the U.S. Geological Survey (USGS) initiated a cooperative study of nutrient, suspended sediment, and trace element loads in the Blackstone River in 2006. The overall objectives of the study were to (1) determine the magnitude and spatial and temporal patterns of nutrient, suspended sediment, and trace element loads in the Massachusetts and Rhode Island segments of the Blackstone River and (2) quantify the transport of nutrients and trace elements from Massachusetts to Rhode Island and to Narragansett Bay. Within the context of those objectives, expanded investigations were undertaken to evaluate nitrogen-attenuation throughout the Blackstone River Basin and to assess resuspension and transport of nutrients, suspended sediment, and trace elements from two main stem impoundments.
Previous Studies Numerous studies of historical contamination in the Blackstone River have been undertaken. McGinn (1981) outlined plans for dredging sediments and testing samples for toxic trace elements and organic compounds. Izbicki (1993) described the results of a 3-year study of the Blackstone’s stratified-drift aquifers, surface-water and groundwater quality, and the effect of induced infiltration from the river on the quality of well-water supplies. Surface-water-quality data were tabulated by Izbicki (1993) but not discussed in detail. Wright and others (2001) reported the results of detailed investigations of water quality during the summer, dry-season, low-flow months of July and August 1991. The study included results of monitoring the chemistry and toxicity of discharges to the river, river-water and sediment quality, and an evaluation of the biological communities. Surface-water chemistry was found to have minimal toxic effects on test organisms, but the sediments showed substantial toxic effects. Excessive nutrients and trace elements were identified as primary causes of poor water quality in the Blackstone River and Narragansett Bay; the Upper Blackstone Water Pollution Abatement District (UBWPAD), a wastewater treatment plant, was found to be the largest source of nitrate, regardless of flow conditions, and the largest source of phosphorus under dry-weather conditions. Wet-weather runoff generally coincided with the largest loads of contaminants. The urban center of Worcester, in the river’s
Introduction 3 71°50'
71°40'
71°30'
71°20'
EXPLANATION
West Boylston
42° 20'
Blackstone River watershed boundary
Boylston
Holden
Wastewater treatment plant (WWTP) Streamflow or water-quality monitoring station
Paxton Worcester
Leicester
Long-term continuous streamflow
Shrewsbury
Upper Blackstone Water Pollution Abatement District
Continuous turbidity
Flow-proportional water-quality sampling
01109659 Blackstone River Millbury upstream
Auburn
Grafton
01109730 Blackstone River Millbury downstream
01110095 Quinsigamond River Grafton WWTP
Millbury
Upton
01109852 Blackstone River Wilkinsonville
42° 10'
Continuous streamflow
MASSACHUSETTS
01110400 Blackstone River South Grafton Milford
01110500 Rockdale Pond downstream Sutton
Northbridge
Northbridge WWTP
Hopedale
01110530 Rice City Pond upstream
Oxford
01110535 Rice City Pond downstream Mendon
01111050 Mumford River
01111208 West River
Uxbridge
01111212 Blackstone River Uxbridge
Bellingham
Millville
Douglas
Blackstone
Uxbridge WWTP 01111230 Blackstone River Millville 42°
Wrentham Plainville
Woonsocket North Smithfield Cumberland
CONNECTICUT
Burrillville
North Attleboro
Lincoln
Attleboro
Glocester
01113895 Blackstone River Pawtucket 73°
72°
71°
70°
RHODE ISLAND
43°
41° 50'
MASSACHUSETTS
Worcester 42°
Providence
Providence Boston
0 0
2 2
4 4
6
6 8
8
10 MILES
10 KILOMETERS
RHODE ISLAND
41°
Base from U.S. Geological Survey and Massachusetts Office of Geographic Information digital data, 2014 Massachusetts State Plane Coordinate System, mainland zone
Figure 1. The Blackstone River Basin in Massachusetts and Rhode Island.
Narragansett Bay
Pawtucket
4 Nutrient, Suspended Sediment, and Trace Element Loads in the Blackstone River Basin in Mass. and R.I., 2007 to 2009 headwaters, contributed substantially to loads of trace element contaminants in stormwater runoff. The MassDEP has evaluated the status of water-quality conditions in the Blackstone River watershed with respect to designated uses (Massachusetts Department of Environmental Protection, 2010). The report by MassDEP consists of an extensive, but not all-inclusive, list of water bodies in the watershed and observations of water-quality conditions, based on sampling conducted primarily in 2003. The University of Massachusetts initiated a study of water quality in the Blackstone River in 2004, which included water-quality modeling for the period 1996 through 2008 (Upper Blackstone Water Pollution Abatement District, 2012, 2013; Water Resources Research Center, 2015, and references therein). In 2009, Parker and others (2011) performed a time-oftravel study to determine how long it takes for water to travel 45 mi from near the river’s headwaters in Worcester to the mouth at the head of tide in Pawtucket. Under low to moderate streamflow of about 200 cubic feet per second (ft3/s), the travel time from Worcester (near the town boundary with Millbury) to the head of tide in Pawtucket was slightly less than 1 week (about 163 hours); the travel time from Worcester to the Massachusetts-Rhode Island State boundary (Millville station) was about 3 days.
Study Area To take into consideration the major sources and transport of nutrients, suspended sediment, and trace elements in the Massachusetts segment of the Blackstone River, the main study area extended from a location immediately upstream from the UBWPAD to Millville close to the border with Rhode Island (fig. 1). Water-quality samples were collected at nine monitoring stations along the river’s main stem in Massachusetts (table 1). Water-quality measurements from three tributaries, the West, Mumford, and Quinsigamond Rivers, draining 127 mi2, also were included in the study, as were data from wastewater treatment plants in Millbury, Grafton, Northbridge, and Uxbridge, Mass. From September 2008 through September 2009, with the addition of a monitoring station on the Blackstone River at Pawtucket, the study area was expanded to include the river segment between Millville and Pawtucket. Inclusion of tributaries to the Blackstone River in Rhode Island was beyond the scope this study.
Purpose and Scope This report describes loads of nutrients, suspended sediment, and trace elements in the Blackstone River between May 2007 and September 2009. Loads of total and dissolved nutrients, suspended sediment, and selected trace elements (cadmium, chromium, copper, lead, nickel, and zinc) at the boundary between Massachusetts and Rhode Island (Blackstone River Millville station) are described for the
complete 2008 and 2009 water years.1 Loads of total nitrogen, total phosphorus, suspended sediment, and the same trace elements at Pawtucket, R.I., are described for parts of 2008 and 2009. Within the Massachusetts segment of the basin, upstream of the State boundary, loads of total and dissolved nutrients and suspended sediment are described for parts of water years 2008 and 2009 at monitoring stations along the Blackstone River and along its tributaries. Loads at Massachusetts stations upstream of the State boundary are based on about 26 2-week composite samples collected during spring, summer and early fall seasons (late March through September); loads at the Millville station are based on 57 2-week composite samples collected year round; loads at the Pawtucket station are based on 14 2-week composite samples. The effects of hydrologic conditions and net attenuation of nitrogen loads are also described for loads in the Massachusetts segment of the basin. Finally, the report describes a detailed investigation of the potential for resuspension and transport of constituent loads from impoundments on the river, using Rice City Pond and the former Rockdale Pond as study areas.
Methods An automated sampling system, designed and built by the USGS, collected nutrient, suspended sediment, and trace element samples for use in estimating loads entering and leaving the Massachusetts segment of the Blackstone River. Flow-proportional, water-quality samples of total and dissolved constituents were collected and composited during approximately 2-week periods at multiple locations along the Blackstone River and some of its tributaries (fig. 2; table 1) to improve understanding of temporal and spatial loading patterns. Because of highly variable chemical-constituent concentrations associated with treatment-plant operations and stormwater runoff, these sampling approaches were particularly important for estimating loads in the Blackstone River basin. Wooden or metal shelters housed instrumentation (fig. 3) to monitor river stage and to collect samples. The shelters contained digital data loggers with data-storage modules that recorded and stored all generated data, automated sampling devices for collecting water samples, and telephone-modem systems to allow near-real-time reporting of provisional stage, discharge, and times of sample collection to the Northborough, Mass., office of the USGS New England Water Science Center. Sealed, rechargeable, 26-ampere-hour batteries powered the instrumentation. Municipal power supplies or solar power maintained battery charges. A water year is a continuous period from October 1 through September 30 and is designated by the year in which it ends. 1
Methods 5
Measuring Streamflow During the study period, streamflow was measured at 12 locations in Massachusetts and 1 in Rhode Island (figs. 1 and 2; table 1) by measuring river stage every 15 minutes by means of a pressure transducer connected to a data logger. Stage measurements were used to compute streamflow by means of stage-to-discharge relations (or ratings) that were developed with periodic manual measurements of stage and discharge every 6 to 8 weeks made either by wading or by acoustic Doppler technology (Rantz and others, 1982; Kennedy, 1984; Turnipseed and Sauer, 2010). At the Blackstone River Millville monitoring station (01111230), low stream velocities prevented accurate measurements of streamflow using standard USGS streamflow measuring protocols (Rantz and others, 1982). For this reason, streamflow was not measured at this station but was estimated using streamflow data from the Blackstone River Rt. 122 Uxbridge monitoring station (01111212), about 3.5 mi upstream and the drainage-area ratio method; to trigger sampling, a telephone-modem system communicated information between the two stations.
Automated, Flow-Proportional, Water-Quality Sampling Flow-proportional, water-quality samples for chemical analysis were collected at 10 monitoring stations, using either automated sampling devices designed and built by the USGS for this study (fig. 3) or commercially available, automatic samplers (Teledyne Isco model 6700). Flowproportional samples are composited from subsamples collected at frequencies that are proportional to streamflow; more subsamples are collected during periods of high flow and fewer are collected during periods of low flow to yield a composite sample that is representative of the total volume of water flowing past the sampling station during the time period of sampling. For the most part, samples were collected and composited over approximately 2-week periods. Sample collection took place in spring, summer, and early fall (late March through September) at 9 of the 10 monitoring stations where flow-proportional composite sampling was conducted (fig. 4; table 1), and year-round at Millville, near the Massachusetts-Rhode Island border. From the project’s start in May 2007 through late May 2008, sample collection at the nine part-year monitoring stations took place for 2-week periods followed by 2-week periods when there was no sample collection. Starting in late May 2008, 2-week sampling periods in spring, summer, and early fall were continuous, without being broken by intervening periods when there was no sampling. Samples generally were not collected from October through February at the part-year monitoring stations. Sample collection at Millville was, by design, essentially continuous, interrupted only by problems related to logistics. Overall during the study, about 26 2-week composite samples were
collected at most main stem and tributary monitoring stations; 57 and 14 2-week composite samples were collected at the Millville (01111230) and Pawtucket (01113895) stations, respectively, on the main stem Blackstone River. Total and dissolved nutrient, suspended sediment, and trace element loads to the Blackstone River were monitored from May 2007 through September 2009, but not all constituents were measured at all stations at all times (table 1; appendixes 1 and 2). Nutrients and suspended sediments were measured at all monitoring stations during the study period. Trace elements were measured at Millville, near the Massachusetts-Rhode Island border, and at Pawtucket near the river’s outlet to Narragansett Bay to compare loads entering and leaving Rhode Island. Trace elements were measured at four additional stations located upstream and downstream of two impoundments in Massachusetts to evaluate the potential for resuspension and transport of trace elements under different streamflow conditions (appendixes 3 and 4). Nutrient, suspended sediment, and trace element samples were collected at the Pawtucket (01113895) station in September and October 2008 and May through September 2009. Water-quality samples were collected by means of automated sampling equipment at time increments determined by the volume of water that passed by the station (trigger volume), which was calculated from measurements of stage using a stage-to-discharge relation. Water samples were collected incrementally during the 2-week period and composited automatically into large sample-collection bottles in the field. To estimate trigger volumes for each 2-week period, the likely effects of runoff on streamflow were predicted using local weather forecasts and real-time streamflow information. The targeted sampling rate was five samples per day. The trigger volume varied throughout the year with the seasonal variations in streamflow and base flow. The equipment was designed to collect and composite separate sets of nutrient and trace element samples for base-flow and storm-flow conditions, which were operationally defined as times of little to no change in stage and times of rapidly changing stage, respectively. However, taking into account flow regulation, seasonal changes in base flow, and seasonal differences in the relations between rainfall and runoff, the flows that were originally defined as storm flows could not, in reality, be ascribed to storms; therefore, rather than report separate storm- and base-flow loads in this report, storm- and base-flow loads were summed to yield a single estimate of total load during each 2-week compositing period. The sampling sequence triggered by the data logger was as follows: (1) determine the flow condition (base or storm flow); (2) calculate that the trigger volume had been reached; (3) collect three equal, sequential volumes of water (about 100 milliliters [mL] each), the first of which was filtered through a large-capacity 0.45-micrometer (µm) capsule filter; (4) composite each sample into its proper bottle; and (5) back flush the sample line. Each of the three sequential samples was deposited into one of three large polyethylene sample-collection bottles—one for whole-water chemical
6 Nutrient, Suspended Sediment, and Trace Element Loads in the Blackstone River Basin in Mass. and R.I., 2007 to 2009 Table 1. Monitoring stations in the Blackstone River Basin, Massachusetts and Rhode Island, and data-collection information. [USGS, U.S. Geological Survey; ID, identification number; River mile, distance upstream from river mouth; DO, dissolved oxygen; WWTP, wastewater treatment X, method was used; NA, not available]
USGS station ID
Station name
Description of station location
Latitude (decimal degrees)
Longitude (decimal degrees)
River mile
01109659
Blackstone River Millbury upstream
Railroad yard at intersection of Route 146 and I-90, Millbury, MA
42.20833
-71.78222
44.7
01109730
Blackstone River Millbury downstream
West Main Street, Millbury, MA
42.18898
-71.76507
42.0
01109852
Blackstone River Wilkinsonville
Depot Road, Wilkinsonville village, Sutton, MA
42.17722
-71.72056
38.6
01110095
Quinsigamond River
Pleasant Street, Grafton, MA
42.19861
-71.69361
36.8
01110400
Blackstone River South Grafton (Rockdale Pond upstream)
Upstream of Rockdale Pond, Fairview Cemetery, 0.8 miles downstream of Depot Street, South Grafton, MA
42.16528
-71.67167
34.0
01110500
Rockdale Pond downstream
Downstream of Rockdale Pond on the Blackstone River, Sutton Street, Northbridge, MA
42.15371
-71.65201
32.6
01110530
Rice City Pond upstream
Upstream of Rice City Pond on the Blackstone River, 1.2 miles upstream of East Hartford Road, Northbridge, MA
42.11167
-71.62472
29.2
01110535
Rice City Pond outlet
Downstream of Rice City Pond on the Blackstone River, East Hartford Road, Uxbridge, MA
42.09833
-71.62222
27.8
01111050
Mumford River
Depot Street, Uxbridge, MA
42.07510
-71.62479
25.9
01111208
West River
Hecla Street, Uxbridge, MA
42.07056
-71.60861
24.2
01111212
Blackstone River Uxbridge
Route 122 bridge, Uxbridge, MA
42.05482
-71.61645
23.2
01111230
Blackstone River Millville
Railroad bridge near Route 122, Millville, MA
42.02288
-71.57229
19.2
01113895
Blackstone River Pawtucket
Roosevelt Street, Pawtucket, RI
41.88871
-71.38144
2.0
420215071365301
Uxbridge WWTP
Uxbridge wastewater treatment plant
NA
NA
21.3
420647071380801
Northbridge WWTP
Northbridge wastewater treatment plant
NA
NA
29.2
421020071404401
Grafton WWTP
Grafton wastewater treatment plant
NA
NA
35.4
421241071472701
UBWPAD WWTP
Upper Blackstone Water Pollution Abatement District wastewater treatment plant
NA
NA
44.4
Methods 7
plant; UBWPAD, Upper Blackstone Water Polution Abatement District; MA, Massachusetts; RI, Rhode Island; EWI, equal width increment;
Field parameters
Nutrients
Metals Whole water (unfiltered) sample
Suspended sediment
Filtered water sample
Whole water (unfiltered) sample
X
X
X
X
X
X
X
X
X
X
X
X
X
X
X
X
X
X
X
X
X
X
9/29/2009
X
X
X
X
X
X
X
X
X
X
3/17/2008
9/22/2008
X
X
X
X
X
X
X
X
X
X
Sonde and EWI
3/18/2008
9/24/2008
X
X
X
X
X
X
X
X
X
X
Sonde and EWI
3/18/2008
9/24/2008
X
X
X
X
X
X
X
X
X
X
5/29/2007 2-week composite by automated water sampler and EWI
9/30/2009
X
X
X
X
X
X
X
5/30/2007 2-week composite by automated water sampler and EWI
9/30/2009
X
X
X
X
X
X
X
5/30/2007 2-week composite by automated water sampler and EWI
9/30/2009
X
X
X
X
X
X
X
6/4/2007 2-week composite by automated water sampler and EWI
9/30/2009
X
X
X
X
X
X
2-week composite by 9/3/2008 automated water sampler and EWI
10/1/2009
2-week composite by WWTP staff
5/23/2007
9/16/2009
X
X
X
2-week composite by WWTP staff
5/24/2007
9/16/2009
X
X
X
2-week composite by WWTP staff
5/24/2007
9/16/2009
X
X
X
2-week composite by WWTP staff
5/22/2007
9/15/2009
X
X
X
DO
Specific conductance
Water temperature
X
X
X
9/29/2009
X
X
8/28/2007 2-week composite by automated water sampler and EWI
9/29/2009
X
5/29/2007 2-week composite by automated water sampler and EWI
9/28/2009
2-week composite by auto- 8/28/2007 mated water sampler and Sonde and EWI Sonde and EWI
Ending date
pH
5/31/2007 2-week composite by automated water sampler and EWI
9/29/2009
7/24/2007 2-week composite by automated water sampler and EWI
Data collection methods
Starting date
Turbidity
X
X
Filtered water sample
X
X
X
X
X
8 Nutrient, Suspended Sediment, and Trace Element Loads in the Blackstone River Basin in Mass. and R.I., 2007 to 2009
Blackstone River
Kettle Brook Aqueduct
UBWPAD WWTP
01109659
Quinsigamond River
01109730
01109852 Mumford River
Grafton WWTP
West River
01110400
01110500
Douglas WWTP
01110095
01110530 01110535
01111050
Northbridge WWTP
01111208 Hopedale WWTP
Uxbridge WWTP
Upton WWTP
Mill River Peters River
01111212 MASSACHUSETTS
01111230
RHODE ISLAND
Branch River Woonsocket WWTP
01113895
analysis, one for filtered (or dissolved) chemical analysis, and one for determination of suspended sediment concentration. Inline filtration was used for dissolved fractions because the method reduces the potential for changes in geochemical speciation in samples held for extended periods between sample collection and processing. Sample lines entered the bottles through fittings in the caps so that there would be little evaporation during the compositing period. Whole-water- and filtered-water-sample bottles were stored in either a propaneor electric-powered refrigerator at 4 degrees Celsius (°C) plus or minus (±) 2 °C. The capsule filters were also kept in the refrigerator. A scaled-down sampling system was used at the Blackstone River Pawtucket monitoring station (01113895). Because real-time filtering was not possible, only wholewater (unfiltered) samples were collected, using methodology similar to that of upstream water-quality monitoring stations. No separate sampling of storm and base flows was conducted; samples were collected in proportion to flow to yield a single composite sample per sampling period. Samples collected at
Figure 2. The Blackstone River Basin, Massachusetts and Rhode Island, major tributaries, and wastewater treatment plants. Shown are U.S. Geological Survey streamflow and water-quality monitoring stations where nutrient and suspended sediment loads were measured (blue squares), turbidity and trace element loads were estimated (red dots, upstream and downstream of impoundments), and discharges from wastewater treatment plants (WWTPs; solid green circles) were monitored. WWTPs not monitored for the study in this report are shown as open green circles. UBWPAD, Upper Blackstone Water Pollution Abatement District wastewater treatment plant
this station were kept cool by packing the sample-collection bottle in ice that was exchanged nearly every other day. In the field, samples were preserved according to USGS protocols (Wilde and others, 2009), with slight modification. Specifically, sample-collection bottles for the collection of whole-water nutrient and trace element samples were preacidified with 4.5-normal (N) sulfuric acid (H2SO4) instead of 4.5N nitric acid (HNO3); this modification was followed to avoid contamination of the nutrient sample with nitrogen. Dissolved nutrient samples were not acidified, except at the Blackstone River Millville monitoring station during the period when trace element samples were collected. At the Blackstone River Millville station, because nutrient and trace element samples were composited in the same sample-collection bottle (and the trace element samples required acidification), dissolved nutrient and trace element samples were preacidified with 4.5N H2SO4. Water samples analyzed for suspended sediment concentration do not require preservation and were collected in unacidified, unrefrigerated sample bottles.
Methods 9
Alpha-numeric display Digital cellular modem Data logger
Relay bank
Thermal fuses NEMA enclosure
Filtering pump
Flow switch Filtered vent Level switch Volumetric holding cell
1
Pinch valve
2
Refrigerator Sampling pumps: (1) Base (low) flow (2) Storm (high) flow
Figure 3. The automated sampling system used in the Blackstone River Basin, Massachusetts and Rhode Island. NEMA, National Electrical Manufacturers Association.
10 Nutrient, Suspended Sediment, and Trace Element Loads in the Blackstone River Basin in Mass. and R.I., 2007 to 2009 A. 01109659 Blackstone River Millbury upstream
B. 01109730 Blackstone River Millbury downstream
C. 01109852 Blackstone River Wilkinsonville
D. 01110095 Quinsigamond River
E. 01110400 Blackstone River South Grafton (Rockdale Pond upstream)
F. 01110500 Rockdale Pond downstream
Figure 4. Water-quality- and streamflow-monitoring locations in the Blackstone River Basin in Massachusetts and Rhode Island.
Methods 11 G. 0111530 Rice City Pond upstream
H. 01110535 Rice City Pond outlet
I. 01111050 Mumford River
J. 01111208 West River
K. 01111212 Blackstone River Uxbridge
L. 01111230 Blackstone River Millville
Figure 4. Water-quality- and streamflow-monitoring locations in the Blackstone River Basin in Massachusetts and Rhode Island.—Continued
12 Nutrient, Suspended Sediment, and Trace Element Loads in the Blackstone River Basin in Mass. and R.I., 2007 to 2009 M. 01113895 Blackstone River Pawtucket
Figure 4. Water-quality- and streamflow-monitoring locations in the Blackstone River Basin in Massachusetts and Rhode Island. —Continued
Modifications were made to the procedures used to preserve whole-water samples during the study in response to ongoing review of analytical data for total nitrogen. Initially (June through December 2007), the volume of acid added to whole-water sample bottles was based on the bottle volume (9 liters [L]), the expectation that bottles could be filled or half-filled, depending on flow conditions, and the sample preservation requirements (1 mL of 4.5N H2SO4 in a 125-mL sample). Consequently, 72 mL (or 32 mL acid with the expectation of a half-filled bottle) was added to the wholewater sample bottles when they were deployed in the field. After several months of sample collection, it was determined that sample bottles at some stations were typically not filled at the end of the sampling period. The volume of acid added to the whole-water sample bottle was reduced by about half at some stations, to 32 mL, to avoid overacidification of the whole-water samples; this change began with some of the sample bottles deployed in January 2008. Overacidification of samples can adversely affect the alkaline-persulfate digestion method for total nitrogen analysis and result in low recovery of inorganic and organic nitrogen (Patton and Kryskalla, 2003). After further review of the analytical data for total nitrogen, the volume of added acid to whole-water sample bottles before the bottles were deployed for sample collection was further reduced to about 5 mL starting in January 2009 at all stations. After the samples were retrieved from the field, additional acid was added to these whole-water samples while monitoring pH to achieve the desired level of acidification (pH less than 2). The volume of acid added to samples starting in January 2009 was typically about 0.5 percent of the total sample volume. After approximately 14 days, water-quality samples were retrieved by the USGS, stored on ice, and transported
to the Northborough office of the USGS New England Water Science Center. Whole-water, filtered, and suspended sediment base- and storm-flow samples were processed separately. Each sample was subsampled (or split) into appropriate sample bottles as needed to meet requirements for laboratory analysis. Nutrient and trace element samples were split using a polyethylene churn; suspended sediment samples were split using a polycarbonate cone splitter. After processing, samples for analysis of nutrients, trace elements (cadmium, chromium, copper, lead, nickel, and zinc), calcium, magnesium, and specific conductance samples were shipped overnight to the USGS National Water Quality Laboratory (NWQL) in Denver, Colorado; suspended sediment samples were shipped to the USGS Sediment Laboratory in Louisville, Kentucky. Analytical methods are described in Fishman and Friedman (1989), Fishman (1993), Garbarino and Struzeski (1998), Patton and Kryskalla (2003), and Shreve and Downs (2005).
Data Collection for Turbidity Instrumentation used to monitor turbidity at four of the streamflow and water-quality monitoring stations consisted of Eureka Manta 2 multiparameter sondes with wiper-equipped McVan turbidity sensors. The sensors used monochrome near infrared (780–900 nanometer [nm]) light projected from light-emitting diodes (LED) at a 90-degree (°) ±2.5° angle and measured turbidity in formazin nephelometric units (FNU). Turbidity was recorded at intervals of 15 minutes. The sensors were calibrated in the laboratory, and the calibration was checked and adjusted if necessary in the field approximately every 6 weeks during the study period in accordance with
Methods 13 USGS protocols (Anderson, 2005; Wagner and others, 2006) and manufacturer’s specifications.
Manual Water-Quality Sampling Equal-width increment (EWI) samples for nutrients, suspended sediment, and trace elements were collected manually according to USGS protocols (U.S. Geological Survey, 2006) at the monitoring stations upstream and downstream of impoundments at stations 01110400, 01110500, 01110530, and 0111535 (table 1) for the resuspension study. EWI and concurrent point samples (nine pairs of samples, one to two per station) also were collected at stream monitoring stations over a range of flow conditions; the point samples were collected from the intake of the automatic sampler at a single point in time. The EWI and point samples were collected concurrently to ensure that the point samples represent the entire cross section of the river. Most constituent concentration measurements (80 percent) were in good agreement, with relative percent differences between analytical results in EWI and point measurements of less than 20 percent (appendix 2).
Wastewater Effluent Sampling Wastewater effluent samples were collected in 2007, 2008, and 2009, from four wastewater treatment plants that discharge in the Blackstone River Basin in the study area (fig. 1)—the UBWPAD in Millbury and the Grafton, Northbridge, and Uxbridge wastewater treatment plants. Samples were collected to yield a 2-week composite sample of effluent discharge that was timed to match the sampling periods at stream monitoring stations. Eighteen samples at each wastewater treatment plant were collected, for a total of 72 samples (appendix 5). For 14 consecutive days each month, treatment-plant operators collected two 500-mL wastewater effluent samples each day. Sample bottles were supplied to plant operators by the USGS. The sample bottles for total nitrogen and total phosphorus analyses were preacidified with 3 mL of 4.5N H2SO4. Immediately following collection, samples were refrigerated. The samples collected at the UBWPAD were samples from a daily, flow-composited sample, whereas samples collected at the other treatment plants were grab samples, which were assumed to represent each day’s discharge. After 14 days, the daily flow-proportional samples from the wastewater treatment plants were collected by USGS staff and transported on ice to the USGS laboratory in Northborough. In the laboratory, subsamples (volumes of water from each 125 mL daily sample bottle) were collected from sample bottles and manually composited to provide samples representative of the 2-week sampling period; the volume of the subsample each day was proportional to daily wastewater treatment plant discharges, as a fraction of the total wastewater treatment plant discharge during the 2-week sampling period. Flow-proportional volumes were determined
from daily discharge volumes, which were written on each sample bottle at the time of collection by the treatment-plant operators. Subsamples were collected from each acidified wastewater effluent sample bottle and composited directly in 125-mL polyethylene bottles. Subsamples were collected from each unacidified wastewater effluent sample bottle and composited in 3-L polyethylene bottles; the resulting composited sample was then filtered through a 0.45-µm filter and a 125-mL polyethylene bottle was filled with the filtered, composited sample. After processing, nutrient samples were shipped overnight to the NWQL for analysis. Water-quality samples were not collected at the Woonsocket wastewater treatment plant for this study (fig. 2). Concentration and discharge data provided by the Woonsocket wastewater treatment plant were used to estimate constituent loads from this facility.
Quality-Control Sampling and Data This section describes the results of quality-control sampling, including blank and replicate samples, and an investigation into the effects of the 2-week in situ holding time. Quality-control sampling was based on a quality assurance project plan developed before data collection (Robert F. Breault and Kim Campo, U.S. Geological Survey, written commun., 2007).
Blank and Replicate Quality-Control Samples Fifteen equipment and (or) preservation blank samples were analyzed to investigate the potential for contamination from the sampling equipment or acid used in sample preservation. The blanks were collected by pouring distilled water or distilled blank water to which preservation acid had been added into composite sample collection bottles and then processed following the procedures described previously for environmental samples. Blanks for wastewater treatment plant samples were poured into four to five wastewater sample collection bottles and composited, as were the daily wastewater samples. All blank samples were collected and processed in the Northborough laboratory. After processing, blank samples were shipped to the NWQL for analysis, as were environmental samples. Results showed that a large majority of the analyses did not have detections of any of the analytes and most of the concentrations of analytes that were detected in blank samples were less than or at their method detection levels (table 2A). Four analytes were detected in the blank sample associated with the UBWPAD on May 22, 2008; however, the sample bottle used for this blank sample was not rinsed with 5 percent hydrochloric acid, a requirement by USGS protocols (Wilde, 2004). Among the three trace element blanks, two had analyte detections that exceeded the method detection levels. Trace elements were not detected in the third sample.
01109659
01109730
01109852
01110400
01111050
01111208
01111212
01111230
01111230
01111230
01111230
420647071380801
421241071472701
421241071472701
Blank
Blank
Blank
Blank
Blank
Blank
Blank
Blank
Blank
Blank
Blank
Blank
Blank
Blank
UBWPAD wastewater treatment plant
UBWPAD wastewater treatment plant
Northbridge wastewater treatment plant
Blackstone River Millville
Blackstone River Millville
Blackstone River Millville
Blackstone River Millville
Blackstone River Uxbridge
West River
Mumford River
Blackstone River South Grafton
Blackstone River Wilkinsonville
Blackstone River Millbury downstream
Blackstone River Millbury upstream
Blackstone River Millbury upstream
Station name
a
Date
15:24
16:30
19:44
13:59
10:09
11:59
Time
13:59
14:00
5/22/2008
5/23/2007
9/17/2008
1/14/2009
7/8/2008
12:00
12:00
11:59
12:00
14:04
10/23/2007 08:59
6/4/2007
5/26/2009
10/22/2007 16:39
7/8/2008
4/15/2009
6/24/2008
8/19/2008
6/9/2009
6/11/2008
Sample bottles were not rinsed with a 5 percent hydrochloric acid solution.
01109659
USGS station ID
Blank
Qualitycontrol sample type