Preventive Nutrition: The Comprehensive Guide for Health Professionals, Third Edition, ...... protein-calorie malnutrition soon replaced protein malnutrition [141]. ...... Bose A, Coles CL, Gunavathi, John H, Moses P, Raghupathy P, Kirubakaran ...
Nutrition and Health in Developing Countries Second Edition
Nutrition and Health Series Adrianne Bendich, PhD, FACN, Series Editor
Recent Volumes Handbook of Nutrition and Pregnancy, edited by Carol J. Lammi-Keefe, Sarah Collins Couch, and Elliot H. Philipson, 2008 Nutrition and Health in Developing Countries, Second Edition, edited by Richard D. Semba and Martin W. Bloem, 2008 Nutrition and Rheumatic Disease, edited by Laura A. Coleman, 2008 Nutrition in Kidney Disease, edited by Laura D. Byham-Gray, Jerrilynn D. Burrowes, and Glenn M. Chertow, 2008 Handbook of Nutrition and Ophthalmology, edited by Richard D. Semba, 2007 Adipose Tissue and Adipokines in Health and Disease, edited by Giamila Fantuzzi and Theodore Mazzone, 2007 Nutritional Health: Strategies for Disease Prevention, Second Edition, edited by Norman J. Temple, Ted Wilson, and David R. Jacobs, Jr., 2006 Nutrients, Stress, and Medical Disorders, edited by Shlomo Yehuda and David I. Mostofsky, 2006 Calcium in Human Health, edited by Connie M. Weaver and Robert P. Heaney, 2006 Preventive Nutrition: The Comprehensive Guide for Health Professionals, Third Edition, edited by Adrianne Bendich and Richard J. Deckelbaum, 2005 The Management of Eating Disorders and Obesity, Second Edition, edited by David J. Goldstein, 2005 Nutrition and Oral Medicine, edited by Riva Touger-Decker, David A. Sirois, and Connie C. Mobley, 2005 IGF and Nutrition in Health and Disease, edited by M. Sue Houston, Jeffrey M. P. Holly, and Eva L. Feldman, 2005 Epilepsy and the Ketogenic Diet, edited by Carl E. Stafstrom and Jong M. Rho, 2004 Handbook of Drug–Nutrient Interactions, edited by Joseph I. Boullata and Vincent T. Armenti, 2004 Nutrition and Bone Health, edited by Michael F. Holick and Bess Dawson-Hughes, 2004 Diet and Human Immune Function, edited by David A. Hughes, L. Gail Darlington, and Adrianne Bendich, 2004 Beverages in Nutrition and Health, edited by Ted Wilson and Norman J. Temple, 2004 Handbook of Clinical Nutrition and Aging, edited by Connie Watkins Bales and Christine Seel Ritchie, 2004 Fatty Acids: Physiological and Behavioral Functions, edited by David I. Mostofsky, Shlomo Yehuda, and Norman Salem, Jr., 2001 Nutrition and Health in Developing Countries, edited by Richard D. Semba and Martin W. Bloem, 2001 Preventive Nutrition: The Comprehensive Guide for Health Professionals, Second Edition, edited by Adrianne Bendich and Richard J. Deckelbaum, 2001 Nutritional Health: Strategies for Disease Prevention, edited by Ted Wilson and Norman J. Temple, 2001 Clinical Nutrition of the Essential Trace Elements and Minerals: The Guide for Health Professionals, edited by John D. Bogden and Leslie M. Klevey, 2000 Primary and Secondary Preventive Nutrition, edited by Adrianne Bendich and Richard J. Deckelbaum, 2000 The Management of Eating Disorders and Obesity, edited by David J. Goldstein, 1999 Vitamin D: Physiology, Molecular Biology, and Clinical Applications, edited by Michael F. Holick, 1999 Preventive Nutrition: The Comprehensive Guide for Health Professionals, edited by Adrianne Bendich and Richard J. Deckelbaum, 1997
Nutrition and Health in Developing Countries Second Edition Editors Richard D. Semba, MD, MPH Department of Ophthalmology, Johns Hopkins University School of Medicine, Baltimore, MD USA
Martin W. Bloem, MD, PhD Nutrition and HIV/AIDS Policy, United Nations World Food Programme, Rome, Italy, Department of International Health, Johns Hopkins Bloomberg School of Public Health, Baltimore, MD, Friedman School of Nutrition Science and Policy, Tufts University, Boston, MA
Foreword by Peter Piot, MD, PhD Executive Director UNAIDS, and Under Secretary-General of the United Nations
Editors Richard D. Semba, MD, MPH Department of Ophthalmology, Johns Hopkins University School of Medicine, Baltimore, MD USA
Series Editor Adrianne Bendich, PhD, FACN GlaxoSmithKline Consumer Healthcare Parsippany, NJ USA
Martin W. Bloem, MD, PhD Nutrition and HIV/AIDS Policy, United Nations World Food Programme, Rome, Italy, Department of International Health, Johns Hopkins Bloomberg School of Public Health, Baltimore, MD, Friedman School of Nutrition Science and Policy, Tufts University, Boston, MA
e-ISBN: 978-1-59745-464-3 ISBN: 978-1-934115-24-4 DOI: 10.1007/978-1-59745-464-3 Library of Congress Control Number: 2008922756 © 2008 Humana Press, a part of Springer Science + Business Media, LLC All rights reserved. This work may not be translated or copied in whole or in part without the written permission of the publisher (Humana Press, 999 Riverview Drive, Suite 208, Totowa, NJ 07512 USA), except for brief excerpts in connection with reviews or scholarly analysis. Use in connection with any form of information storage and retrieval, electronic adaptation, computer software, or by similar or dissimilar methodology now known or hereafter developed is forbidden. The use in this publication of trade names, trademarks, service marks, and similar terms, even if they are not identified as such, is not to be taken as an expression of opinion as to whether or not they are subject to proprietary rights. While the advice and information in this book are believed to be true and accurate at the date of going to press, neither the authors nor the editors nor the publisher can accept any legal responsibility for any errors or omissions that may be made. The publisher makes no warranty, express or implied, with respect to the material contained herein. Printed on acid-free paper 9 8 7 6 5 4 3 2 1 springer.com
Dedication
To our parents, who struggled to bring a better life for the next generation: Hannah Semba and the late Thomas T. Semba, Japanese Americans interned in the Tule Lake and Heart Mountain “relocation” camps, and Alexander and Jacqueline Bloem, Dutch Indonesians and survivors of the Sumatra railway “work camp,” the Kramat camp, and the sinking of the Junyo Maru by the British submarine HMS Tradewind off the west coast of Sumatra.
“This page left intentionally blank.”
Series Editor’s Introduction
The Nutrition and Health™ series of books, as an overriding mission, provide health professionals with texts that are considered essential because each includes (1) a synthesis of the state of the science; (2) timely, in-depth reviews by the leading researchers in their respective fields; (3) extensive, up-to-date, fully annotated reference lists; (4) a detailed index; (5) relevant tables and figures; (6) identification of paradigm shifts and the consequences; (7) virtually no overlap of information between chapters, but targeted, inter-chapter referrals; (8) suggestions of areas for future research; and (9) balanced, datadriven answers to patient/health professionals questions, which are based upon the totality of evidence rather than the findings of any single study. The series volumes are not the outcome of a symposium. Rather, each editor has the potential to examine a chosen area with a broad perspective, both in subject matter as well as in the choice of chapter authors. The international perspective, especially with regard to public health initiatives, is emphasized where appropriate. The editors, whose trainings are both research and practice oriented, have the opportunity to develop a primary objective for their book; define the scope and focus, and then invite the leading authorities from around the world to be part of their initiative. The authors are encouraged to provide an overview of the field, discuss their own research, and relate the research findings to potential human health consequences. Because each book is developed de novo, the chapters are coordinated so that the resulting volume imparts greater knowledge than the sum of the information contained in the individual chapters. A key objective of the series is to develop volumes that reviewers indicate offer great value to the reader. One consequence of the favorable reviews that have followed publication of books in the series to date is the potential for the publishing of updated, second editions, lending further credence to the reviewers’ assessments. Nutrition and Health in Developing Countries, Second Edition, edited by Richard D. Semba and Martin W. Bloem, is an excellent example of the development of a second edition based upon the value that readers and reviewers found in the first edition, and thus there is real anticipation of this critically important updated and greatly enhanced second edition. This is the 25th volume to be published as part of the Nutrition and Health series and fully exemplifies the series’ goals. The first volume of Nutrition and Health in Developing Countries, edited by Richard D. Semba and Martin W. Bloem, represented the most comprehensive overview of the state of the science in international nutrition available in 2001. The volume reflected the extensive field as well as laboratory bench expertise of both world-renown editors and their in-depth knowledge of the interactions of nutritional status and its impact on global health. The first volume contained outstanding chapters that reviewers praised because of the significant insights into biological as well as public health issues concerning, as
vii
viii
Series Editor’s Introduction
examples, food availability, nutrient function, disease consequences, and health policy issues. Nutrition and Health in Developing Countries, Second Edition is especially timely as the first volume was published before the advent of many of the major natural disasters that have severely affected the nutritional status of many populations already documented to be at high risk of under-nutrition. Moreover, new serious diseases have been identified, including severe acute respiratory syndrome (SARS), and these novel infectious organisms, as opportunistic pathogens, cause illness in the weak and malnourished that further debilitates these populations. The second edition is comprised of 34 chapters and contains 12 new chapters that focus on information about the consequences of natural disasters, such as the Indian Ocean tsunami in 2004, where 1.7 million people were displaced and emerging infections, such as SARS and bird flu, that have the potential to be transmitted rapidly from developing nations to the rest of the world. There are also new chapters dealing with nutrition in the elderly, nutritional consequences of tobacco, industrialization of food production and retail sales and impact on health, the effects of multi-micronutrient supplementation programs, nutrition surveillance programs and policy issues, and of great interest, the ethics of clinical nutrition research in developing countries. All of the 22 chapters that were included in the First Edition have been significantly updated and enhanced in the Second Edition. Thus, the benchmark status of the First Edition has been raised to an even higher level and the Second Edition continues to provide clear, objective documentation of the nutritional status of populations and the effects of nutritional interventions on the health and well-being of affected populations in developing countries. Dr. Richard D. Semba and Dr. Martin W. Bloem, who have edited both the First and Second Editions, are internationally recognized leaders in the fields of clinical nutrition, ophthalmology, and immunology research. Both editors are physicians and each has also completed further advanced degrees. Dr. Semba, MD, MPH, is the W. Richard Green Professor of Ophthalmology at the Wilmer Eye Institute at Johns Hopkins University and is a global leader in nutrition research who has published extensively on the role of vitamin A deficiency in childhood blindness. Dr. Bloem, MD, PhD, is Chief of Nutrition Service, United Nations World Food Program in Rome, Italy, and previously served as the Chief Medical Officer for Helen Keller International. Each has extensive experience in academic medicine as well as in-depth field experiences, and collectively they have over 300 professional publications and numerous awards for their efforts to improve the nutrition of those with the greatest needs around the world. The Second Edition is organized as a stand-alone text that provides the historic beginnings of public health nutritional interventions in developing nations, assessment of the current nutritional status of the populations across the lifespan, examines the macro as well as the micronutrient intakes of at-risk populations, and discusses the clinical research that has contributed to the acceptance by governments of intervention programs to improve the health of their nations. In addition, recommendations for future research are provided and targeted to those at greatest risk for malnutrition including infants, toddlers, women of childbearing age, pregnant and lactating women, and the elderly. Of importance, the area of obesity in developing countries is also explored as the number of overweight and obese malnourished children has continued to grow over the past decade. The Second Edition almost doubles the size of the original volume and contains 34 extensive, in-depth chapters covering the most important aspects of the complex inter-
Series Editor’s Introduction
ix
actions between diet, under-nutrition, obesity patterns around the world, infections, immune function, and the mental, physical, as well as the genetic consequences of malnutrition throughout the lifespan. The editors have chosen 44 well-recognized and respected chapter authors from 14 countries who have included complete definitions of terms with the abbreviations fully defined for the reader and who use terms consistently between chapters. The volume concentrates on the examination of the major health and nutrition-related problems seen in developing countries and the population groups most affected. There are separate chapters on maternal mortality, low birth weight and perinatal mortality, infant mortality and child growth and development, as well as the new chapter that concentrates on the elderly. Other chapters include well-organized, updated information on malaria, tuberculosis, HIV, measles, diarrheal diseases, and acute lower respiratory tract infections and the populations at greatest risk for these adverse health conditions. Separate chapters are devoted to vitamin A, vitamin D, iron, iodine, zinc, multiple micronutrient deficiencies, as well as overall macronutrient under-nutrition. There are critical reviews of the current and future scenarios that include the shifting importance between underand over-nutrition (obesity), rural to urban shifts in populations, increased exposure to environmental hazards including pollution, food- and water-borne contaminants and pathogens, and others that are affected by changes in socioeconomic factors. Finally, there are critical insights into the relevance of nutritional interventions and ethical considerations in the conduct of studies in developing countries. Relevant chapters include a systematic cost-effectiveness analysis of intervention programs and the difficulties of both implementing as well as then analyzing the effectiveness of nutrition programs. The remaining chapters place in perspective the multifaceted requirements to affect global policies, even in areas of agreement, such as the improvement of the nutritional status of individuals at greatest risk in developing countries. Readers will benefit greatly from the 96 well-organized tables and 125 relevant figures and over 4600 references that are cited in this comprehensive volume. Nutrition and Health in Developing Countries, Second Edition edited by Richard D. Semba and Martin W. Bloem, stands as the most comprehensive reference text in the field, and provides health professionals at all levels of care as well as policy makers and program designers and implementers with balanced, referenced facts and data on which to base sound recommendations. This volume is of equal importance in the education of the next generation of health care professionals interested in improving global health, as nutrition remains the key to success. I applaud the efforts of the editors as they have developed the most authoritative resource published to date. This excellent text is a very welcome addition to the Nutrition and Health Series. Adrianne Bendich, PhD, FACN, Series Editor
“This page left intentionally blank.”
Foreword
With the threat of a global recession and major climate-related disasters looming large in the popular media, society as a whole faces the danger of losing sight of key problems that underlie much of the potential social damage from such crises—problems, such as those relating to nutrition and health in developing countries, that persist and hinder the achievement of the Millennium Development Goals (MDGs). Global health and nutrition problems can only be solved through a firm understanding of the various levels of causality and the interactions between their various determinants. This second edition of Nutrition and Health in Developing Countries, which contains new chapters on humanitarian emergencies, food in humanitarian relief, food policy, the emerging role of supermarkets in developing countries, homestead food production, aging, ethics, and the adverse impact of parental tobacco use, reflects the transitions and increasing complexity in developing countries. Among the major problems facing the world today is AIDS. As I stated in 2007, the AIDS epidemic is not done yet, but is still expanding and globalizing. It is a disease that was not even known 26 years ago but is now the leading cause of death in Africa and the fifth leading cause of death in the world, after heart diseases, all cancers, strokes, and respiratory illness. Throughout the world, more women are becoming infected with HIV. Where AIDS has severely affected human and social capital, development has not only stagnated, it has reversed, threatening the very future of vulnerable populations. While we have gained scientific understanding on the biological and social drivers of the AIDS epidemic, and solutions are available to deal with the disease itself as well as conditions arising from it, there is still a great need for increased investment and focused spending on evidence-informed strategies for HIV prevention and for impact mitigation. The global problem of AIDS is not just a medical or public health problem any more than climate change is just an environmental problem. Like most of the world’s major problems, AIDS presents a social challenge—a problem of how people relate to other people and how these relations have shaped economic, sexual health, and other important individual and collective choices. Accordingly, effective solutions must be developed with a view to addressing all the aspects we now know to be important—access to antiretroviral therapies, gender equality and women’s empowerment, poverty alleviation, food and nutrition security, and other key factors that can lead to the eradication of the disease worldwide. We have also seen how successes in HIV prevention and treatment lead to increased uptake of other health services and therefore improved health and well being. This means greater investments are needed to strengthen health systems and human resources
xi
xii
Foreword
for health as well as the capacity of local communities to respond given that prevention efforts are happening largely outside the health sector. In this volume, readers will find many of the same authors from the first edition and some new ones. The commonality they share is the diversity of their backgrounds: clinical nutrition, medicine, immunology, infectious disease, epidemiology, public health nutrition, anthropology, health policy, economics, and disaster planning. The breadth of knowledge and information in this book should stimulate fresh thinking, comprehensive and effective policies and programs, and continued research across disciplines toward the goal of improving health and nutrition in developing countries. This will bring us steps closer to our wider goals of solving major humanitarian crises such as AIDS and achieving the vision of the world set forth in the MDGs. Peter Piot, MD, Phd Executive Director, UNAIDS Under Secretary-General of the United Nations
Preface
Nutrition and Health in Developing Countries, Second Edition, was written with the underlying conviction that global health and nutrition problems can be solved only through a firm understanding of the different levels of causality and the interactions between the various determinants. Although the book focuses on the problems in developing countries, we recognize that as a result of globalization, there is no longer a clear distinction between health and nutrition problems between the developed and the lessdeveloped world. Emerging diseases such as HIV/AIDS, tuberculosis, and obesity show how the world is connected, and that knowledge about health and nutrition problems is also essential for professionals in developed countries. The objective of Nutrition and Health in Developing Countries, Second Edition, is to provide policymakers, nutritionists, students, scientists, and professionals with the most recent and up-to-date knowledge regarding major health and nutritional problems in developing countries. This specific knowledge is presented to facilitate an integrated approach to health research, programs, and policy. As such, the approach represents the tension inherent in combining diverse disciplines. This book is meant as a synthesis, and it is not meant as an exhaustive treatise of all infectious diseases or every nutrient deficiency in developing countries as such information is generally accessible in other textbooks. We have greatly expanded the second edition to 34 chapters and have included new chapters relevant to humanitarian emergencies, including a case study of the Indian Ocean tsunami in 2004, food in humanitarian relief, food policy, the emerging role of supermarkets in developing countries, homestead food production, aging, ethics, and the adverse impact of parental tobacco use on child health in poor families. These new chapters reflect the increasing complexity and changes that are occurring in developing countries. The Millennium Development Goals of the United Nations call for major progress in eradicating extreme poverty and hunger, in reducing child mortality, and in improving maternal health; we hope that these chapters provide insight and solutions that will help to attain these goals. Nutrition and Health in Developing Countries, Second Edition, begins with a historical overview of the idea of nutrition and development, and shows how the concepts of progress and development evolved from the Enlightenment and shaped the basic precepts underlying work in nutrition and public health for the last two centuries. Many people working in public health may be impressed by the conditions often found in developing xiii
xiv
Preface
countries today: high infant mortality, widespread malnutrition, goiter, tuberculosis, and other health problems. However, similar conditions were faced by public health and policy makers in the early 20th century in Europe and the United States. A better understanding of nutrition and implementation of this new knowledge into policy helped to eradicate many nutritional and infectious diseases. An appreciation of these historical examples may help avoid “reinventing the wheel,” a phenomenon apparent in some nutrition and health research conducted in developing countries today. The first section of Nutrition and Health in Developing Countries, Second Edition, focuses on the major health indicators in developing countries: maternal mortality, low birth weight, neonatal mortality, infant mortality, and child growth and development. The differences in mortality rates between developing countries and industrialized countries are presented in these chapters and are striking, with the disparity greatest for maternal mortality. In many circumstances, the application of known, effective interventions could reduce the large disparities in mortality between developed and developing countries. The second section of the book deals with major infectious diseases in which nutrition plays a role: diarrheal diseases, acute lower-respiratory infections, measles, malaria, tuberculosis, and HIV infection. There is a purposeful overlap between these chapters on specific health problems and subsequent chapters on nutritional deficiencies (e.g., the role of zinc in prevention and treatment of diarrheal diseases). This approach was used to emphasize the different perspectives that may be taken either from the standpoint of infectious disease or from a specific nutrient. In the third section of the book, the general problem of malnutrition and specific deficiencies in vitamin A, vitamin D, zinc, iron, and iodine and multiple-micronutrient deficiencies are presented. Large advances have been made in our understanding of micronutrient malnutrition in the last three decades. Vitamin A deficiency is a major cause of childhood morbidity, mortality, and blindness in developing countries, and it is apparent that many diverse approaches are needed to eliminate this problem. New research shows that zinc deficiency is widespread, and that zinc supplementation can reduce morbidity from diarrheal and respiratory diseases. Iron deficiency remains the most common micronutrient deficiency among women and children worldwide, and its reduction will be a major challenge. The elimination of iodine deficiency disorders through widespread use of iodized salt appears to be an attainable goal in the near future. As micronutrient deficiencies often occur together due to limited consumption of good dietary sources, there is a shift in focus to combating these deficiencies in combination. The fourth section of the book deals with new emerging issues of countries in an intermediate stage of development, such as the nutrition transition in which many nutritional deficiencies decline and other health problems, such as obesity, diabetes, and cardiovascular disease, become more prominent. Life expectancy is increasing in most developing countries, which raises new concerns about nutrition in older adults. Another pressing problem in developing countries is rapid urbanization, as observed in large cities such as Mexico City, Lagos, Dhaka, and Jakarta, and there are new challenges in achieving food and nutrition security in these settings. Although tobacco control has not usually been considered a problem related to child health and survival, new findings from Bangladesh, India, and Indonesia show that, among poor families, smoking diverts precious resources from food to tobacco, with an adverse impact on quality of diet and an associated higher level of child malnutrition and mortality of infants and children
Preface
xv
under 5 years old. In many countries, especially in Asia, the prevalence of smoking is 50% to 75%, which has serious implications for child health. Tobacco control is placed front and center as a child survival strategy. The fifth and final section of Nutrition and Health in Developing Countries, Second Edition, deals with special topics such as humanitarian emergencies, the role of food in humanitarian relief, homestead food production, how supermarkets are changing agricultural economics and food security, food policy, benefits of multimicronutrient supplements in children, use of nutritional surveillance data, ethics in public health research, and the Indian Ocean tsunami of 2004 as a case example of emergency relief. The book closes with a broad view on nutrition and health policy, analytical frameworks for public policy analysis, and thoughtful insight into the development and implementation of sound public policy in public health and public nutrition. During the preparation of this Second Edition, we were deeply saddened by the passing of our friend and colleague, François Delange, the Executive Director of the International Council for Control of Iodine Deficiency Disorders. He was strongly dedicated to the elimination of iodine deficiency disorders, and he will be greatly missed by the international nutrition community. We wish to thank our lovely series editor, Adrianne Bendich, for the kind support and encouragement that she has been giving us over the last decade. Her enthusiasm and breadth and depth of knowledge regarding the complex field of nutrition has been an inspiration for all of us. As editors, we are pleased to bring together this group of authors from diverse backgrounds of clinical nutrition, medicine, immunology, infectious disease, epidemiology, public health nutrition, anthropology, health policy, economics, and disaster planning. We hope that this book will stimulate further thought, comprehensive and effective policies and programs, and research across disciplines in the goal of improving health and nutrition in developing countries to reach the Millennium Development Goals by the year 2015. Richard D. Semba, MD, MPH Martin W. Bloem, MD, PhD
“This page left intentionally blank.”
Contents
Series Editor’s Introduction . . . . . . . . . . . . . . . . . . . . . . . . . . . . . . . . . . . . . . . . . . Adrianne Bendich
vii
Foreword . . . . . . . . . . . . . . . . . . . . . . . . . . . . . . . . . . . . . . . . . . . . . . . . . . . . . . . . . Peter Piot
xi
Preface. . . . . . . . . . . . . . . . . . . . . . . . . . . . . . . . . . . . . . . . . . . . . . . . . . . . . . . . . . .
xiii
Contributors . . . . . . . . . . . . . . . . . . . . . . . . . . . . . . . . . . . . . . . . . . . . . . . . . . . . . .
xxi
1
Nutrition and Development: A Historical Perspective . . . . . . . . . . . . . . . . . . Richard D. Semba
1
2
Maternal Mortality in Developing Countries . . . . . . . . . . . . . . . . . . . . . . . . . Carine Ronsmans, Simon Collin, and Véronique Filippi
33
3
Low Birth Weight and Neonatal Mortality . . . . . . . . . . . . . . . . . . . . . . . . . . . Richard D. Semba and Cesar G. Victora
63
4
Infant Mortality . . . . . . . . . . . . . . . . . . . . . . . . . . . . . . . . . . . . . . . . . . . . . . . . Parul Christian
87
5
Child Growth and Development . . . . . . . . . . . . . . . . . . . . . . . . . . . . . . . . . . . Mercedes de Onis
113
6
Diarrheal Diseases . . . . . . . . . . . . . . . . . . . . . . . . . . . . . . . . . . . . . . . . . . . . . Claudio F. Lanata and Robert E. Black
139
7
Acute Lower Respiratory Infections . . . . . . . . . . . . . . . . . . . . . . . . . . . . . . . . Claudio F. Lanata and Robert E. Black
179
8
Measles . . . . . . . . . . . . . . . . . . . . . . . . . . . . . . . . . . . . . . . . . . . . . . . . . . . . . . Gregory Hussey
215
9
Malaria and Nutrition . . . . . . . . . . . . . . . . . . . . . . . . . . . . . . . . . . . . . . . . . . . Anuraj H. Shankar
229
xvii
xviii
Contents
10
Tuberculosis . . . . . . . . . . . . . . . . . . . . . . . . . . . . . . . . . . . . . . . . . . . . . . . . . . Monique van Lettow and Christopher Whalen
275
11
Human Immunodeficiency Virus Infection. . . . . . . . . . . . . . . . . . . . . . . . . . . Eduardo Villamor, Karim Manji, and Wafaie W. Fawzi
307
12
Malnutrition . . . . . . . . . . . . . . . . . . . . . . . . . . . . . . . . . . . . . . . . . . . . . . . . . . Dirk G. Schroeder
341
13
Vitamin A Deficiency . . . . . . . . . . . . . . . . . . . . . . . . . . . . . . . . . . . . . . . . . . . Keith P. West Jr. and Ian Darnton-Hill
377
14
Nutritional Rickets and Vitamin D Deficiency . . . . . . . . . . . . . . . . . . . . . . . . John M. Pettifor
435
15
Zinc Deficiency . . . . . . . . . . . . . . . . . . . . . . . . . . . . . . . . . . . . . . . . . . . . . . . . Roger Shrimpton and Anuraj H. Shankar
455
16
Iron Deficiency and Anemia . . . . . . . . . . . . . . . . . . . . . . . . . . . . . . . . . . . . . . Usha Ramakrishnan and Richard D. Semba
479
17
Iodine Deficiency Disorders . . . . . . . . . . . . . . . . . . . . . . . . . . . . . . . . . . . . . . Richard D. Semba and François Delange
507
18
Multiple Micronutrient Malnutrition: What Can Be Done? . . . . . . . . . . . . . . Usha Ramakrishnan and Sandra L. Huffman
531
19
Nutrition in the Elderly in Developing Countries . . . . . . . . . . . . . . . . . . . . . . Noel W. Solomons and Odilia I. Bermúdez
577
20
The Nutrition Transition and Its Relationship to Demographic Change . . . . Barry M. Popkin
601
21
The Rapid Emergence of Obesity in Developing Countries . . . . . . . . . . . . . . Colleen M. Doak and Barry M. Popkin
617
22
Rapid Urbanization and the Challenges of Obtaining Food and Nutrition Security . . . . . . . . . . . . . . . . . . . . . . . . . . . . . . . . . . . . . . . . . . . Marie T. Ruel, James L. Garrett, and Lawrence Haddad
639
23
Impact of Parental Tobacco Use on Child Malnutrition and Survival . . . . . . Cora M. Best and Richard D. Semba
657
24
Humanitarian Emergencies . . . . . . . . . . . . . . . . . . . . . . . . . . . . . . . . . . . . . . . Reinhard Kaiser and Paul B. Spiegel
677
25
Tackling Nutrient Deficiencies and Life-Threatening Disease: The Role of Food in Humanitarian Relief . . . . . . . . . . . . . . . . . . . . . . . . . . . . Patrick Webb and Andrew Thorne-Lyman
699
Contents
xix
26
The Indian Ocean Tsunami of December 26, 2004 . . . . . . . . . . . . . . . . . . . . Saskia de Pee, Regina Moench-Pfanner, and Martin W. Bloem
27
The Impact of Supermarkets on Farmers, Consumers, and Food Security in Developing Countries . . . . . . . . . . . . . . . . . . . . . . . . . . C. Peter Timmer
739
Homestead Food Production for Improving Nutritional Status and Health . . . . . . . . . . . . . . . . . . . . . . . . . . . . . . . . . . . . . . . . . . . . . . Saskia de Pee, Aminuzzaman Talukder, and Martin W. Bloem
753
28
721
29
Food Policy . . . . . . . . . . . . . . . . . . . . . . . . . . . . . . . . . . . . . . . . . . . . . . . . . . . C. Peter Timmer
30
Need, Efficacy, and Effectiveness of Multiple Vitamin/Mineral Supplements for Young Children and Considerations for Programs . . . . . . . Saskia de Pee
793
How Much Do Data Influence Programs for Health and Nutrition? Experience from Health and Nutrition Surveillance Systems . . . . . . . . . . . . . Martin W. Bloem, Saskia de Pee, and Richard D. Semba
831
31
781
32
The Economics of Nutritional Interventions. . . . . . . . . . . . . . . . . . . . . . . . . . Susan Horton
859
33
Ethics in Public Health Research . . . . . . . . . . . . . . . . . . . . . . . . . . . . . . . . . . Tanya Doherty and Mickey Chopra
873
34
Beyond Partial Analysis . . . . . . . . . . . . . . . . . . . . . . . . . . . . . . . . . . . . . . . . . David Pelletier
887
Index . . . . . . . . . . . . . . . . . . . . . . . . . . . . . . . . . . . . . . . . . . . . . . . . . . . . . . . . . . . .
915
“This page left intentionally blank.”
Contributors
Cora M. Best, msc • Nutrition Service, World Food Programme, Rome, Italy Odilia I. Bermúdez, phd, mph • Nutritional Epidemiology Program, Jean Mayer USDA Human Nutrition Research Center on Aging, Tufts University, Boston, MA Robert E. Black, md, mph • Department of International Health, Johns Hopkins Bloomberg School of Public Health, Baltimore, MD Martin W. Bloem, md, phd • Nutrition Services, United Nations World Food Programme, Rome, Italy, and Department of International Health, Johns Hopkins Bloomberg School of Public Health, Baltimore, MD; and Friedman School of Nutrition Science and Policy, Tufts University, Boston, MA Mickey Chopra, bsc, bmed, msc • South African Medical Research Council, Cape Town, South Africa Parul Christian, drph • Division of Human Nutrition, Department of International Health, Johns Hopkins Bloomberg School of Public Health, Baltimore, MD Simon Collin, msc • Infectious Diseases Epidemiology Unit, Department of Epidemiology and Population Health, London School of Hygiene and Tropical Medicine, London, UK Ian Darnton-Hill, md, mph, msc • Nutrition Section, UNICEF; and Institute of Human Nutrition, College of Physicians and Surgeons, Columbia University, New York, NY François Delange, md† • International Council for Control of Iodine Deficiency Disorders, Brussels, Belgium Mercedes de Onis, md, phd • Department of Nutrition, World Health Organization, Geneva, Switzerland Saskia de Pee, phd • Nutrition Service, World Food Programme, Rome, Italy; and Friedman School of Nutrition Science and Policy, Tufts University, Boston, MA Colleen M. Doak, phd • Department of Nutrition and Health, Institute of Health Sciences, Vrije University, Amsterdam, The Netherlands Tanya Doherty, msc, mph, phd • South African Medical Research Council, Cape Town, South Africa †
Deceased xxi
xxii
Contributors
Wafaie W. Fawzi, mbbs, mph, drph • Departments of Nutrition and Epidemiology, Harvard School of Public Health, Boston, MA Véronique Filippi, ddg, disp, phd • Infectious Diseases Epidemiology Unit, Department of Epidemiology and Population Health, London School of Hygiene and Tropical Medicine, London, UK James L. Garrett, phd • Food Consumption and Nutrition Division, International Food Policy Research Institute, Washington, DC Lawrence Haddad, phd • Institute of Development Studies, University of Sussex, Brighton, UK Susan Horton, phd • Wilfrid Laurier University, Waterloo, Ontario, Canada Sandra L. Huffman, scd • Consultant, Global Alliance for Improved Nutrition, Geneva, Switzerland Gregory Hussey, mb, chb, ffch • Child Health Unit, Department of Pediatrics and Child Health, University of Cape Town, Rondebosche, Cape Town, South Africa Reinhard Kaiser, md, mph • Nairobi, Kenya Claudio F. Lanata, md, mph • Instituto de Investigacion Nutricional, Lima, Peru Karim Manji, mbbs, mmed, mph • Muhimbili University College of Medical Sciences, Dar-es-Salaam, Tanzania Regina Moench-Pfanner, msc, phd • Food Fortification Program, Global Alliance for Improved Nutrition, Geneva, Switzerland David Pelletier, phd • Division of Nutritional Science, Cornell University, Ithaca, NY John M. Pettifor, mb, bch, phd, fcpaed • Department of Paediatrics and Medical Research Council Mineral Metabolism Research Unit, University of the Witwatersrand and Chris Hani Baragwanath Hospital, Johannesburg, South Africa Barry M. Popkin, phd • Department of Nutrition, Carolina Population Center, University of North Carolina, Chapel Hill, NC Usha Ramakrishnan, phd • Department of International Health, Rollins School of Public Health, Emory University, Atlanta, GA Marie T. Ruel, phd • Food Consumption and Nutrition Division, International Food Policy Research Institute, Washington, DC Carine Ronsmans, md, dph • London School of Hygiene and Tropical Medicine, Maternal and Child Epidemiology, London, UK Dirk G. Schroeder, scd, mph • DrTango, Inc., Roswell, GA; and Hubert Department of Global Health, Rollins School of Public Health, Emory University, Atlanta, GA Richard D. Semba, md, mph • Department of Ophthalmology, Johns Hopkins University School of Medicine, Baltimore, MD Anuraj H. Shankar, scd • World Health Organization, Jakarta, Indonesia Roger Shrimpton, phd • United Nations Standing Committee on Nutrition, New York, NY; and Institute of Child Health, London, UK Noel W. Solomons, md • Center for Studies of Sensory Impairment, Aging and Metabolism (CESSIAM), Guatemala City, Guatemala Paul B. Spiegel, md, mph • United Nations High Commissioner for Refugees, Geneva, Switzerland Aminuzzaman Talukder, bsc • Helen Keller International, Phnom Penh, Cambodia C. Peter Timmer, phd • Center for Global Development, Washington, DC
Contributors
xxiii
Andrew Thorne-Lyman, mhs • Nutrition Service, World Food Programme, Rome, Italy Monique van Lettow, phd • Dignitas International, Zomba, Malawi Cesar G. Victora, md, phd • Universidade Federal de Pelotas, Pelotas, Brazil Eduardo Villamor, md, mph, drph • Departments of Nutrition and Epidemiology, Harvard School of Public Health, Boston, MA Patrick Webb, phd • Friedman School of Nutrition Science and Policy, Tufts University, Boston, MA Christopher Whalen, md • Department of Epidemiology and Biostatistics, Case Western Reserve University School of Medicine, Cleveland, OH Keith P. West, Jr., drph, mph • Division of Human Nutrition, Department of International Health, Bloomberg School of Public Health, Johns Hopkins University, Baltimore, MD
1
Nutrition and Development: A Historical Perspective Richard D. Semba
1.1
INTRODUCTION
In the last two centuries, there has been a general improvement in the health of people worldwide that has been attributed largely to changes in nutrition, hygiene, and public health. At the beginning of the 19th century, the burden of morbidity and mortality from infectious diseases such as malaria, cholera, measles, tuberculosis, and diarrheal disease and nutritional deficiency diseases such as pellagra, rickets, and vitamin A deficiency was relatively high in Europe, North America, and much of the rest of world. By the end of the 20th century, these diseases were largely eradicated from industrialized countries, but many of these diseases and their associated morbidity and mortality continue to be major problems in developing countries today. Mortality rates from infectious diseases have generally been declining in industrialized countries over the last 200 years, and improved nutrition and resistance to disease as well as better hygiene and sanitation have been cited as the main factors for a reduction in infectious disease mortality rather than technological advances in medicine [1–4]. The purpose of this chapter is to provide a brief historical overview of major ideas and events that have shaped public health over the last two centuries, with an emphasis on developments related to nutrition and infectious disease. As a concise review, this chapter is limited to selected highlights from the last 200 years; for a more detailed overview, the refer to general texts on the history of public health [5–7], medicine [8], infectious disease [9, 10], and geographical medicine [11] as well as to more specialized sources dealing with protein and energy [12], scurvy [13], pellagra [14], food [15–17], and hunger [18]. Most of this review focuses on developments in Great Britain, the United States, and France as these countries have drawn the most attention of historians of public health and nutrition.
1.2
THE IDEA OF PROGRESS IN PUBLIC HEALTH
The idea of progress in public health largely rose during the Enlightenment in France among the philosophes such as Denis Diderot (1713–1784) and Jean le Rond d’Alembert (1717–1783). Earlier antecedents were found in the methods of the French
From: Nutrition and Health: Nutrition and Health in Developing Countries, Second Edition Edited by: R. D. Semba & M. W. Bloem © Humana Press, Totowa, NJ
1
2
Semba
rationalist philosopher and mathematician René Descartes (1596–1650) [19]. Diderot and d’Alembert edited the monumental Encyclopédie, ou Dictionnaire raisonné des sciences, des arts et des métiers, which was published between 1751 and 1772. The Encyclopédie, a major work of the Enlightenment, was meant to benefit future generations with a compendium of human knowledge [20], and it included some issues relating to health, such as the duration of life, the health of infants, and growth of population. One of the greatest Encyclopedists was Marie-Jean-Antoine-Nicolas Caritat, Marquis de Condorcet (1743–1794), a French statesman, philosopher, and mathematician who wrote the Esquisse d’un tableau historique des progrès de l’esprit humain (Sketch for a History of the Progress of the Human Mind) [21]. A critic of Robespierre and the Jacobins, Condorcet had been accused of treason and was sentenced in absentia to the guillotine. During a period of hiding in Paris in 1792, Condorcet wrote the remarkable Esquisse, in which he argued for the infinite perfectability of man. Condorcet predicted that there would be equality between men and women, the abolition of war, the end of colonialism and the slave trade, more equal distribution of wealth, and the eradication of disease through progress in medical science [21]: No one can doubt that, as preventive medicine improves and food and housing become healthier, as a way of life is established that develops our physical powers by exercise without ruining them by excess, as the two most virulent causes of deterioration, misery and excessive wealth, are eliminated, the average length of human life will be increased and a better health and a stronger physical constitution will be ensured. The improvement of medical practice, which will become more efficacious with the progress of reason and of the social order, will mean the end of infectious and hereditary diseases and illnesses brought on by climate, food, or working conditions. It is reasonable to hope that all other diseases may likewise disappear as their distant causes are discovered. [22].
Condorcet’s work was published posthumously in 1795 and became a seminal work in the idea of progress in Western thought [19, 23]. The assumption that “the happiness of the human species is the most desirable object for human science to promote” was expressed by William Godwin (1756–1836) in An Enquiry Concerning Political Justice, and Its Influence on General Virtue and Happiness [24]. Godwin noted the vast inequality in property and the role of political institutions in favoring these conditions, and he envisioned a future when intellectual and moral improvement and reform of government would reduce inequality, war, and injustice. According to Godwin, the perfectability of man was intrinsic to the human species, and the political and intellectual state of man was presumed to be in a course of progressive improvement. Instead of indefinite progress, Thomas Robert Malthus (1766–1834), a British economist, predicted overpopulation, misery, famine, and war, and his views first appeared in an anonymous book, An Essay on the Principle of Population as It Affects the Future Improvement of Society, with Remarks on the Speculations of Mr. Godwin, M. Condorcet, and Other Writers, which was published in 1798 [25]. Malthus believed that the population was growing greater than the ability of the earth to provide subsistence. Preventive checks on population included moral restraint, such as the postponement of marriage and avoidance of extramarital relationships. Later, Malthus was to concede
Chapter 1 / Historical Perspective
3
that more personal and social action could prevent much of the grim scenario that he had predicted, and the debate about Malthus is frequently revived [26]. A central idea of social medicine—an outgrowth of Enlightenment thought—was that government could use medical knowledge to improve the health of the people. A comprehensive social medicine approach was described by Johann Peter Frank (1745–1821), a German physician, in System einer vollständigen medicinischen Polizey (A System of Complete Medical Police) [27]. Frank’s recommendations for sanitary, social, and economic reforms were broad and based on the idea that medical police, a benevolent form of despotism, could provide for the health and protection of the people from cradle to grave. Frank was director general of public health of Austrian Lombardy and professor of clinical medicine at the University of Padua, and his social concerns were clearly stated in his graduation address, De populorum miseria: morborum genitrice (The People’s Misery: Mother of Diseases) in 1790: Starvation and sickness are pictured on the face of the entire laboring class. You recognize it at first sight. And whoever has seen it will certainly not call any one of these people a free man. The word has become meaningless. Before sunrise, after having eaten a little and always the same unfermented bread that appeases his hunger only half-way, the farmer gets ready for hard work. With emaciated body under the hot rays of the sun he plows a soil that is not his and cultivates a vine that for him alone has no reward. His arms fall down, his dry tongue sticks to the palate, hunger is consuming him. The poor man can look forward to only a few grains of rice and a few beans soaked in water. And to this he can add only very sparingly the condiment with which nature has provided mankind in such a liberal way. … Scarcity of food, however, and a quality of food that has no nutritional value make the citizens physically unfit for any sustained effort and predispose them for catching any matter of diseases. The weaker the organism and the more exhausted from troubles the human machine is, the sooner miasmas and contagions penetrate it like a dry sponge. Hence famine—sterility of the fields increased under an unfortunate constellation—is immediately followed by epidemics in the provinces. [28].
Among the myriad recommendations made by Frank in the System were that wells and springs used by the public should be examined regularly, and that rivers and ponds be kept clean and protected against sewage, industrial discharges, and refuse. The police were to be responsible for ensuring that an abundant and pure food supply was available, and observations were to be made whether certain kinds of foods eaten by different classes might predispose to serious ills or greater mortality. Frank also emphasized the importance of breast-feeding of infants. Although Frank’s work on “medical police” was considered somewhat outmoded by the time it was completely published, it was influential in setting a standard for broad approaches to public health [29]. The underlying theme of this book—nutrition and health in developing countries— implies the prevailing model, which is inextricably tied to the parlance of “developing” and “developed” countries. This model for development implies that knowledge is cumulative and that progress in nutrition and health generally proceeds in a linear fashion in which the world is destined for improved nutrition, better health, more equity, and greater justice. Such precepts are implicit in the mission of large organizations such as the United Nations Children’s Fund, the World Health Organization (WHO), the United
4
Semba
States Agency for International Development, the Overseas Development Agency, the World Bank, and the Food and Agricultural Organization (FAO).
1.3
THE RISE OF STATISTICS AND PROBABILITY
The importance of keeping statistical records of health problems, including births, deaths, and other statistics relating to population, was emphasized by William Petty (1623–1687), an economist and physician, and John Graunt (1620–1674), a merchant, in England [30, 31]. In this early work on vital statistics, Graunt used detailed parish records to show the major causes of death, that mortality rates were higher in urban than rural areas, that more boys are born than girls, and that death rates varied by season [32]. Early attempts to enumerate all births and deaths and determine total population were undertaken in Sweden in the middle of the 18th century, and other efforts were made in France and Holland [33]. The use of “political arithmetic,” or “the art of reasoning by figures upon things relating to government” [34], continued into the 19th century. By 1836, the registration of births, marriages, and deaths had been made compulsory in England, and William Farr (1807–1883), a physician and compiler of abstracts in the registrar general’s office, became an advocate for social reform using statistics. Farr used life tables, an innovation introduced by the English astronomer Edmund Halley (1656–1742) [35], to show the relative health of districts, and infant mortality rates were used as a primary indicator of health [36]. Better statistics would help improve health and assist in the efforts of preventive medicine, and Farr assigned a greater role in public health to physicians [37]: It has been shown that external agents have as great an influence on the frequency of sickness as on its fatality; the obvious corollary is, that man has as much power to prevent as to cure disease. That prevention is better than cure, is a proverb; that it is as easy, the facts we had advanced establish. Yet medical men, the guardians of public health, never have their attention called to the prevention of sickness; it forms no part of their education. To promote health is apparently contrary to their interests: the public do not seek the shield of medical art against disease, nor call the surgeon, till the arrows of death already rankle in the veins. This may be corrected by modifying the present system of medical education, and the manner of remunerating medical men. Public health may be promoted by placing the medical institutions of the country on a liberal scientific basis; by medical societies co-operating to collect statistical observations; and by medical writers renouncing the notion that a science can be founded upon the limited experience of an individual. Practical medicine cannot be taught in books; the science of medicine cannot be acquired in the sick room.
Vital statistics were also examined by Adolphe Quetelet (1796–1874), a Belgian astronomer and mathematician, who showed that the distribution of observations around a mean could be expressed as the distribution of probabilities on a probability curve. In Sur l’homme et le développement de ses facultés, ou Essai d’une physique sociale (On Man and the Development of his Faculties: An Essay on Social Physics), Quetelet investigated different aspects of “social physics,” such as birth and death, height and weight, health and disease. In this work, he elaborated the important concept that the average man, or l’homme moyen, could be expressed mathematically [38]. Statistics became the means to study the condition of the population, especially the working
Chapter 1 / Historical Perspective
5
classes, and early Victorian Britain saw the formation of the Statistical Society of Manchester in 1833 and the Statistical Society of London in 1834 [39]. Modern mathematical statistics arose largely from biometry in the late 19th century [40]. Francis Galton (1822–1911), an English scientist and explorer of Africa, originated the concepts of regression and correlation, tools that were being developed to study heredity [41]. Karl Pearson (1857–1936), a statistician at University College, London, continued to study the concepts of variation, correlation, and probability, and he introduced the term standard deviation in 1893 and defined the correlation coefficient mathematically in 1896 [42]. Other important developments in statistics were the χ2 test in 1900, and the t test and its distribution was defined by W. S. Gosset (Student) in 1908 [43]. Analysis of variance derives from an article by Ronald A. Fisher (1890–1962), a British geneticist and statistician, in 1918. An important development in statistical methods was the integration of statistics with experimental design in The Design of Experiments by Fisher, in which the idea of randomization was promoted in experimental design [44]. The idea of alternative hypotheses and two types of error was developed in the late 1920s [45] and was important in the determination of sample size and power calculations for experimental studies. The concepts of randomization, sample size and power, and placebo controls helped to refine the controlled clinical trial as the basis for scientific evaluation of new therapies [46].
1.4
EARLY FOUNDATIONS OF PREVENTIVE MEDICINE
The modern movement in preventive medicine and public health largely began in France in the first half of the 19th century, largely inspired by the Enlightenment approach to health and disease [47, 48]. Louis René Villermé (1782–1863) used a numerical approach to show that there was a large gap in health between the rich and poor. Villermé was a former French army surgeon who was familiar with the psychological and social consequences of famine during the war [49]. Shortly after leaving the military, Villermé showed, in a large demographic study of Paris, Recherches statistiques sur la ville de Paris (Statistical Researches in the City of Paris), that mortality rates were highest in the poorest arrondissements, or districts, and lowest in the wealthy arrondissements [50]. Thus, the differences between the rich and poor clearly extended far beyond financial position into matters of life and death. Louis François Benoiston de Châteauneuf (1776–1862), a physician and contemporary of Villermé, showed that there were large differences in diet in Paris [51], and the differences in diet became incorporated into sociomedical investigations of mortality [52]. According to Villermé [53], famine was followed by epidemics, and the poor were always hit the hardest by hunger and epidemics. He argued that a high state of civilization reduces epidemics and called for reforms so that people would be protected against the high price of food, which, for the poor, meant the same as famine. Some of Villermé’s and Benoiston’s work appeared in France’s first journal of public health, Annales d’hygiène publique et de médecine légale, founded in 1829. In 1840, the appalling health conditions of textile workers were reported by Villermé [54], leading to a law the following year limiting child labor in France. In the kingdom of Naples, an important early survey was conducted in 1811 by the government of Joachim Murat (1767–1815) that addressed the relationship between
6
Semba
nutrition and disease [55, 56]. In 1765, a year after a terrible famine killed thousands in the kingdom of Naples, Antonio Genovesi (1713–1769), a local leader of the Enlightenment, expressed the proto-Malthusian idea that an equilibrium exists between the population of the state and the availability of resources [57]. An attempt was made to address such a relationship in a survey, which showed that there was widespread nutritional deprivation in the kingdom, especially in rural areas. In one area, famine was so common it was said that “tanto li contadini che li artieri pria degli occhi, aprono la bocca (upon awakening peasants and workers alike open their mouths before they open their eyes).” This survey was an early analysis of the mutual relationships among environmental, social variables, nutrition, and public health, and nutritional deprivation was identified as a main factor predisposing to disease [56].
1.5
THE SANITARY IDEA
During the early industrialization of England, Jeremy Bentham (1748–1832), a writer on jurisprudence and utilitarian ethics, expressed the belief that laws should be socially useful and that actions should support “the happiness of the greatest number”[58]. Edwin Chadwick (1800–1890), a follower of Bentham, became secretary of the Royal Commission to investigate the Elizabethan Poor Laws, legislation from the early 17th century in which relief for the indigent was to be provided by the local parish, and employment of the poor was provided by workhouses. As the population grew, the problems of urban overcrowding and deterioration of food, sanitation, and housing became a major crisis by the 19th century. In 1842, Chadwick published a report on the Sanitary Condition of the Labouring Population of Great Britain, which described the unsanitary living conditions among the poor [59]. As in Villermé’s report, higher mortality was shown among the poorer classes than among the wealthy classes. The report recommended that the highest priority be given to practical measures such as drainage, removal of refuse, and improvement in the water supply, and it was emphasized that much disease among the poor could be prevented by public health measures. As Chadwick put it, “all smell is disease” [60]. Legislation followed in the wake of the report, including the British Public Health Act (1848), which established a general board of health, and legislation aimed at food adulteration, regulation of slaughterhouses and other trades, water supplies, and sewers. The sanitary movement in the United States largely echoed the efforts in France and England. In 1850, a major plan for public health, Report of the Sanitary Commission of Massachusetts, was presented to the government of Massachusetts state by Lemuel Shattuck (1793–1859), a teacher, bookseller, and genealogist [61]. The report reviewed the sanitary movement abroad and in the United States, reviewed disease in the state of Massachusetts, and made recommendations for promotion of public health through creation of state and local boards of health; conduct of a regular census; better collection of vital statistics; improved sanitation, water, and housing; and other measures. The main basis for the report was that “measures for prevention will effect infinitely more, than remedies for the cure of disease.” Although Shattuck was unable to have many of the recommendations enacted into law immediately, the report was a harbinger for a comprehensive public health policy in the United States.
Chapter 1 / Historical Perspective
7
The first census in the United States by the federal government took place in 1790, and a nationwide census was decreed in the constitution to occur every 10 years [62]. In Great Britain, the first nationwide census was undertaken in 1801, and periodic national censuses gained authority in France after 1840 [52]. National registration systems and their vital statistics were used to bring attention to problems in public health in Europe, Great Britain, and the United States, and a greater need for accurate statistics was noted after the arrival of the worldwide cholera pandemics in the mid-19th century [63].
1.6
CONTAGION VERSUS MIASMA
By the 19th century, epidemics of plague were gone from Europe, but other epidemic diseases such as scarlet fever, typhoid, typhus, and measles continued in outbreaks. Malaria was present in both Europe and the United States, and yellow fever was present in the south of the United States. Great pandemics of cholera swept large parts of the world in dates approximating 1817–1823, 1826–1837, 1846–1863, 1865–1875 [64], and later. The theory that epidemic disease was caused by miasmas rising from decaying organic matter was a dominant belief in the middle of the 19th century and a strong impetus behind the reforms of the sanitarians [6, 9]. Another major theory of epidemic disease was the contagionist theory, in which an animate organism caused disease and was spread by personto-person contact [65, 66]. Further credence to the contagionist theory was provided by epidemiological studies of measles, cholera, diphtheria, and typhoid fever. A measles epidemic affected the Faroe Islands in 1846, and a medical commission was sent by the Danish government to investigate. The commission included two Danish physicians who had just finished medical school, 26-year-old Peter Ludwig Panum (1820–1885) and 25-year-old August Henrik Manicus (1821–1850). In what is considered a classic study in epidemiology [9], Panum described the incubation period of measles and noted that transmission of measles was through person-to-person contact [67]. He noted that measles attacked individuals of all ages, but those with a history of a previous attack of measles from a previous epidemic in 1781 were immune. Manicus observed that mortality was highest in a village that had the greatest poverty and poor diet, and he noted that diarrheal disease was mild among well-to-do islanders but was severe and persistent in the poorer villages [68]. Both Panum and Manicus concluded that measles was contagious and not miasmatic in origin. Other studies that further may have changed perceptions about the contagiousness of disease were an investigation of cholera in London by John Snow (1813–1858), an English physician and anesthetist [69], and investigations of cholera by William Budd (1811–1880), a physician in Bristol. Budd thought that cholera was caused by a specific living organism that was found in the human intestinal tract and was spread through contaminated drinking water [70]. During the cholera epidemic of 1854 in London, Snow demonstrated that the number of deaths from cholera was related to the amount of pollution from the Thames River among the different private companies supplying drinking water. Nearly all the victims had used water from the Broad Street pump in Soho. Snow concluded that cholera was carried in water contaminated by excreta of cholera patients, and that cholera was transmitted by ingestion of contaminated water and food and not through miasmata. Snow persuaded the local authorities to remove the handle from the Broad Street pump—presumably averting further deaths—but the epidemic was already in decline.
8
Semba
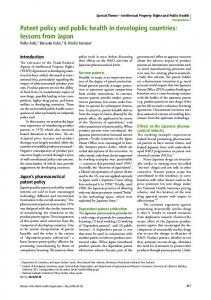
Fig. 1.1. A Monster Soup Commonly Called Thames Water, by William Heath (1795–1840), circa 1828. Philadelphia Museum of Art: Gift of Mrs. William Horstmann. Reproduced with permission.
The contamination of the Thames by sewage and industrial waste was acknowledged by a London commission in 1828 and became the subject of satire (Fig. 1.1). The Metropolis Water Act of 1852 required London water companies to draw their water supplies from cleaner nontidal reaches of the Thames and to filter all water supplies for domestic use [71]; the cholera outbreak of 1854 occurred before all companies could comply with the 1852 act. The findings of Snow and Budd regarding the contagious nature of cholera did not lead to a sudden revolution in water science as has been generally believed [72, 73], but these studies gave additional weight to the contagion theory. In the ensuing years, many international experts continued to hang on to the idea that miasmas were the cause of cholera [74]. Other detailed investigations that reinforced the contagion theory of epidemic disease were those of diphtheria by Pierre Fidèle Bretonneau (1778–1862), a physician in Tours, France [75], and of typhoid fever by William Budd [76].
1.7
ADVANCES IN MICROBIOLOGY
A further foundation for microbiological investigations was laid by Jacob Henle (1809–1885), a pathologist in Zurich, who thought that conclusive proof for an organism being responsible for a disease required three conditions: constant presence of the parasite, isolation from foreign admixtures, and reproduction of the disease with the isolated parasite [77]. These postulates were further developed by his student, Robert Koch (1843–1910) [78]. Louis Pasteur (1822–1895), a French chemist and microbiologist, further elaborated the germ theory of disease through broad studies that included the fermentation of beer and wine and diseases of silkworms. The last quarter of the 19th century was characterized by a rapid period of microbiological investigations, during which descriptions were made of the organisms responsible for anthrax [79], malaria [80], tuberculosis [81], and cholera [82]. Other organisms, including streptococcus,
Chapter 1 / Historical Perspective
9
staphylococcus, Escherichia coli, the organisms responsible for leprosy and diphtheria, and Yersinia were described, and investigation was facilitated by the development of new staining techniques and culture media [5, 65]. Strategies to control infectious diseases by the turn of the century included reporting of cases, isolation of affected individuals, and disinfection of the premises. Compulsory notification of infectious diseases was enacted in London, Berlin, and Paris within the last quarter of the 19th century [83]. The ways in which diseases could be transmitted through contaminated water, ice, milk, and uncooked food were outlined by William Sedgwick (1855–1921), a biologist [84]. In 1887, the first systematic monitoring of the public water supply in the United States was conducted by Sedgwick for the Massachusetts Board of Health, and his techniques for measurement and filtration of bacteria in the water supply became a standard for the country. In his influential treatise, The Sources and Modes of Infection [85], Charles V. Chapin (1856–1941), the superintendent of health in Providence, Rhode Island, emphasized the role of the carrier and further clarified the idea that diseases could be transmitted through lack of hygiene, by direct and indirect contact, by fomites, through the air, in food and drink, and by insects.
1.8
NUTRITIONAL SCIENCE IN THE 19TH CENTURY
Modern nutritional science has early roots in experimental physiology in France at the beginning of the 19th century, when ideas surrounding nutrition were subjected to examination by animal experimentation [86]. François Magendie (1783–1855), professor of anatomy at the Collège de France, attempted to differentiate between various kinds of food and made a clear distinction between nitrogenous and nonnitrogenous foods [87]. In an early experiment that hinted at the existence of vitamin A, Magendie found that dogs fed only sugar and distilled water developed corneal ulcers and died [88]. The importance of nitrogenous foods was further recognized by Gerrit Jan Mulder (1802–1880), a Dutch physiological chemist, who coined the term protein to describe nitrogenous substances in plants and animal foods [89]. The German chemist Justus von Liebig (1803–1873) considered food to be divided into “plastic” foods (plant and animal proteins) and “respiratory” foods (carbohydrates and fat). Liebig’s main doctrine was that protein was used to build up the organism or repair tissues, whereas carbohydrates and fats served as fuels to facilitate the respiratory process [90]. The definition of food was further refined by Carl von Voit (1831–1908), a physiologist in Munich: “The foodstuffs are those substances which bring about the deposition of a substance essential to the composition of the body, or diminish and avert the loss thereof” [91]. A former pupil of Voit’s, Wilbur Olin Atwater (1844–1907) conducted investigations into the caloric value of food using a bomb calorimeter and derived food and nutrient composition for an “average diet”; the energy-yielding functions of food were emphasized [92]. By the end of the 19th century, the prevailing notion was that food consisted of proteins, carbohydrates, fats, salts, and water. Improved nutrition was considered to strengthen resistance to disease, and Germain Sée (1818–1896), a French physician, made dietary recommendations for individuals with specific diseases [93]. The influence of Liebig and Voit could be seen in some approaches; sufficient nourishment was thought to prevent “tissue waste” during a fever. Milk was given paramount importance as a dietary [94]. Modern knowledge of nutrition was used to recommend diets for institutions such as schools, hospitals, prisons, and asylums. Special diets high in milk, whey, and egg yolk were recommended for certain
10
Semba
diseases [95]. In the early 20th century, influential textbooks in nutrition put heavy emphasis on the caloric value of food for human health [96, 97].
1.9
INFANT MORTALITY AND SOCIAL REFORM
In the late 18th century, infant mortality became the target of social reform in France, England, and the United States [98, 99]. A major cause of infant mortality was diarrheal disease, which often occurred in epidemic proportions during the summer
Fig. 1.2. Epidemics of diarrheal disease in Paris described by Newman in 1906. Adapted from ref. 100.
Chapter 1 / Historical Perspective
11
in cities of England, Europe, and the United States. Using data from Paris (Fig. 1.2) and Finsbury, a poor area of England’s Bedfordshire where he worked as medical officer of health, George Newman (1870–1948), argued that breast-fed infants suffered less from summer diarrhea than infants who were fed artificial formula or cow’s milk [100]. The high infant mortality rate was considered to be mainly a problem of motherhood, and he emphasized proper training of mothers and promotion of breastfeeding. Newman argued that the infant mortality rate was gauge of the health of a community, not the general death rate, and he considered it a sign of social degeneration that Great Britain should have a falling overall death rate but little change in the infant mortality rate over the proceeding 50 years. Arthur Newsholme (1857–1943), Newman, and others [101] implicated fecal contamination of food and milk in the epidemics of summer diarrhea [102]. Similar concerns over infant mortality were voiced in Europe and the United States and led to the formation of national and international organizations devoted to the study and prevention of infant mortality, including the Ligue Française contre Mortalité Infantile (1902), the German Union for the Protection of Infants (1908), and the American Association for the Study and Prevention of Infant Mortality (1910). Among the measures sought by these groups were the education of mothers, the promotion of breast-feeding, improved prenatal care, and widespread gathering and compilation of vital statistics [98, 99]. Testing of the milk supply in large cities had revealed high bacterial counts in milk, and reform was aimed at providing a more pure milk supply through pasteurization [98].
1.10
THE EMERGENCE OF THE VITAMINS
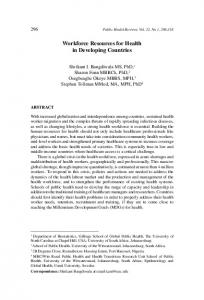
The late 19th and early 20th centuries were marked by the emergence of the vitamin theory and the characterization of the vitamins. Although descriptions of scurvy, beriberi, night blindness and keratomalacia, and rickets—manifestations of vitamin C, thiamin, vitamin A, and vitamin D deficiencies, respectively—and their empirical treatments are known in the older medical literature, it was not until the last quarter of the 19th century that major progress commenced in the characterization of vitamins and vitamindeficiency diseases. In the 19th century, beriberi was widespread in eastern and Southeast Asia, and it was especially a problem for sailors on long voyages. In 1882, a Japanese naval vessel, Riujo, sailed from Japan to Honolulu via New Zealand and Chile, and after 272 days of navigation, 60% of the ship’s 276 crew members developed beriberi, and 25 died [103]. A Japanese naval surgeon, Kanehiro Takaki (1849–1920) (Fig. 1.3), conducted epidemiological investigations of beriberi on different warships and examined clothing, living quarters, weather records, and rank. Takaki concluded that beriberi was related to the quality of food, particularly an insufficient intake of nitrogenous foods. In 1884, he persuaded the Japanese government to provide additional meat and dry milk on a training ship, Tsukuba, which sailed the same route of the ill-fated Riujo. When the Tsukuba arrived in Japan 287 days later, there were a handful of cases of beriberi and no deaths. After Takaki’s dietary reforms were introduced, the cases of beriberi plummeted sharply in the Japanese navy [104, 105]. In 1886, Christiaan Eijkman (1858–1930), a Dutch army physician, was sent to the Dutch East Indies to investigate beriberi, which was generally thought at that time to
12
Semba
Fig. 1.3. Vessels involved in Navy research on beri-beri by Kanehiro Takaki in the late 19th century.
be due to an unidentified bacterial infection. Eijkman demonstrated that chickens raised on polished rice alone developed a paralytic disorder similar to human beriberi, and that this disorder could be corrected by a diet of unpolished rice. The bran portion of rice contained a substance that could prevent beriberi, and Eijkman originally thought that the polished rice contained a toxin that was neutralized by a substance in the bran portion [106]. His colleague, Gerrit Grijns (1865–1944) believed that the disease affecting chickens and human beriberi were both due to an absence in the diet of a factor present in the rice polishings [107].
Chapter 1 / Historical Perspective
13
From the time of the early experiments of Magendie, the contributions of several investigators over many decades helped to characterize vitamin A [108, 109]. Nicholai Ivanovich Lunin (1853–1937) (Fig. 1.4), working in the laboratory of Gustav von Bunge (1844–1920) at the University of Dorpat, determined that mice cannot survive on a purified diet of fats, carbohydrates, proteins, and salts alone; however, he noted that mice could survive when milk was added. Lunin concluded “other substances indispensable for nutrition must be present in milk besides casein, fat, lactose, and salts” [110]. Lunin’s conclusion was disseminated widely in von Bunge’s Lehrbuch der physiologischen und pathologischen Chemie [111]. Another student performed experiments with simplified diets in mice and found that there was an unknown substance in egg yolk that was essential for life [112]. At the University of Utrecht, Cornelius Pekelharing (1848–1922) conducted experiments that showed that mice are able to survive on diets in which small quantities of milk are added [113], and Wilhelm Stepp (1882–1964) showed that if the milk supplied to mice was extracted with alcohol-ether (thus removing the fat-soluble substance later known as vitamin A), the mice could not survive [114]. The most explicit statement of the theory regarding the existence of vitamins came in 1906, when Frederick Gowland Hopkins (1861–1947), a biochemist at Cambridge University, who—on the basis of his own unpublished experiments and other observations—expressed the belief that there were “unsuspected dietetic factors” besides proteins, carbohydrates, fats, and minerals that were vital for health [115]. In 1911, Casimir Funk (1884–1967) thought he had isolated the dietary factor involved in beriberi and coined the name vitamine for it [116]. Further exposition of the vitamin theory came in 1912, when Funk presented that idea that beriberi, scurvy, and pellagra were all nutritional deficiency diseases [117]. Later, Eijkman and Hopkins jointly received the 1929 Nobel Prize for their early pioneering scientific research on vitamins [118]. In the United States, Thomas Osborne (1859–1929) and Lafayette Mendel (1872– 1935), working at Yale University, showed that a fat-soluble substance in butterfat was
Fig. 1.4. Nicholai Ivanovich Lunin (1853–1937).
14
Semba
needed to support the growth of rats [119, 120]. After a period of illness, Hopkins published work he undertook in 1906–1907, which showed that mice could not survive on a purified diet without milk. Hopkins postulated the existence of what he called “accessory factors” in foods that were necessary for life [121]. In studies with eggs and butter, Elmer McCollum (1879–1967), a biochemist at the University of Wisconsin, noted that their data “supports the belief that there are certain accessory articles in certain foodstuffs which are essential for normal growth for extended periods” [122]. The accessory factor was later named fat-soluble A by McCollum, but it actually contained both vitamins A and D, leading to the initial belief that lack of fat-soluble A was responsible for rickets [123, 124]. In 1922, it was shown that cod-liver oil contained both vitamins A, an antixerophthalmic factor, and vitamin D, an antirachitic factor [125]. Soon the term fat-soluble A was combined with Funk’s designation to become vitamine A and later vitamin A. The molecular structure of vitamin A was deduced in 1931 [126, 127], and vitamin A was eventually crystallized in 1937 [128].
1.11
FURTHER RESEARCH ON NUTRITIONAL DEFICIENCY DISEASES
Pellagra, a syndrome characterized by dermatitis, diarrhea, dementia, and death, was described in Europe as early as the 18th century, and it was often ascribed to spoiled maize [129]. With the rise of the germ theory of disease, it was thought that pellagra might also be attributable to an infection [130]. In the early part of the 20th century, pellagra was increasingly recognized in the United States, especially in the South [131], and by 1916, it was second among the causes of death in South Carolina. Outbreaks of pellagra seemed to occur more commonly in asylums, jails, and poorhouses [132]. The Pellagra Commission of the State of Illinois conducted investigations in 1911 and concluded that pellagra was attributable to an infection [133], and another investigation in South Carolina implicated poor sanitation [134]. In 1914, Joseph Goldberger (1874–1929), a physician in the US Public Health Service [135], conducted investigations of pellagra in South Carolina and showed that pellagra could be prevented by supplying milk, butter, and lean meat in the diet [136]. Careful study showed that household ownership of a cow was protective against pellagra. Further investigations among prison volunteers revealed that pellagra could be produced by a restricted, mainly cereal diet [137]. In later animal studies, niacin was implicated as the deficient dietary factor involved in the etiology of pellagra [129]. After World War II, a controversy erupted over whether protein deficiency was a major nutritional problem of developing countries [12]. The syndrome of kwashiorkor— edema, wasting, diarrhea, and peeling of the skin—was described by Cicely Williams (1893—1992), an English physician, among children in the Gold Coast of West Africa [138]. High mortality was noted among these children, and those affected appeared to be mostly 1 to 4 years old, weaned early, and fed entirely on white corn gruel. Initially, it was thought that the condition was related to a deficiency of B complex vitamins, but after the condition failed to respond to vitamins, it was considered a problem of protein deficiency. International efforts were focused on closing the “protein gap” through high-protein sources such as fish, soybeans, and peanuts. Efforts to market an infant formula based on peanut flour ended when it was discovered that under humid, tropical
Chapter 1 / Historical Perspective
15
conditions, carcinogenic aflatoxins were produced by fungi growing in the flour [139]. The importance of calories was realized when children with kwashiorkor recovered on eating foods with relatively low protein but high energy content [140], and the term protein-calorie malnutrition soon replaced protein malnutrition [141]. Concern was raised that the problem of marasmus, which was more common owing to a decline in breast-feeding, was being relatively neglected [142]. It was soon acknowledged that the protein gap was a myth; the chief problem in developing countries lay in a “food gap and an energy gap” or an issue of “quantity rather than quality of food” [143].
1.12
NUTRITIONAL IMMUNOLOGY
Nutritional immunology, the study of the relationship between nutrition and immunity, was a discipline that arose largely during the early 20th century. Although it had been observed over the centuries that famine would reduce an individual’s resistance to epidemic diseases, more specific clues were provided with the advent of animal experimentation using controlled diets. The recognition of specific vitamins and developments in immunology made it possible to study the effects of single or multiple vitamin deficiencies on immune function. By the end of the 19th century, humoral antitoxic antibodies in the serum of immunized animals had been described, and this led to the development of serological tests involved in the diagnosis of infectious disease and measurement of immunological protection [144]. Experimental infections were soon conducted in animals on controlled diets, and serological tests allowed assessment of the effect of dietary deprivation on immunity to infection. By the mid-1930s, animal studies suggested that deficiencies of some of the vitamins reduced resistance to infection [145–147].
1.13 VITAMIN A AND REDUCTION OF CHILD MORTALITY Two Danish physicians, the pediatrician Carl Bloch (1872–1952) and the ophthalmologist Olaf Blegvad (1888–1961), dealt with a large number of children with clinical vitamin A deficiency in Denmark in the period 1910–1920. They noted that children with vitamin A deficiency had greatly increased mortality, and that their mortality could be reduced by providing the children with vitamin A-rich foods such as cod-liver oil, whole milk, cream, and butter [148–151]. In the late 1920s, vitamin A was recognized to have an effect on immunity to infection, and vitamin A became known as the “anti-infective” vitamin [152]. Largely through the influence of Edward Mellanby (1884–1955), a professor of physiology at Sheffield University (Fig. 1.5), vitamin A underwent a period of intense clinical investigation. Between 1920 and 1940, at least 30 trials were conducted to determine whether vitamin A could reduce the morbidity and mortality from infectious diseases, including respiratory disease, measles, puerperal sepsis, and tuberculosis [153]. These trials were conducted prior to the time when many of the innovations known to the modern controlled clinical trial, such as randomization, sample size and power calculations, and placebo controls, were widely known. By the 1930s, it was firmly established that vitamin A supplementation could reduce morbidity and mortality in young children. In 1932, Joseph Ellison (b. 1898), a physician in London, showed that vitamin supplementation reduced the mortality of vitamin
16
Semba
Fig. 1.5. Dr. Edward Mellanby (1884–1955).
A-deficient children with measles [154]. During the 1931–1932 measles epidemic in London, Ellison assigned 600 children with measles at the Grove Fever Hospital to one of two groups of 300 each. One group received vitamin A, and the other group did not receive vitamin A. Overall mortality rates in the vitamin A and control groups were 3.7% and 8.7%, respectively, representing a 58% reduction in mortality with vitamin A treatment. Ellison’s study, published in the British Medical Journal in 1932, was the first trial to show that vitamin A supplementation reduces mortality in young children with vitamin A deficiency [155]. Vitamin A became a mainstream preventive measure: Cod-liver oil was part of the morning routine for millions of children—a practice promoted by physicians and popularized by the pharmaceutical industry [155]. The US production and importation of cod-liver oil totaled 4,909,622 pounds in 1929 [156]. In the early 1930s in England, the annual consumption of cod-liver oil was 500,000 gallons [157]. Much of the world’s supply of cod-liver oil, and hence vitamins A and D, came from the commercial fisheries of New England, Norway, and Newfoundland. As noted in the British Medical Journal, “codliver oil was in use in almost every working-class household, and local authorities spent considerable sums in purchasing bulk supplies for hospitals and sanitoriums” [158]. In England, a proposal to tax cod-liver oil in the Ottawa Agreements Bill in the House of Commons in 1932 raised protests as there was concern that child mortality would increase if the price of cod-liver oil increased and it became less accessible to poor people. As reported in both The Lancet and the British Medical Journal, one legislator who supported an amendment to exempt cod-liver oil from the proposed taxation noted that many a child in the north of England “owed its life to being able to obtain cod-liver oil.” [157, 159]. Two British physicians also supported the amendment in letters published in The
Chapter 1 / Historical Perspective
17
Lancet [157]. One expert from the Lister Institute of Preventive Medicine noted: “It is evident that any steps which may raise the price and lower the consumption of cod-liver oil, especially in the winter, would have deleterious effect upon the health of the population, involving particularly the well-being of the children of the poorer classes.” [157]. The concerns of physicians and legislators alike that children receive sufficient vitamin A to protect against the well-known morbidity and mortality of vitamin A deficiency were clearly expressed. The discovery of the sulfa antibiotics and their clinical applications soon overshadowed investigations of vitamin A as anti-infective therapy, and there was about a 50-year lull until the late 1980s in clinical investigation of vitamin A as an intervention to reduce morbidity and mortality [160]. In 1950, a joint expert committee on nutrition of the FAO and WHO recommended that studies be made on the relationship of nutritional status to resistance against intestinal parasites. Further observations made in the ensuing decade suggested that many infectious diseases were associated with malnutrition. A WHO Expert Committee on Nutrition and Infection reviewed the issue of the interaction between nutrition and infection in 1965, and a comprehensive monograph, Interactions of Nutrition and Infection, by Nevin Scrimshaw, Carl Taylor, and John Gordon appeared in 1968 [161]. The effect of nutritional status on resistance to diarrheal and respiratory disease and viral, parasitic, and other infections was reviewed, and the present state of knowledge regarding the effects of specific micronutrient deficiencies on immune function was presented. The authors concluded: Infections are likely to have more serious consequences among persons with clinical or subclinical malnutrition, and infectious diseases have the capacity to turn borderline nutritional deficiencies into severe malnutrition. In this way, malnutrition and infection can be mutually aggravating and produce more serious consequences for the patient than would be expected from a summation of the independent effects of the two.
This seminal work served as the foundation for research on nutritional immunology, especially for vitamin A and for zinc research, in the last three decades of the 20th century. An important detailed review of the effects of single nutrients on immunity was made by William Beisel in 1982 [162]. Tremendous advances in nutritional immunology have been made in the last 20 years or so, and many of these recent findings regarding the relationship between micronutrients and immunity to infection are presented elsewhere in this book.
1.14
GROWTH IN FOOD PRODUCTION
In England, growth in food production from 1750 to 1880 was not seen not so much as owing to technological innovation as to increasing soil fertility and crop yield through manuring and sowing of legumes [163]. Improved reaping machines appeared in the early 19th century, and cast iron replaced wrought iron and wood in many agricultural implements. Introduction of new fodder crops for winter feeding helped better animal husbandry. In France, railway construction was considered to be a vital factor in improving the agricultural economy in the mid-19th century, and animal breeding, crop rotation, and mechanization contributed to improve agricultural practice [164]. In
18
Semba
England, better road transport increased the market for the dairy producer. Advances in the process by which ammonia could be produced from atmospheric nitrogen allowed more widespread use of fertilizers in the early 20th century [165]. Increased mechanization with tractors, combined harvesters, automatic hay-balers, and seed and fertilizer drills has been noted between 1910 and 1950 in England, and advances in plant breeding brought new cereal and clover varieties [165]. In the United States, technological advances in the plow, reaper, binder, and thresher aided the development of mechanized farming in the 19th century. Industrialized agriculture expanded in the beginning of the 20th century with the development of gasoline-powered tractors.
1.15
LONG-TERM TRENDS IN DIET
Available evidence suggests that the majority of the world’s population before 1800 consumed a diet below contemporary minimum standards of optimal nutrition [166]. In France, the caloric intake of the average diet increased steadily during the 19th century, but the basic composition of the diet did not appear to change much until after about 1880 [167]. Inspired by the French voluntary Caisses des Écoles, which fed hungry schoolchildren, charities were founded to feed children in England. The Victorian working class diet was especially poor in quality and quantity [168]. Near the end of the 19th century, over one in ten children attending London schools were estimated to habitually go hungry [169]. Alarm was raised over the problem of inadequate nutrition when the report of the Inter-Departmental Committee on Physical Deterioration was published in 1904 [170]. The committee showed that 40–60% of young men presenting for military service at the time of the South African War were rejected on medical grounds, and much of this physical inadequacy was attributed to malnutrition. This and other reports led to the Education (Provision of Meals) Act of 1906, which mandated a national policy for feeding needy children at school. The number of London children receiving meals was about 27,000 in 1907 and by 1909 that number had doubled [171]. When the Report on the Present State of Knowledge Concerning Accessory Food Factors (Vitamines) appeared in 1919, it helped shape dietary recommendations based on newer knowledge of vitamins [172]. The value of milk was emphasized by the report, and a study showed that provision of supplemental milk each day resulted in better weight and height gain than occurred in those who were not supplemented [173]. By 1945, about 40% of the school population was taking school meals, and 46% were drinking school milk [171]. An association between low socioeconomic level and inadequate diet was known in France [51] and England [174]. In A Study of the Diet of the Labouring Classes in Edinburgh (1901), D. Noël Paton and his colleagues showed that many workers did not have the income to obtain a sufficient supply of food and lacked the education to make correct choices of food [175]. A discussion later followed in the British Medical Journal [176]: Who is responsible for the conditions which lead to the state of poverty and bad nutrition disclosed by this report? Lies the fault with poor themselves—is it because they are thriftless, because they lack training in cooking and in the economical spending of
Chapter 1 / Historical Perspective
19
such income as they possess? Or is it that the actual wages which they can command are so low that it is impossible for them to purchase the actual necessities of life?
Whether the problem lay with lack of education or inadequate income was unclear, and each side had its adherents [177]. In 1936, John Boyd Orr (1880–1971) published Food Health and Income: Report on a Survey of the Adequacy of Diet in Relation to Income; this report created a sensation in England and was widely publicized around the world. This dietary survey suggested that the poorest of the poor, about 4.5 million people, consumed a diet deficient in all dietary constituents examined, and that the next poorest, about 9 million people, had a diet adequate in protein, fat, and carbohydrates but deficient in all vitamins and minerals [178]. Only half the population surveyed had a diet that was adequate in all dietary constituents, including all vitamins and minerals. Although the per capita consumption of fruit, vegetables, and dairy products had greatly increased between 1909 and 1934 in Great Britain, there was clearly more that could be done to improve nutrition [178]. Analysis of household budgets suggests that the average daily intakes of vitamin A, vitamin C, and thiamin were mostly inadequate in 1900 but increased to largely sufficient intakes by 1944 among poor, working class, and middle class families in Great Britain [174]. Long-term analysis of nutritional status show that height grew in the United Kingdom between the mid-19th century and through the years following World War II [179]. In the United States, there have been large dietary changes over the last 200 years [17, 180]. In the early 19th century, many individuals did not consume adequate amounts of fruits, vegetables, and dairy products, and dietary deficiencies were not uncommon among rural and urban dwellers. From about 1830–1870, the mean stature of Americans had a prolonged decline, and this may possibly have been due to increased urbanization and poorer nutrition for urban workers during industrialization [181, 182]; from the 1880s to the present, there has been a steady increase in stature. The apparent per capita consumption of dairy products increased in the United States between 1909 and 1930 [183, 184]. The discovery of the vitamins led to a greater awareness of nutrition, and using a combination of fear, hope, and guilt, the pharmaceutical and food industries promoted their products to mothers [185]. Fortification of baker’s bread with thiamin, riboflavin, niacin, iron, and calcium became mandatory in 1943. When federal wartime legislation ended in 1946, many states continued to require the enrichment of bread [180]. When George Newman, one of the primary architects of public health reform in Great Britain, wrote to a colleague in 1939, he reminisced about the “silent revolution” in Great Britain: [They] … who say I am an idealist and wild optimist do not know their history. How can one be otherwise who knew England and English medicine in 1895 and know it now? It is the greatest silent revolution in our time. The opportunity and the quality of human life has, as you truly say, been “transformed.” They don’t know what “malnutrition” means nowadays. Everybody is undernourished in some degree a way, but prevalent malnutrition is rare, whilst it used to be common. [186].
In The Building of a Nation’s Health in 1939, Newman identified adequate nutrition as one of the “most powerful instruments” of preventive medicine [187].
20
1.16
Semba
THE DECLINE OF MORTALITY
In The Modern Rise of Population (1976), Thomas McKeown (1912–1988) showed that population grew in Europe since the mid-18th century, and he attributed the rise in population largely to a reduction in deaths from infectious diseases [1]. The decline of infectious disease mortality was occurring prior to the identification of specific pathogens, the widespread use of immunizations, the development of antibiotics, and the rise of sophisticated, technologically based clinical medicine (Fig. 1.6). Improved nutrition, greater food supplies, purification of water, better sanitation, and improved housing are among the main factors cited in the reduction of infectious disease morbidity and mortality [2]. A close interrelationship among nutrition, infection, and hygiene was acknowledged [2, 3], and McKeown’s conclusions were primarily based on observations of infectious disease mortality rates from the late 19th century and later. These views have become orthodox and influential in the debate regarding appropriate strategies for reducing mortality in developing countries, and scientific findings of the last 20 years from developing countries largely support McKeown’s contention that nutritional status influences infectious disease morbidity and mortality. Others have disputed some of McKeown’s conclusions, citing evidence that the rise of population from the 16th century may have been primarily caused by an increase in fertility rather than a decline in mortality [188], or that the relationship between nutri-
Fig. 1.6. Case fatality rates for measles, 1850–1970. Adopted with permission from McKeown (1).
Chapter 1 / Historical Perspective
21
tion and infection is “controversial” [189]. There is little question that there has been a general decline in mortality in Europe since the middle of the 17th century, but given the close relationship among socioeconomic level, education, housing, food, clean water, sanitation, and hygiene, it has been difficult to separate specific causal factors [190–192]. During the same period, there was a probable reduction in exposure to pathogenic organisms through changes in our environment [4], and over the last 200 years, there has been a near disappearance of deficiency diseases that were once commonly reported in Europe, such as goiter, pellagra, rickets, and xerophthalmia [129, 150, 193]. These deficiency diseases cause significant morbidity and mortality but have been relatively neglected in historical demography.
1.17
GRADUATE EDUCATION IN PUBLIC HEALTH
The early sanitary reform efforts in the 19th century were dominated by nonmedical personnel in the United States and Europe as it was often seen as the responsibility of engineers, biologists, and chemists. The appointment of John Simon (1816–1904), a surgeon, to the head of the medical department of the Privy Council in 1854 was a visible sign of change in which the public health system was dominated by the medical profession [194]. New public health legislation created a need for qualified medical practitioners to serve as officers of health, and programs offering a diploma in public health appeared in Dublin, Edinburgh, and Cambridge. In Vienna, the subjects “medical police” and “forensic medicine” were combined under the designation “state medicine” at the Vienna Medical School [195]. At first, medical police was taught largely with emphasis on knowledge of ordinances and sanitary regulations in Austria, which were influenced by Frank’s Medicinische Polizey, but emphasis slowly changed to scientific investigation and sanitation after cholera and typhoid epidemics struck Vienna. Courses in public health were taught in some universities in the United States at the turn of the century, but schools of hygiene and public health were not created as a separate entity until the early 20th century. In 1916, the School of Hygiene and Public Health was established at the Johns Hopkins University with William H. Welch as its director [196], and the School of Public Health opened at Harvard University in 1922 [197]. With endowment of the Rockefeller Foundation, the London School of Hygiene and Tropical Medicine opened in 1929. By 1925, the teaching of hygiene varied enormously, with institutes of hygiene established among medical faculty in Germany and Sweden, hygiene taught through bacteriology in France, and new schools of public health at Johns Hopkins, Harvard, and Pennsylvania in the United States [198]. The number of universities with schools or programs of public health continued to grow in the United States, Great Britain, and Europe [199].
1.18
INTERNATIONAL ORGANIZATIONS
Among the larger institutions involved in scientific research related to public health were the Institut Pasteur, the Lister Institute, the Rockefeller Institute, and the National Institutes of Health (NIH). The success of Pasteur in microbiological investigations and rabies immunization led to the establishment of the Institut Pasteur in Paris in 1888. The institute was a model for bacteriological research, and within a few years, other Pasteur Institutes were established in more than 40 places around the world. These institutes
22
Semba
scattered around the globe were loosely knit and linked by ideology [200]. The Institut Pasteur made major contributions to preventive medicine with new vaccines and therapies for infectious diseases [201]. In 1891, the Lister Institute was established in London, and research on vitamins was a major part of the research program, with notable emphasis on rickets [202]. The Rockefeller Foundation established an International Health Commission in 1913, and the commission grew out of early efforts of the Rockefeller Sanitary Commission to eradicate hookworm in the southern United States [203]. The International Health Division, or Health Commission, of the Rockefeller Foundation, expanded efforts to eradicate hookworm overseas, and during the 1920s the focus expanded to malaria, yellow fever, and tuberculosis [204, 205]. The Rockefeller Foundation helped to transform medical education in the United States and tended to emphasize a technological approach to medicine [206]. The NIH had its early roots in public health with the establishment of the Hygienic Laboratory of the Marine Hospital Service in 1887 [207]. The laboratory was responsible for bacteriological work, including diagnosis of infectious diseases among immigrants. The scope of the laboratory increased with Progressive Era regulations such as the Biologics Control Act of 1902 and the Pure Food and Drugs Act of 1906. In 1912, the service became known as the US Public Health Service, and among its activities were investigations of pellagra by Joseph Goldberger. The National Institute of Health was formally established by the US Congress in 1930, and by 1948 it consisted of several institutes to become the National Institutes of Health (NIH) [208]. Although the NIH had its roots in hygiene and public health, a shift occurred with the creation of the Communicable Disease Center (CDC) in Atlanta, Georgia, in 1946. The CDC soon dealt with epidemics and other public health crises such as influenza outbreaks, polio surveillance, and measles eradication. International health organizations grew out of efforts to coordinate quarantines and control international epidemics such as those of cholera and plague. In 1907, the Office International d’Hygiène Publique (International Office of Public Health) was established in Rome, and the purpose of the organization was to collect and disseminate epidemiological information about smallpox, plague, cholera, and other diseases. The Health Organization of the League of Nations was created in 1923, and its activities included promotion of health, international standardization of biological tests and products, and control of disease. In 1948, the WHO was created after international ratification, and it assumed the activities of the Health Organization of the League of Nations and other offices. The Pan American Sanitary Bureau became the regional office of the WHO for Latin America in 1949, and in 1958 it changed its name to the Pan American Health Organization (PAHO). Treatment campaigns against yaws, smallpox eradication, oral rehydration therapy, and childhood immunizations are among the many achievements of the WHO since its inception. The United Nations International Children’s Emergency Fund (UNICEF) was created in 1946 by resolution of the United Nations General Assembly, and the purpose of UNICEF was to protect the well-being of children around the world. Early activities of UNICEF included shipments of powdered milk for children in Europe, vaccination efforts, support for vector control, and provision of equipment for maternal and child health centers [209]. Milk powder—which required reconstitution through heating and
Chapter 1 / Historical Perspective
23
rapid cooling—reportedly had little impact on nutritional deficiency in rural Africa because it proved too time consuming for women to boil and cool milk in large cauldrons over a wood fire in the face of other work in their fields [209]. Most of UNICEF’s assistance in Africa in the 1950s went toward malaria eradication. By 1970, the focus of UNICEF moved away from milk and protein supplementation toward emphasis on improving community water supplies by installation of hand pumps and tube wells and an emphasis on primary health care. The FAO was founded in 1945 in Quebec, Canada, with the purpose of raising the levels of nutrition and standards of living, securing improvements in the production and distribution of food and agricultural products, and improving the condition of rural populations [210]. The first director general of FAO was John Boyd Orr, who brought attention to the relationship between income and diet in England in the 1930s. The FAO, based in Rome, provides assistance for sustainable agriculture, promotes transfer of skills and technology in field projects, offers advice on agricultural policy and planning, and fosters international cooperation on nutrition, biodiversity, and agricultural commodities. The World Bank originated with reconstruction efforts after World War II, when delegates from 44 nations met in Bretton Woods, New Hampshire, and drew up articles of agreement for the International Bank for Reconstruction and Development in 1944 [211, 212]. The mission of the World Bank shifted from reconstruction to development, especially for economically developing countries. World Bank loans to poor countries in Africa and Asia increased under the tenure of the World Bank’s fifth president, Robert McNamara. McNamara was aware of Alan Berg’s work on nutrition and health at the Brookings Institution, which later appeared in The Nutrition Factor [212, 213], and a nutrition unit was created at the World Bank in 1972. The role of the bank was to encourage development-oriented work rather than mass food distribution in developing countries, and such projects included identifying populations at high risk for malnutrition; developing food subsidy programs; integrating nutrition assistance with primary care and family planning, nutrition education, and promotion of home gardening; improving water and sanitation; and delivering micronutrient supplements [214].
1.18
CONCLUSIONS
Over the last 200 years in most of Europe and the United States, there has been a major reduction in mortality rates, a virtual elimination of many infectious diseases, an improvement in diet, and virtual disappearance of nearly all nutritional deficiency disorders. Many of the so-called tropical diseases, such as malaria, yellow fever, and cholera, were once endemic or epidemic in industrialized countries and have now disappeared (Table 1.1). Case fatality rates for many infectious diseases dropped tremendously during the late 19th and early 20th centuries. New knowledge of nutrition and the characterization of vitamins helped to improve the diet in the early 20th century, and innovations in agricultural practices helped to increase food production. After World War II, international organizations grew in strength and are addressing basic issues of nutrition, hygiene, and control of infectious diseases in developing countries. Nutrition has played a major role among the developments in public health during the last 200 years and is likely to remain as a major foundation for public health.
24
Semba
Table 1.1. Major Diseases in Europe, Great Britain, and the United States During the 19th Century Infectious diseases Nutrition deficiency disorder Diarrheal disease Rickets Cholera Pellagra Malaria Goiter/cretinism Yellow fever Nutritional blindness Tuberculosis Typhoid Typhus Measles
REFERENCES 1. McKeown T. The modern rise of population. London: Arnold, 1976. 2. McKeown T. The role of medicine: dream, mirage, or nemesis? Princeton, NJ: Princeton University Press, 1979. 3. Woods R, Woodward J, eds. Urban disease and mortality in nineteenth century England. New York: St. Martin’s, 1984. 4. Riley JC. The eighteenth century campaign to avoid disease. New York: St. Martin’s, 1987. 5. Rosen G. A history of public health. New York: MD Publications, 1958. 6. Duffy J. The sanitarians: a history of American public health. Urbana: University of Illinois Press, 1990. 7. Fee E, Acheson RM. A history of education in public health: health that mocks the doctors’ rules. Oxford: Oxford University Press, 1991. 8. Porter R. The greatest benefit to mankind: a medical history of humanity. New York: Norton, 1997. 9. Winslow CEA. The conquest of epidemic disease: a chapter in the history of ideas. Princeton, NJ: Princeton University Press, 1943. 10. Dowling HF. Fighting infection: conquests of the twentieth century. Cambridge: Harvard University Press, 1977. 11. Ackerknecht EH. History and geography of the most important diseases. New York: Hafner, 1965. 12. Carpenter KJ. Protein and energy: a study of changing ideas in nutrition. Cambridge, UK: Cambridge University Press, 1994. 13. Carpenter KJ. The history of scurvy and vitamin C. Cambridge, UK: Cambridge University Press, 1986. 14. Roe DA. A plague of corn: the social history of pellagra. Ithaca, NY: Cornell University Press, 1973. 15. Drummond JC, Wilbraham A. The Englishman’s food: a history of five centuries of English diet. London: Cape, 1939. 16. Tannahill R. Food in history. New York: Stein and Day, 1973. 17. Levenstein HA. Revolution at the table: the transformation of the American diet. New York: Oxford University Press, 1988. 18. Newman LF, ed. Hunger in history: food shortage, poverty, and deprivation. Oxford: Blackwell, 1990. 19. Frankel C. The faith of reason: the idea of progress in the French Enlightenment. New York: King’s Crown, Columbia University, 1948. 20. Diderot D, Alembert JLR d’, Mouchon P. Encyclopédie, ou dictionnaire raisonné des sciences, des arts et des métiers, par une société de gens de lettres. Paris: Briasson, 1751–1765. 21. Condorcet MJAN Caritat, Marquis de. Esquisse d’un tableau historique des progrès de l’esprit humain. 2nd ed. Paris: Agasses, 1795.
Chapter 1 / Historical Perspective
25
22. Condorcet MJAN, Caritat, Marquis de. Sketch for a historical picture of the progress of the human mind. J. Barraclough, trans. London: Weidenfeld and Nicholson, 1955. 23. Baker K. Condorcet: from natural philosophy to social mathematics. Chicago: University of Chicago Press, 1975. 24. Godwin W. An enquiry concerning political justice, and its influence on general virtue and happiness. London: Robinson, 1793. 25. Malthus TR. An essay on the principle of population as it affects the future improvement of society, with remarks on the speculations of Mr. Godwin, M. Condorcet, and other writers. London: Johnson, 1798. 26. Avery J. Progress, poverty and population: re-reading Condorcet, Godwin and Malthus. London: Cass, 1997. 27. Frank JP. System einer vollständigen medicinischen Polizey. 3rd rev. ed. Wien, 1786–1817. 28. Sigerist HE. The people’s misery: mother of diseases, an address delivered in 1790 by Johann Peter Frank, translated from the Latin, with an introduction. Bull Hist Med 1941;9:81–100. 29. Sigerist HE. Landmarks in the history of hygiene. London: Oxford University Press, 1956. 30. Greenwood M. Medical statistics from Graunt to Farr. Cambridge, UK: Cambridge University Press, 1948. 31. Pearson ES, ed. The history of statistics in the seventeeth and eighteenth centuries against the changing background of intellectual, scientific and religious thought: lectures by Karl Pearson given at University College London during the academic sessions 1921–1933. New York: Macmillan, 1978. 32. Graunt J. Natural and political observations mentioned in a following index, and made upon the bills of mortality. London: Martin, Allestry, and Dicas, 1662. 33. Westergaard H. Contributions to the history of statistics. London: King, 1932. 34. Petty W. Several essays in political arithmetic. London: Clavel and Mortlock, 1699. 35. Halley E. An estimate of the degrees of mortality of mankind, drawn from curious tables of the births and funerals of the city of Breslaw, with an attempt to ascertain the price of annuities upon lives. Phil Trans 1693;17:596–610. 36. Eyler JM. Victorian social medicine: the ideas and methods of William Farr. Baltimore, MD: Johns Hopkins University Press, 1979. 37. Farr W. Vital statistics, or the statistics of health, sickness, diseases, and death. In: A statistical account of the British empire: exhibiting its extent, physical capacities, population, industry, and civil and religious institutions. McColloch JR, ed. London: 1837, 2:567–601. 38. Quetelet A. Sur l’homme et le développement de ses facultés, ou Essai de physique sociale. Paris: Bachelier, 1835. 39. Cullen MJ. The statistical movement in early Victorian Britain: the foundations of empirical social research. New York: Barnes and Noble, 1975. 40. Porter TM. The rise of statistical thinking, 1820–1900. Princeton, NJ: Princeton University Press, 1986. 41. Galton F. Natural inheritance. London: Macmillan, 1889. 42. Pearson K. Mathematical contributions to the theory of evolution, III. Regression, heredity and panmixia. Phil Trans Roy Soc London A 1896;187:253–318. 43. Stigler SM. The history of statistics: the measurement of uncertainty before 1900. Cambridge: Harvard University Press, 1986. 44. Fisher RA. The design of experiments. London: Oliver and Boyd, 1935. 45. Neyman J, Pearson ES. On the use and interpretation of certain test criteria for purposes of statistical inference. Biometrika 1928; 20A (part 1):175–240; (part 2):263–294. 46. Marks HM. The progress of experiment: science and therapeutic reform in the United States, 1900– 1990. Cambridge, UK: Cambridge University Press, 1997. 47. Ackerknecht EH. Hygiene in France, 1815–1848. Bull Hist Med 1948;22:117–155. 48. La Berge A. Mission and method: the early nineteenth century French public health movement. Cambridge, UK: Cambridge University Press, 1992. 49. Villermé LR. De la famine et ses effets sur la santé dans les lieux qui sont le théâtre de la guerre. J gén méd chir pharm 1818;65:3–24.
26
Semba
50. Villermé LR. Recherches statistiques sur la ville de Paris et le département de la Seine. Bull Soc méd d’emul 1822:1–41. 51. Benoiston de Châteauneuf LF. Recherches sur les consommations de tout genre de la ville de Paris en 1817, comparées à ce qu’elles étaient en 1789. Paris: Author, 1820. 52. Coleman W. Death is a social disease: public health and political economy in early industrial France. Madison: University of Wisconsin Press, 1982. 53. Villermé LR. Des epidémies sous les rapportes de l’hygiène publique, de la statistique médicale et de l’économie politique. Paris, 1833. 54. Villermé LR. Tableau de l’état physique et moral des ouvriers employés dans les manufactures de coton, de laine et de soie. 2 vols. Paris: Renouard, 1840. 55. Napoli Archivio di Stato. Statistica del 1811. Ministero dell’Interno, 1% Inventario, 96:1–65. 56. Constantini AM. Ambiente, alimentazione e salute nell’inchiesta murattiana del 1811. Medicina nei Secoli 1996;8:339–357. 57. Genovesi A. Ragionamento intorno all’agricoltura con applicazione al Regno di Napoli. In Scrittori Classici Italiani di Economia Politica. Parte Moderna, Tomo IX. Milano: De Stefanis, 1803:305–325. 58. Bentham J. Traités de législation civile et pénale. Paris: Bossange, Masson, and Besson, 1802. 59. Chadwick E. Report to Her Majesty’s principal secretary of state for the Home Department, from the Poor Law Commissioners, on an inquiry into the sanitary condition of the labouring population of Great Britain. London: Clowes, 1842. 60. Finer SE. The life and times of Sir Edwin Chadwick. London: Methuen, 1952. 61. Shattuck L. Report of a general plan for the promotion of public and personal health, devised, prepared and recommended by the commissioners appointed under a resolve of the legislature of Massachusetts, relating to a sanitary survey of the state. Boston: Dutton and Wentworth, 1850. 62. Cassedy JH. Demography in early America: beginnings of the statistical mind, 1600–1800. Cambridge, MA: Harvard University Press, 1969. 63. Cassedy JH. American medicine and statistical thinking, 1800–1860. Cambridge: Harvard University Press, 1984. 64. Hirsch A. Handbook of geographical and historical pathology. London: New Sydenham Society, 1883– 1886. 65. Bulloch W. The history of bacteriology. London: Oxford University Press, 1938. 66. Pelling M. Cholera, fever, and English medicine, 1825–1865. Oxford, UK: Oxford University Press, 1978. 67. Panum PL. Iagttagelser, anstillede under Maeslinge-Epidemien paa Faerøerne i Aaret 1846. Bibliothek f Laeger, 1847;1:270–344. 68. Manicus A. Maeslingerne paa Faeröerne i Sommeren 1846. Ugeskrift for Laeger 1847;6:189–210. 69. Snow J. On the mode of communication of cholera. 2nd ed. London: Churchill, 1855. 70. Budd W. Malignant cholera: its mode of propagation and its prevention. London: Churchill, 1849. 71. Bruce FE. Water-supply. In: A history of technology. Vol. 5. The late nineteenth century, ca. 1850 to ca. 1900. Singer C, Holmyard EJ, Hall AR, Williams TI, eds. New York: Oxford University Press, 1958. 72. Goubert JP. The conquest of water: the advent of health in the industrial age. Princeton, NJ: Princeton University Press, 1986. 73. Hamlin C. The science of impurity: water analysis in nineteenth century Britain. Berkeley: University of California Press, 1990. 74. Girette J. La civilisation et le choléra. Paris: Hachette, 1867. 75. Bretonneau PF. Des inflammations spéciales du tissu muqueux et en particulier de la diphthérite, ou inflammation pelliculaire. Paris: Crevot, 1826. 76. Budd W. Typhoid fever; its nature, mode of spreading, and prevention. London: Longmans, Green, 1873. 77. Henle FGJ. Pathologische Untersuchungen. Berlin: Hirschwald, 1840. 78. Koch R. Untersuchungen über die Aetiologie der Wundinfectionskrankheiten. Leipzig: Vogel, 1878. 79. Koch R. Die Aetiologie der Milzbrand-Krankheit, begründet auf die Entwicklungsgeschichte des Bacillus anthracis. Beitr z Biol d Pflanzen. 1876; Bd. II, Heft 2:277–310. 80. Laveran CLA. Un nouveau parasite trouvé dans le sang plusieurs malades atteints de fièvre palustre. Bull Soc méd Hôp Paris (Mém) 1881;2 sér. 17:158–164.
Chapter 1 / Historical Perspective
27
81. Koch R. Die Aetiologie der Tuberculose. Berlin klin Wchnschr 1882;19:221–230. 82. Koch R. Ueber die Cholerabakterien. Dtsch med Wchnschr 1884;10:725–728. 83. Legge TM. Public health in European capitals: Berlin, Paris, Brussels, Christiania, Stockholm, and Copenhagen. London: Swan Sonnenschein, 1896. 84. Sedgwick WT. Principles of sanitary science and the public health with special reference to the causation and prevention of infectious diseases. New York: Macmillan, 1903. 85. Chapin CV. The sources and modes of infection. 2nd ed. New York: Wiley, 1912. 86. Lesch JE. Science and medicine in France: the emergence of experimental physiology, 1790–1855. Cambridge: Harvard University Press, 1984. 87. Magendie F. Précis élémentaire de physiologie. 2nd ed. Paris: Méquignon-Marvis, 1825. 88. Magendie F. Mémoire sur les propriétés nutritives des substances qui ne contiennent pas d’azote. Bull Sci Socphilomatique Paris 1816;4:137–138. 89. Mulder GJ. Ueber die Zusammensetzung einiger thierischen Substanzen. J prakt Chemie 1839;16: 129–152. 90. Liebig J von. Die Thier-Chemie oder die organische Chemie in ihrer Anwendung auf Physiologie und Pathologie. Braunschweig, 1846. 91. Voit C von. Handbuch der Physiologie des gesammt-Stoffwechsels und der Fortpflanzung. Theil 1. Physiologie des allgemeinen Stoffwechsels und der Ernährung. In: Handbuch der Physiologie, vol. 6. Hermann L, ed. Leipzig: Vogel, 1881:1–575. 92. Atwater WO. Methods and results of investigations on the chemistry and economy of food. Washington,, DC: U.S. Department of Agriculture, Office of Experiment Stations, 1895. Bulletin 21. 93. Sée G. Du régime alimentaire. Traitement hygiénique des malades. Paris: Delahaye and Lescrosnier, 1887. 94. Thompson WG. Practical dietetics with special reference to diet in disease. New York: Appleton, 1896. 95. Friedenwald J, Ruhräh J. Diet in health and disease. 2nd ed. Philadelphia: Saunders, 1906. 96. Lusk G. The elements of the science of nutrition. Philadelphia: Saunders, 1906. 97. Chittenden RH. The nutrition of man. New York: Stokes, 1907. 98. Meckel RA. Save the Babies: American public health reform and the prevention of infant mortality, 1850–1929. Baltimore, MD: Johns Hopkins University Press, 1990. 99. Klaus A. Every child a lion: the origins of maternal infant and health policy in the United States and France, 1890–1920. Ithaca, NY: Cornell University Press, 1993. 100. Newman G. Infant mortality: a social problem. London: Methuen, 1906. 101. Peters OH. Observations upon the natural history of epidemic diarrhoea. Cambridge, UK: Cambridge University Press, 1911. 102. Eyler JM. Sir Arthur Newsholme and state medicine, 1885–1943. Cambridge, UK: Cambridge University Press, 1997. 103. Shimazono N, Katsura E. Review of Japanese literature on beriberi and thiamine. Kyoto: Vitamin B Research Committee of Japan, 1965. 104. Takaki K. Prevention of beriberi in the Japanese Navy. Se-i-kai Med J 1885;4:29–37. 105. Takaki K. Three lectures on the preservation of health amongst the personnel of the Japanese Navy and Army. Lancet 1906;1:1369–1374, 1451–1455, 1520–1523. 106. Eijkman C. Polyneuritis bij hoenderen. Geneesk Tijdschr nederl Indië 1890;30:295–334; 1892;32:353– 362; 1896;36:214–269. 107. Grijns G. Over polyneuritis gallinarum. Geneesk Tijdschr nederl. Indië 1901;41:3–110. 108. Steenbock H. A review of certain researches relating to the occurrence and chemical nature of vitamin A. Yale J Biol Med 1932;4:563–578. 109. Wolf G, Carpenter KJ. Early research into the vitamins: the work of Wilhelm Stepp. J Nutr 1997;127:1255–1259. 110. Lunin N. Über die Bedeutung der anorganischen Salze für die Ernährung des Thieres. Zeitschr physiol Chem 1881;5:31–39. 111. Bunge G von. Lehrbuch der physiologischen und pathologischen Chemie. Leipzig: Vogel, 1887. 112. Socin CA. In welcher Form wird das Eisen resorbirt? Zeitschr physiol Chem 1891;15:93–139. 113. Pekelharing CA. Over onze kennis van de waarde der voedingsmiddelen uit chemische fabrieken. Nederlandsch Tijdschr. Geneeskunde 1905;41:111–124.
28
Semba
114. Stepp W. Experimentelle Untersuchungen über die Bedeutung der Lipoide für die Ernährung. Z Biol 1911;57:136–170. 115. Hopkins FG. The analyst and the medical man. Analyst 1906;31:385–404. 116. Funk C. On the chemical nature of the substance which cures polyneuritis in birds induced by a diet of polished rice. J Physiol 1911;43:395–400. 117. Funk C. The etiology of the deficiency diseases. Beri-beri, polyneuritis in birds, epidemic dropsy, scurvy, experimental scurvy in animals, infantile scurvy, ship beri-beri, pellagra. J State Med 1912;20: 341–368. 118. Needham J, Baldwin E, eds. Hopkins and biochemistry, 1861–1947. Cambridge, UK: Hefner, 1949. 119. Osborne TB, Mendel LB. Feeding experiments with isolated food-substances. Washington, DC: Carnegie Institute of Washington, 1911. Publication 156. 120. Osborne TB, Mendel LB. The relationship of growth to the chemical constituents of the diet. J Biol Chem 1913;15:311–326. 121. Hopkins FG. Feeding experiments illustrating the importance of accessory factors in normal dietaries. J Physiol 1912;44:425–460. 122. McCollum EV, Davis M. The necessity of certain lipins in the diet during growth. J Biol Chem 1913;15:167–175. 123. Mellanby E. The part played by an “accessory factor” in the production of experimental rickets. J Physiol 1918–1919;52:xi–xii. 124. Mellanby E. A further demonstration of the part played by accessory food factors in the aetiology of rickets. J Physiol 1918–1919;52:liii–liv. 125. McCollum EV, Simmonds N, Becker JE, Shipley PG. Studies on experimental rickets. 21. An experimental demonstration of the existence of a vitamin which promotes calcium deposition. J Biol Chem 1922;53:293–312. 126. Karrer P, Morf R, Schöpp K. Zur Kenntnis des Vitamins-A aus Fischtranen. Helv Chim Acta 1931;14:1036–1040. 127. Karrer P, Morf R, Schöpp K. Zur Kenntnis des Vitamins-A aus Fischtranen II. Helv Chim Acta 1931;14:1431–1436. 128. Holmes HN, Corbet RE. The isolation of crystalline vitamin A. J Am Chem Soc 1937;59:2042–2047. 129. Carpenter KJ, ed. Pellagra. Benchmark papers in biochemistry, vol. 2. Stroudsburg, PA: Hutchinson Ross, 1981. 130. Sambon LW. Progress report on the investigation of pellagra. J Trop Med Hyg 1910;13:289–300. 131. Etheridge EW. The butterfly caste: a social history of pellagra in the South. Westport, CT: Greenwood, 1972. 132. Searcy GH. An epidemic of acute pellagra. Alabama Med J 1907;20:387–392. 133. Report of the Pellagra Commission of the State of Illinois, November, 1911. Springfield, IL: State Journal, 1912. 134. Siler JF, Garrison PE, MacNeal WJ. The relation of methods of disposal of sewage to the spread of pellagra. Arch Intern Med 1914;14:453–474. 135. Terris M, ed. Goldberger on pellagra. Baton Rouge: Louisiana State University Press, 1964. 136. Goldberger J, Wheeler GA, Sydenstricker E. A study of the diet of nonpellagrous and of pellagrous households in textile mill communities in South Carolina in 1916. J Am Med Assoc 1918;71:944–949. 137. Goldberger J, Wheeler GA. Experimental pellagra in the human subject brought about by a restricted diet. Public Health Rep 1915;30:3336–3339. 138. Williams CD. A nutritional disease of childhood associated with a maize diet. Arch Dis Child 1933;8:423–433. 139. Orr E. The use of protein-rich foods for the relief of malnutrition in developing countries: an analysis of experience. London: Tropical Products Institute, 1972. 140. Pretorius PJ, Smith ZM. The effects of various skimmed milk formulae on the diarrhea, nitrogen retention and initiation of cure in kwashiorkor. J Trop Pediatr 1968;4:50–60. 141. Jelliffe DB. Protein-calorie malnutrition in tropical preschool children. J Pediatr 1959;54:227–256. 142. McLaren DS. The great protein fiasco. Lancet 1974;2:93–96. 143. Waterlow JC, Payne PR. The protein gap. Nature (London) 1975;258:113–117.
Chapter 1 / Historical Perspective 144. 145. 146. 147. 148. 149. 150. 151. 152. 153. 154. 155. 156. 157. 158. 159. 160.
161. 162. 163. 164. 165. 166.
167. 168. 169. 170. 171. 172.
173. 174. 175.
29
Silverstein AM. A history of immunology. San Diego, CA: Academic, 1989. Fox FW. Vitamin A and infection: a review of recent work. East Afr Med J 1933;10:190–214. Robertson EC. The vitamins and resistance to infection. Medicine 1934;13:123–206. Clausen SW. The influence of nutrition upon resistance to infection. Physiol Rev 1934;14:309–350. Blegvad O. Xerophthalmia, keratomalacia and xerosis conjunctivae. Am J Ophthalmol 1924;7:89–117. Blegvad O. Om xerophthalmien og dens forekomst i Danmark i aarene 1909–1920. København: Gyldendalske Boghandel, 1923. Bloch CE. Blindness and other diseases in children arising from deficient nutrition (lack of fat-soluble A factor). Am J Dis Child 1924;27:139–148. Bloch CE. Further clinical investigations into the diseases arising in consequence of a deficiency in the fat-soluble A factor. Am J Dis Child 1924;28:659–667. Green HN, Mellanby E. Vitamin A as an anti-infective agent. Br Med J 1929;2:691–696. Semba RD. Vitamin A as “anti-infective” therapy, 1920–1940. J Nutr 1999;129:783–791. Ellison JB. Intensive vitamin therapy in measles. Br Med J 1932;2:708–711. Semba RD. On Joseph Bramhall Ellison’s discovery that vitamin A reduces measles mortality. Nutrition 2003;19:390–394. Prescott SC, Proctor BE. Food technology. New York: McGraw-Hill, 1937. Lancet. Parliamentary Intelligence. Ottawa and cod-liver oil. Lancet 1932;2:978–979. British Medical Journal. Medical notes in Parliament. Ottawa Agreements: cod-liver oil. Br Med J 1932;2:661. British Medical Journal. Medical notes in Parliament. Ottawa Agreements: cod-liver oil. Br Med J 1932;2:819. Beaton GH, Martorell R, L’Abbe KA, Edmonston B, McCabe G, Ross AC, Harvey B. Effectiveness of vitamin A supplementation in the control of young child morbidity and mortality in developing countries. New York: United Nations, 1993. ACC/SCN State-of-the-Art Nutrition Policy Discussion Paper No. 13. Scrimshaw NS, Taylor CE, Gordon JE. Interactions of nutrition and infection. Geneva: World Health Organization, 1968. Beisel WR. Single nutrients and immunity. Am J Clin Nutr 1982;35(suppl):417–468. Chambers JD, Mingay GE. The agricultural revolution, 1750–1880. New York: Schocken, 1966. Price R. The modernization of rural France: communications networks and agricultural market structures in nineteenth century France. New York: St. Martin’s Press, 1983. Holmes CJ. Science and practice in English arable farming, 1910–1950. In: Diet and health in modern Britain. Oddy DJ, Miller DS, eds. London: Croom Helm, 1985. Aymard M. Toward the history of nutrition: some methodological remarks. In: Food and drink in history. Forster R, Ranum O, eds. Selections from the Annales Economies, Sociétés, Civilisations, vol. 5. Baltimore, MD: Johns Hopkins University Press, 1979:1–16. Toutain JC. La consommation alimentaire en France de 1789 à 1964. Geneva: Droz, 1971. Wohl AS. Endangered lives: public health in Victorian Britain. Cambridge: Harvard University Press, 1983. Buckley ME. The feeding of school children. London: Bell, 1914. Great Britain. Inter-Departmental Committee on Physical Deterioration. Report of the Inter-Departmental Committee on Physical Deterioration. London: Wyman, 1904. Burnett J. The rise and decline of school meals in Britain, 1860–1990. In: The origins and development of food policies in Europe. Burnett J, Oddy DJ, eds. London: Leicester University Press, 1994. Medical Research Committee. Report on the present state of knowledge concerning accessory food factors (vitamines), compiled by a committee appointed jointly by the Lister Institute and Medical Research Committee. London: Her Majesty’s Stationery Office, 1919. Mann HCC. Diets for boys during the school age. London: Her Majesty’s Stationery Office, 1926. Medical Research Council Special Report Series, No. 105. Nelson M. Social-class trends in British diet, 1860–1980. In: Food, diet and economic change past and present. Geissler C, Oddy DJ, eds. Leicester: Leicester University Press, 1993;101–120. Paton DN, Dunlop JC, Inglis E. A study of the diet of the labouring classes in Edinburgh, carried out under the auspices of the town council of the city of Edinburgh. Edinburgh: Otto Schulze, 1901.
30
Semba
176. Editorial. Diet of the labouring classes. Br Med J 1913;1:647. 177. Smith D, Nicolson M. Nutrition, education, ignorance and income: a twentieth century debate. In: The science and culture of nutrition, 1840–1940. Kamminga H, Cunningham A, eds. Amsterdam: Rodopi, 1995:288–318. 178. Orr JB. Food health and income: report on a survey of the adequacy of diet in relation to income. London: Macmillan, 1936. 179. Floud R, Wachter K, Gregory A. Height, health and history: nutritional status in the United Kingdom, 1750–1980. Cambridge, UK: Cambridge University Press, 1990. 180. McIntosh EN. American food habits in historical perspective. Westport, CT: Praeger, 1995. 181. Fogel RW, Engerman SL, Trussell J. Exploring the uses of data on height. Soc Sci History 1982;6: 401–421. 182. Lindhert PH, Williamson JG. Three centuries of inequality. In: Research in economic history, vol. 1. Sedling P, ed. Greenwich, CT: JAI, 1976:69–123. 183. US Bureau of the Census. Historical statistics of the United States, colonial times to 1970. Washington, DC: US Government Printing Office, 1975. 184. US Department of Agriculture. Consumption of foods in the United States, 1909–1952. Washington, DC: US Government Printing Office, 1953. Agricultural Handbook No. 62. 185. Apple RD. Vitamania: vitamins in american culture. New Brunswick, NJ: Rutgers University Press, 1996. 186. Newman G. Letter to Charles Flemming. July 28, 1939 (collection of the author). 187. Newman G. The building of a nation’s health. London: Macmillan, 1939. 188. Wrigley EA, Schofield RS. The population history of England, 1541–1871. Cambridge: Harvard University Press, 1981. 189. Livi-Bacci M. Population and nutrition: an essay on European demographic history. Cambridge, UK: Cambridge University Press, 1986. 190. Tranter NL. Population and society, 1750–1940: contrasts in population growth. London: Longman, 1985. 191. Schofield R, Reher D, Bideau A, eds. The decline of mortality in Europe. Oxford, UK: Clarendon Press, 1991. 192. Corsini CA, Viazzo PP, eds. The decline of infant and child mortality. The European experience: 1750–1990. The Hague: Kluwer Law International, 1997. 193. Hess AF. Rickets including osteomalacia and tetany. Philadelphia: Lea and Febiger, 1929. 194. Fee E, Porter D. Public health, preventive medicine, and professionalization: Britain and the United States in the nineteenth century. In: A history of education in public health. Health that mocks the doctors’ rules. Fee E, Acheson RM, eds. Oxford, UK: Oxford University Press, 1991:15–43. 195. Lesky E. The Vienna Medical School of the nineteenth century. Baltimore, MD: Johns Hopkins University Press, 1976. 196. Fee E. Disease and discovery: a history of the Johns Hopkins School of Hygiene and Public Health, 1916–1939. Baltimore, MD: Johns Hopkins University Press, 1987. 197. Curran JA. Founders of the Harvard School of Public Health, with biographical notes, 1909–1946. New York: Macy Foundation, 1970. 198. Flexner A. Medical education: a comparative study. New York: Macmillan, 1925. 199. Cottrell JD. The teaching of public health in Europe. Geneva: World Health Organization, 1969. 200. Moulin AM. The Pasteur Institutes between the two world wars. The transformation of the international sanitary order. In: International health organizations and movements, 1918–1939. Weindling P, ed. Cambridge, UK: Cambridge University Press, 1995:244–265. 201. Delaunay A. L’Institut Pasteur: des origines a aujourd’hui. Paris: Editions France-Empire, 1962. 202. Chick H, Hume M, Macfarlane M. War on disease: a history of the Lister Institute. London: Deutsch, 1971. 203. Ettling J. The germ of laziness: Rockefeller philanthropy and public health in the new South. Cambridge: Harvard University Press, 1981. 204. Farley J. The International Health Division of the Rockefeller Foundation: the Russell years, 1920– 1934. In: International health organizations and movements, 1918–1939. Weindling P, ed. Cambridge, UK: Cambridge University Press, 1995:203–221.
Chapter 1 / Historical Perspective
31
205. Cueto M. The cycles of eradication : the Rockefeller Foundation and Latin American public health, 1918–1940. In: International health organizations and movements, 1918–1939. Weindling P, ed. Cambridge, UK: Cambridge University Press, 1995:222–243. 206. Brown ER. Rockefeller medicine men: medicine and capitalism in America. Berkeley: University of California Press, 1979. 207. Williams RC. The United States Public Health Service, 1798–1950. Washington, DC: Commissioned Officers Association of the US Public Health Service, 1951. 208. Harden VA. Inventing the NIH: federal biomedical research policy, 1887–1937. Baltimore, MD: Johns Hopkins University Press, 1986. 209. Black M. The children and the nations: the story of UNICEF. Sydney: P.I.C. for UNICEF, 1986. 210. Phillips RW. FAO: its origins, formation and evolution, 1945–1981. Rome: Food and Agricultural Organization of the United Nations, 1981. 211. Salda ACM. Historical dictionary of the World Bank. Lanham, MD: Scarecrow Press, 1997. 212. Kapur D, Lewis JP, Webb R. The World Bank: its first half century. Washington, DC: Brookings Institution, 1997. 213. Berg A. The nutrition factor: its role in national development. Washington, DC: Brookings Institution, 1973. 214. Berg A. Malnutrition: what can be done? Lessons from World Bank experience. Baltimore, MD: Johns Hopkins University Press, 1987.
“This page left intentionally blank.”
2
Maternal Mortality in Developing Countries Carine Ronsmans, Simon Collin, and Véronique Filippi
2.1
INTRODUCTION
According to the latest estimates of the World Health Organisation (WHO) and the United Nations International Children’s Emergency Fund (UNICEF), 529,000 women still die every year from complications of their pregnancy, and nearly 90% of these deaths are in sub-Saharan Africa and Asia [1]. Obstetric complications continue to represent the major cause among women of childbearing age, far ahead of tuberculosis, suicide, sexually transmitted diseases, or AIDS [2]. While developed countries have made enormous progress in bringing down the huge death rates associated with pregnancy, women in developing countries continue to face very high risks of death and disability as a result of pregnancy. The risk of a woman dying as a result of pregnancy or childbirth during her lifetime is about 1 in 6 in the poorest parts of the world compared with about 1 in 30,000 in Sweden [3]. The growing awareness of the continuing high rates of maternal mortality during the early 1980s led to the launch of the Safe Motherhood Initiative in Nairobi in 1987. After this “call for action,” governmental and nongovernmental organisations joined forces to reduce the huge burden of maternal mortality in the world. Substantial progress has been made in documenting the extent of maternal ill health, and many of the actors involved have now embraced safer motherhood as among the highest priorities in public health practice. As a result, the reduction of maternal mortality is now one of the major targets promoted within the Millennium Development Goals set up by the United Nations in 2000 [4]. The recent World Health Report [2] also marked two decades of attention for Safe Motherhood and highlighted key strategies that may make pregnancy safer. The aim of this chapter is to review the evidence underlying the strategies proposed to reduce the huge burden of maternal mortality. It starts off by documenting the magnitude of maternal mortality while briefly highlighting the problems associated with its measurement. After a review of the main factors known to contribute to maternal mortality, the strategies that have been proposed to reduce the high levels of maternal mortality in the world are discussed.
From: Nutrition and Health: Nutrition and Health in Developing Countries, Second Edition Edited by: R. D. Semba & M. W. Bloem © Humana Press, Totowa, NJ
33
34
Ronsmans, Collin, and Filippi
This review explicitly focuses on the evidence linking maternal mortality with effective strategies, ignoring the fact that some of these strategies, while perhaps not proven effective to reduce maternal mortality, may have beneficial effects on the health of the unborn child or the woman in general. In doing so, an incomplete picture of intervention strategies to improve perinatal and women’s health in developing countries is presented. It is important, however, to separate the different entities to gain a better understanding of what we can hope to achieve in reaching the goal of a reduction in maternal mortality in poor countries.
2.2 2.2.1
MAGNITUDE AND CAUSES OF MATERNAL MORTALITY Measuring Maternal Mortality
The measurement of maternal mortality is surprisingly complex. The factors that make maternal mortality difficult to measure include (1) the uncertainty about the precise time period during which pregnant women are at higher risk of adverse health effects; (2) the lack of insight into the causes of death that are indirectly attributable to the pregnancy; and (3) the underreporting of pregnancy as a cause of death. In addition, the relative rarity of maternal deaths (in statistical terms) makes interpretation of trends in maternal mortality over time or between geographical areas very difficult. Traditionally, a death is defined as maternal if it occurs during pregnancy or within 42 days of its termination [5]. The length of the postpartum period at risk has varied substantially, however, and the tenth revision of the International Classification of Diseases (ICD-10) now acknowledges the need for an extended time period referring to “late maternal deaths,” which occur after 42 days and up to 1 year after delivery [6] (Table 2.1).
Table 2.1 Definition of maternal mortality (International Classification of Diseases, Tenth Edition) Maternal death: The death of a woman while pregnant or within 42 days of termination of pregnancy, irrespective of the duration and site of the pregnancy, from any cause related to or aggravated by the pregnancy or its management, but not from accidental or incidental causes Late maternal death: The death of a woman from direct or indirect obstetric causes more than 42 days but less than 1 year after termination of pregnancy Pregnancy-related death: The death of a woman while pregnant or within 42 days of termination of pregnancy, irrespective of the cause of death Direct obstetric death: The death of a woman resulting from obstetric complications of the pregnant state (pregnancy, labour, and puerperium); from interventions, omissions, incorrect treatment; or from a chain of events resulting from any of the above; includes conditions such as hypertensive diseases of pregnancy, haemorrhage, dystocia, genital tract sepsis, spontaneous or induced abortion. Indirect obstetric death: The death of a woman resulting from previous existing disease or disease that developed during pregnancy and was not due to direct obstetric causes but was aggravated by physiologic effects of pregnancy Source: Adapted from [6].
Chapter 2 / Maternal Mortality
35
Not all deaths during or shortly after pregnancy are due to the pregnancy. Traditionally, deaths from direct and indirect obstetric causes have been included in the maternal mortality statistic, while deaths from accidental and incidental causes have not (Table 2.1). Deaths from direct obstetric causes such as eclampsia, haemorrhage, obstructed labour, or puerperal sepsis are undoubtedly attributable to the pregnancy as such conditions can only occur in pregnant women. Far less certainty exists, however, regarding indirect obstetric causes, particularly those due to infectious diseases. The notion of “diseases aggravated by the pregnancy” is not straightforward, and some diseases may merely coincide with the pregnancy without being aggravated by it. In addition, the verbal autopsy methods on which most cause-of-death ascertainments are based may be unreliable, particularly for indirect causes of maternal death [7]. In settings that rely on verbal autopsy methods, all deaths in pregnant or recently delivered women are commonly included in the maternal mortality statistic (whether or not they are attributable to the pregnancy), except for deaths due to unintentional and intentional injuries [7–9]. However, it is becoming increasingly clear that the burden of indirect causes may have been underestimated, particularly in Africa, where the prevalence of HIV is high [10]. The exclusion of deaths from accidents, homicides, or suicides from the maternal mortality statistic is a matter of controversy, and there is a growing awareness that such deaths may, at least in part, be caused by the pregnancy [11, 12]. In India, deaths due to domestic violence were the second largest cause of death in pregnancy (16%) [13]. In Matlab, Bangladesh, 20% of deaths of pregnant unmarried women were due to suicide compared to 5% for married women, and pregnant girls were nearly three times more likely to die from violent causes than nonpregnant girls [11, 14]. Studies in developed countries suggested that suicide may be precipitated by pregnancy, and that some accidents may be pregnancy related, although a recent study in the United Kingdom did not support these findings [12, 15]. Authors of a recent systematic review of violence and pregnancy-related mortality have called for further research in this area, arguing that very few rigorous epidemiological studies exist [16]. Many pregnancy-related deaths still go unnoticed or unreported, and substantial errors in the estimates of maternal mortality persist [17, 18]. Correctly measuring maternal mortality requires not only a complete registration of deaths in women of reproductive age, which in many countries may be lacking, but also the recognition that the woman was pregnant or recently delivered at the time of her death. Deaths during early pregnancy, such as those due to abortion or ectopic pregnancy, are often not recognised or reported as pregnancy related, and death certificates often omit the notion of pregnancy. The verbal autopsy techniques on which many cause-of-death assignments are based may have poor reliability [7]. Maternal mortality is usually expressed in two different ways: the maternal mortality rate and the maternal mortality ratio. The rate is expressed as maternal deaths per 100,000 women of reproductive age. The maternal mortality ratio—sometimes erroneously called the maternal mortality rate—refers maternal deaths to the numbers of live births. The maternal mortality rate and ratio measure very different kinds of risks. The ratio measures the risk of death a woman faces with each pregnancy, whereas the rate measures the risks to women, whether or not they are pregnant. The rate is a compound measure of the level of fertility and the risks associated with each pregnancy. Any intervention lowering fertility will automatically lower the maternal mortality rate but
36
Ronsmans, Collin, and Filippi
not necessarily the ratio. As many assessments of progress in Safe Motherhood aim at separating the effects of lowering fertility from those directly aimed at improving the health of women once they are pregnant, the maternal mortality ratio has now become the preferred statistic [19]. Denominator information for the maternal mortality ratio is also easier to capture routinely, from hospital records or vital registration. The problems in the measurement of maternal mortality are such that maternal mortality has not always been recommended as an outcome measure against which to assess programme successes. Although hopes were raised that morbidity would be a good alternative measure, it has proven very difficult to measure the prevalence of maternal morbidity at the community level [20, 21]. In fact, very little is known about the incidence of obstetric complications in developing countries. The use of facilitybased data has been suggested as an alternative means to study programme effectiveness, and experience so far has been encouraging [9, 22, 23]. Investigation of women who had a near-miss obstetric morbidity, for example, may provide useful insights into the pathways leading to maternal death [24, 25]. Whether the measurement of near-miss or other life-threatening complications can inform programme success at the population level, however, is not known.
2.2.2
Medical Causes of Maternal Mortality
In developing countries as a whole, maternal mortality ratios range from 55 per 100,000 live births in eastern Asia to 920 per 100,000 in sub-Saharan Africa (Table 2.2). In many countries of East, Central, and West Africa, maternal mortality exceeds 1,000 deaths per 100,000 live births. The majority of maternal deaths in developing countries are due to five major direct obstetric complications: haemorrhage, infection, unsafe abortion, hypertensive disorders of pregnancy, and obstructed labour [19] (Fig. 2.1). While huge variations are seen in the relative contribution of each of the direct obstetric causes to mortality, deaths from intra- or postpartum haemorrhage tend to be the leading cause of death, with about one quarter of all deaths attributed to severe bleeding. Estimates for deaths from unsafe abortion have varied substantially, but the consequences of illegal abortions may still be Table 2.2 Estimates of maternal mortality by United Nations regions (2000) Maternal mortality ratio (maternal Region deaths per 100,000 live births) Sub-Saharan Africa 920 Southern Asia 540 Oceania 240 Southeastern Asia 210 Western Asia 190 Latin America and the Caribbean 190 Northern Africa 130 Commonwealth of Independent States 68 Eastern Asia 55 Source: From [4].
Chapter 2 / Maternal Mortality
37
Haemorrhage Hypertensive diseases Sepsis/ Infection Other direct Abortion Indirect causes
Fig. 2.1. Main causes of maternal death. (Adapted from [19].)
underestimated. Some authors have suggested that postpartum sepsis, a condition that carries a huge risk for the mother, may be declining in certain areas [26]. WHO has estimated that approximately 17% of maternal deaths worldwide are due to the so-called indirect obstetric causes, including anemia, cardiovascular diseases, and infections [19]. These figures are based on a small number of studies, however, and in settings with a high prevalence of HIV/AIDS, the contribution of infections may have increased [10, 27]. While there is no doubt that certain chronic diseases such as diabetes or cardiovascular disease or infections such as hepatitis are aggravated by the pregnancy, the common belief that the stresses of pregnancy lead to a breakdown of immune resistance allowing infectious diseases to set in is not always supported by strong epidemiological evidence [28]. The widely acknowledged association between tuberculosis and pregnancy, for example, has been challenged, and the authors concluded that tuberculosis is not associated with pregnancy [29]. Similarly, whether pregnancy accelerates the progression of HIV in HIV-infected women is still uncertain [27, 30], although a study in Uganda suggested that the risk of HIV acquisition may rise during pregnancy [31]. The overall impact of HIV on pregnancy-related mortality remains unclear [27]. Adverse effects of malaria during pregnancy on maternal health have been documented, but the increased prevalence and density of malaria parasitaemia in pregnant women are not necessarily associated with symptoms in the mother [32, 33]. The frequency and severity of malaria are of greater magnitude during pregnancy and the early postpartum period than outside pregnancy [34, 35]. In settings with low malaria transmission, the effects of malaria are particularly severe [36]. Malaria may also increase the risk of maternal death through its effect on maternal anemia [37].
38
Ronsmans, Collin, and Filippi
Severe anemia is believed to be an important cause of maternal death in developing countries, although much of the evidence is circumstantial [38]. Mild anemia in pregnancy may go unnoticed, but the potential adverse effects of pregnancy increase as hemoglobin levels fall. Very severe anemia with hemoglobin levels of less than 4 g/dL can lead to heart failure and death from shock [39]. It has also been suggested that anaemic mothers are less able to tolerate blood loss during childbirth, although this has never been empirically verified [40]. Severe anemia in pregnancy has been reported as the main cause of 8–23% of maternal deaths in some hospitals and 11–16% in community-based studies [41–43]. It was also the main cause of near-miss obstetric events in several African hospitals [25]. In Tanzania, symptoms such as severe weakness, pallor, shortness of breath, and peripheral oedema, which may be suggestive of anemia, were present in nearly half of maternal deaths [42]. In a hospital study in western Kenya, reproductive age women with hemoglobin levels below 6 g/dL were eight times more likely to die than women with a hemoglobin level of more than 6 g/dL [44]. In a multivariate analysis, severe anemia and HIV status were significant predictors of mortality, while pregnancy status was not. In other words, severe anemia carries a huge risk of death for women of reproductive age, but pregnancy may not aggravate that risk.
2.3
STRATEGIES TO REDUCE MATERNAL MORTALITY
The strategies that have been promoted as potentially effective ways to overcome the high rates of maternal mortality have been multiple [45], and substantial changes have occurred in recent decades. Initial efforts since the 1950s have focused on antenatal clinics and maternal education, followed by an emphasis on family planning [22]. In the 1970s, training and promotion of traditional birth attendants (TBAs) were introduced, while the 1990s were dominated by an emphasis on increased access to and quality of obstetric care. More recently, a new magic bullet has been introduced, namely, the nutritional supplementation of pregnant or reproductive age women. Relatively few of the strategies proposed in this recent time period have involved the medical profession directly as interventions such as family planning or antenatal care were thought to be deliverable by community health workers. Many of the suggested strategies were modelled after the experience with child survival programmes, and the desire for finding so-called cheap and community-based interventions has left many of the interventions unchallenged for long. Only in 1991, when Maine et al. published their influential work using evidence from the Kasongo study did the emphasis shift to the importance of professional delivery care [46]. Ensuring skilled medical attendance at delivery has now become the leading goal for maternal health programmes [45]. In reviewing the evidence in support of certain strategies, it has to be borne in mind that there is very little direct evidence linking maternal health interventions to maternal mortality [45]. The absolute numbers of maternal deaths are generally small, and large populations are needed to investigate the determinants of maternal mortality. For this reason, evidence from randomised controlled trials, the gold standard in health care evaluations, is seldom available to those trying to understand the strategies underlying maternal mortality reductions. Our knowledge so far is largely based on historical precedent in Western countries and on so-called thought experiments [47]. A main priority is the implementation of an effective intrapartum care strategy [45].
Chapter 2 / Maternal Mortality
2.4
39
SOCIOECONOMIC DEVELOPMENT, WOMEN’S EDUCATION, AND MATERNAL MORTALITY
There is no doubt that the poorest countries suffer the highest burden of maternal mortality. The maternal mortality ratio is often quoted as the statistic that most clearly highlights the huge gap between developed and developing countries. The women’s lifetime risk of maternal death is almost 40 times higher in the developing than in the developed world; and the highest maternal mortality ratios of 1,000 per 100,000 live births found in some regions of eastern and western Africa are as much as 100 times higher than those observed in some Western countries [3]. Yet, the relationship between high levels of maternal mortality and poverty is not straightforward. When De Brouwere and colleagues [48] mapped the maternal mortality ratios by gross national product (GNP) per capita for countries with a GNP per capita below US $1,000 in 1993, the estimates ranged from 22 to 1,600 per 100,000 without any clear association with the level of economic development (Fig. 2.2). Countries with a similar GNP per capita such as Vietnam, Uganda, and Burundi (US $170–180), for example, had maternal mortality ratios of 160, 1,200, and 1,300 respectively. Similarly, Loudon [49], in his excellent review of historical trends in maternal mortality in Western countries, could not explain the huge differences in the levels of maternal mortality between the United States, England and Wales, and the Netherlands in the earlier part of 1900s by differences in the social or economic context prevailing at that time in each of these countries (Fig. 2.3). In the 1920s, the United States experienced maternal mortality ratios as high as 689 per 100,000 live births, a figure not unlike many developing countries today. The Netherlands, in contrast, had already reached levels as low as 242 deaths per 100,000 live births, while England and Wales were at an intermediary level of 433. Loudon [49] remarked that, “Maternal mortality, unlike infant mortality, was remarkably insensitive to social and economic factors per se but remarkably sensitive to standards of obstetric care.” In most countries, the better-off are more fully covered by maternal health services than the poorest, and poor–rich differences are greater for higher-level than for primary
Fig. 2.2. Maternal mortality ratios by gross national product (GNP) per capita for countries with GNP 38°C), rupture of membranes for longer than 24 hours, and meconium (green fecal material from the fetal intestines that is discharged at or near the time of birth) staining of liquor [1]. The rates of LBW, IUGR, preterm births, and infant mortality are shown for selected countries in Table 3.2 [48]. LBW rates vary widely among the listed countries, with prevalences of 4–6% of live births in China and some of the most highly developed countries, 10–15% in developing countries in Latin America and Africa, 15–20% in some areas of South Asia, and nearly 30% in India [48]. The data shown in Table 3.2 should be interpreted with caution, however, because the country samples participating in the WHO Collaborative Study may not be generalizable to the entire birth cohorts of the respective countries. Table 3.2 also provides prevalence rates for preterm birth and IUGR, although caution is advised in interpreting the preterm data from developing countries given the aforementioned problems in accurate estimation of gestational age in many such settings. Despite these problems, the data clearly underline the point made, that is, that the main determinant of variation in LBW rates is the IUGR rate, and that the high LBW rates reported in some developing countries are largely attributable to high rates of IUGR.
Chapter 3 / LBW Neonatal Mortality
69
Table 3.2 Pregnancy outcome among countries participating in WHO Collaborative Study [27] Infant mortality LBW IUGR Preterm 1,000 (per live (% of live births) (% of live births) (% of live births) births) Argentina 6.3 9.7 7.2 24 China 4.2 9.4 7.5 38 Colombia 16.1 17.8 15.7 30 Cuba 8.1 14.7 7.2 9 Gambia 12.1 13.5 13.5 80 Guatemala 12.5 25.3 15.8 49 India (Pune) 28.2 54.2 9.7 76 Indonesia 10.5 19.8 18.5 50 Ireland 5.6 6.9 6.2 6 Malawi 11.6 26.1 8.2 138 Myanmar 17.8 30.4 24.6 105 Nepal (rural) 14.3 36.3 15.8 81 Sri Lanka 18.4 34.0 14.0 15 Thailand 9.6 17.0 21.3 27 United Kingdom 6.2 12.3 4.6 6 a U.S./CDC (black) 10.6 11.2 16.6 a U.S./CDC 4.8 5.8 10.2 (Hispanic) a U.S./CDC (white) 6.0 6.9 9.3 Vietnam 5.2 18.2 13.6 34 CDC Centers for Disease Control and Prevention, IUGR intrauterine growth restriction, LBW low birth weight a For U.S. overall, 8 per 1,000.
United Nations International Children’s Emergency Fund (UNICEF) data [48] on infant mortality also vary widely, with rates varying inversely with level of socioeconomic development. Developing countries other than Cuba report generally higher rates of both LBW and infant mortality than developed countries. Table 3.2 also demonstrates several notable exceptions, however. Argentina, China, and Vietnam all report high infant mortality despite low rates of LBW, whereas in Sri Lanka the reverse pattern is seen. These results reflect large differences in birth-weight-specific mortality owing to variations in access to and quality of high-risk obstetric and neonatal care. The extremely high infant mortality reported for Malawi and Myanmar also indicates high birth-weight-specific mortality. The WHO Collaborative Study demonstrated that maternal height, prepregnancy body mass index (BMI; in kg/m2), and gestational weight gain are considerably lower in developing countries compared with industrialized countries (Table 3.3) [27]. In many respects, the data parallel those shown in Table 3.2 for IUGR, which is concordant with the important effects of these anthropometric factors on fetal growth [26].
70
Semba and Victora
Table 3.3 Maternal anthropometric measures (means) among countries participating in WHO Collaborative Study [27] Country Height (cm) Prepregnancy BMI Weight gain (kg) Argentina 157 22.4 10.8 Myanmar 151 19.8 — China 160 19.5 11.7 Colombia 155 23.3 10.1 Cuba 157 21.8 4.6 Gambia 157 19.7 6.5 Guatemala 148 20.8 7.1 India (Pune) 150 18.3 — Indonesia 149 20.2 — Ireland 158 23.7 11.0 Malawi 155 21.0 4.7 Nepal (rural) 150 19.5 — Sri Lanka 150 18.8 — Thailand 153 20.8 8.0 UK 159 22.2 11.6 U.S./CDC (black) 162 23.1 13.5 U.S./CDC (Hispanic) 158 23.7 12.8 U.S./CDC (white) 163 22.6 14.4 Vietnam 152 19.6 5.6 BMI body mass index, CDC Centers for Disease Control and Prevention
3.5
CAUSES OF NEONATAL DEATH
The main causes of neonatal deaths identified in the year 2000 by WHO were preterm birth, severe infections, tetanus, diarrhea, complications of asphyxia, and congenital abnormalities (Fig. 3.3) [1]. Added together, infections accounted for the largest proportion of neonatal deaths (36%), followed by preterm birth (28%), and birth asphyxia (23%), and 60–80% of neonatal deaths occurred among low birth weight babies [1].
3.6
INFLUENCE OF MATERNAL FACTORS
From a public health standpoint, the importance of an etiologic determinant is reflected by its etiologic fraction (also called the population-attributable risk). The etiologic fraction in turn depends both on the determinant’s relative risk for the particular pregnancy outcome and on its prevalence in the population.
3.6.1
Maternal Factors and Intrauterine Growth Restriction
In developing countries, low gestational weight gain, prepregnancy BMI, and short stature are associated with large etiologic fractions for IUGR [26]. The large etiologic fractions are the consequences not only of the high relative risk for individual women with these anthropometric risk factors but also of their high prevalence in developing country settings. A summary of the relative risks for associations between maternal anthropometric indicators and IUGR is shown in Table 3.4, again based primarily on findings from the WHO Collaborative Study [27].
Chapter 3 / LBW and Neonatal Mortality
71
Table 3.4 Association between low values (lowest quartile) of anthropometric indicators and IUGR and preterm birth, from the WHO Collaborative Study Preterm birtha Anthropometric indicator IUGRa Short stature 1.9 (1.8–2.0) 1.2 (1.1–1.2) Low prepregnancy BMI 1.8 (1.7–2.0) 1.3 (1.1–1.4) Weight gain to mo 5 1.8 (1.4–2.4) 0.4 (0.3–0.6) Weight gain to mo 7 1.8 (1.5–2.2) 0.7 (0.6–0.9) Source: Adapted from [38]. BMI body mass index, IUGR intrauterine growth restriction a Odds ratios and 95% confidence intervals.
Another important aspect of maternal nutrition concerns work and energy expenditure during pregnancy. This is particularly important in developing countries, where women often work in strenuous agricultural activities, in seeking and carrying water for the family, and in other physically demanding domestic tasks [49]. Although few epidemiologic studies carried out in developing countries have examined the relationship between energy expenditure and pregnancy outcome, it seems reasonable to assume that if energy intake is limited, either by availability or cost, heavy energy expenditure during pregnancy can lead to insufficiently positive (or even negative) maternal energy balance and thereby increase the risk of IUGR. Studies from the Gambia clearly demonstrated that the combination of reduced food availability and heavy agricultural work had a negative impact on both maternal weight gain and fetal growth [50].
3.6.2
Maternal Stature and Preterm Birth
Anthropometric factors that appear etiologically important for IUGR are not nearly so important for preterm birth [26, 27]. As shown in Table 3.4, the WHO Collaborative Study found small increases in the relative risk for preterm birth associated with short stature and low prepregnancy BMI. Methodologic problems pervade studies relating gestational weight gain to preterm birth. Preterm pregnancies are associated with a lower total weight gain merely because women have had a shorter period of time in which to gain weight. The evidence concerning the effects on preterm birth of rate of weight gain, or of weight gain in early pregnancy, is conflicting. In fact, the WHO Collaborative Study found that low weight gain was protective against preterm birth [27], although this finding is not consistent with other studies [51].
3.6.3
Maternal Nutrition and Fetal Death
In studies of developed countries [52–55] and one study from Brazil [56], antepartum fetal death was associated with high prepregnancy BMI (obesity) rather than with low prepregnancy BMI. Although fetal death has been poorly studied in developing countries, it may be true that the low prepregnancy BMI characteristic of clearly undernourished mothers in such countries would also be associated with an increased risk. Low gestational weight gain is also associated with antepartum fetal death, particularly when it results in a severely growth-restricted fetus. In a randomized trial from the Gambia, balanced energy/protein supplementation resulted in an increase in gestational weight gain and a reduced risk of stillbirth, although the timing of the stillbirths (antevs. intrapartum) was not specified [50]. Nonetheless, antepartum fetal death is largely
72
Semba and Victora
determined by nonnutritional factors, including inadequate prenatal care surveillance and delayed referral when fetal or maternal pathology is detected. These health care system factors are particularly important in some developing country settings, where the training of prenatal care providers and the availability of highly trained specialists may be inadequate [18]. In other developing countries, however, high-risk obstetrics may be all too accessible. Brazil, for example, has recently witnessed an epidemic of caesarean section [57]. In developed countries, prenatal care surveillance, diagnostic procedures, referral, and early intervention (induction or caesarean section) have probably been responsible for the continued fall in antepartum stillbirths. Intrapartum stillbirths are often associated with obstructed labor. This is more likely to occur in women of short stature and thus constitutes a greater potential risk in women from developing countries [27], particularly when access to emergency obstetric care and caesarean section is a problem [18–20]. Moreover, obesity is becoming more prevalent in many developing countries [58], and it is a known determinant of macrosomia [59–61]. A large fetus can result in a difficult delivery and, again, if emergency obstetric facilities are not readily available, can greatly increase the risk of fetal death [16, 17]. The importance of well-trained birth attendants, and of prompt transfer and transport when problems arise, cannot be overemphasized in this regard.
3.6.4
Maternal Factors and Early Neonatal Death
Because most early neonatal deaths in developed countries occur among extremely preterm infants, the etiologic determinants of early neonatal death are similar to those for preterm birth. Severely growth-restricted infants are also at risk for early neonatal death [62], but in most developed countries, such infants, if born alive, are likely to survive and to survive intact. As mentioned, severely growth-restricted infants are known to have an increased risk of hypoglycemia and hypercalcemia and of stroke and other complications owing to polycythemia and high blood viscosity [62]. In the context of modern neonatal intensive care, these complications of IUGR are treatable. Obviously, however, in developing countries where access to such care is difficult or impossible, IUGR is likely to play a more important role in neonatal death, particularly from infection [45–47, 63].
3.7
INTERVENTIONS TO IMPROVE NEONATAL SURVIVAL
The Lancet Neonatal Survival Steering Team reviewed 46 interventions aimed at improving neonatal survival and identified 16 interventions that had proven efficacy and that could be combined into packages of health care delivery [64]. These 16 interventions are presented separately below. The evaluation of these and other interventions have been reviewed in greater detail by Bhutta and colleagues [12].
3.7.1
Folic Acid Supplementation
Folate is a water-soluble B complex vitamin that serves as a coenzyme for singlecarbon transfers involved in the metabolism of nucleic acids and amino acids. Maternal folate intake was originally reported by Hibbard in the 1960s to be associated with the occurrence of neural tube defects [65]. Neural tube defects are the most common major congenital malformation of the central nervous system, and these defects include
Chapter 3 / LBW and Neonatal Mortality
73
anencephaly (fatal form in which there is partial absence of brain tissue); craniorachischisis (fatal form in which the area from brain to spinal cord is dysplastic and lacks covering by dura, muscle, or skin); meningomyelocele (midline defect of the spinal cord characterized by dysplasia of neural tissues and meninges to form a cystic expansion); and meningocele (a meningomyelocele that involves only the meninges). Clinical trials have shown that periconceptual folic acid supplementation has a strong protective effect against neural tube defects [66].
3.7.2
Tetanus Toxoid Immunization
Tetanus, an acute and often fatal disease caused by Clostridium tetani, may occur in newborn infants who are born without a sufficient level of maternal antibodies to protect their infants against infection. In 2000, neonatal tetanus accounted for an estimated 200,000 deaths worldwide, and over 90% of the neonatal cases of tetanus occurred in developing countries [67]. Neonatal tetanus can be prevented by vaccination of pregnant or nonpregnant women with tetanus toxoid [68]. Two doses of tetanus toxoid are administered as part of antenatal care on the primary care level.
3.7.3
Syphilis Screening and Treatment
Congenital syphilis is an infection caused by the spirochete Treponema pallidum and passed from mother to infant during the fetal period or birth. It is estimated that there are more than 500,000 fetal deaths a year from congenital syphilis worldwide [69]. Most pregnant women with syphilis are asymptomatic, and syphilis infection must be diagnosed using serological testing, such as a rapid plasma reagin (RPR) test [70]. Penicillin treatment is effective in the treatment of syphilis in pregnancy and the prevention of congenital syphilis, but questions remain regarding the optimal treatment regimens [71]. At the primary care level, pregnant women are screened for syphilis using RPR and if the test is positive, are treated with benzathine penicillin.
3.7.4
Preeclampsia and Eclampsia Prevention (Calcium Supplementation)
Preeclampsia is part of the spectrum of conditions known as the hypertensive disorders of pregnancy and affects 2–8% of pregnancies [72]. Preeclampsia is characterized by the development of elevated blood pressure and proteinuria after the 20th week of pregnancy, and its etiology is poorly understood. The complications of preeclampsia include seizures (eclampsia), stroke, blindness, renal cortical and tubular necrosis, pulmonary edema, laryngeal edema, jaundice, blood clotting disorders, placental infarction or abruption, fetal death, preterm birth, and IUGR [72]. Calcium supplementation during pregnancy has been shown to reduce the risk of preeclampsia, especially among those with a low calcium intake [73]. At the level of primary care, pregnant women receive blood pressure measurements, a urine test for proteinuria, and referral if they have preeclampsia or eclampsia.
3.7.5
Intermittent Presumptive Treatment for Malaria
Malaria in pregnancy is a leading cause of maternal, fetal, and neonatal morbidity and mortality [74]. Women who were semi-immune to malaria before pregnancy may lose some of their immune protection against malaria when pregnant, and they may develop placental malaria, or the sequestration of large numbers of malarial parasites in the
74
Semba and Victora
placenta when none can be found in the blood. Thus, a negative blood slide for malaria parasites does not necessarily exclude the diagnosis of malaria among pregnant women in areas holoendemic for malaria. Among pregnant women in malaria endemic areas, treatment for malaria reduces parasitemia, placental malaria, severe maternal anemia, and perinatal mortality and increases birth weight [75].
3.7.6
Detection and Treatment of Asymptomatic Bacteriuria
Asymptomatic bacteriuria is a persistent bacterial infection of the urinary tract that has no specific symptoms, and it occurs in 5–10% of all pregnancies [76]. Asymptomatic bacteriuria may contribute to preterm birth, LBW, and pyelonephritis in the mother. The risk of pyelonephritis (kidney infection) may be higher during pregnancy because of obstruction of the urine flow during pregnancy and increased urine stasis. Quantitative culture with the detection of more than 100,000 bacteria/milliliter is considered the definitive diagnostic test, and Escherichia coli is the most common pathogen found, followed by other gram-negative bacteria and group B streptococci [76]. Antibiotic treatment is effective in clearing the asymptomatic bacteriuria, reducing the risk of pyelonephritis and reducing the incidence of preterm birth or LBW babies [76]. At the level of primary care, pregnant women are screened for bacteriuria and if the screening is positive, are treated with amoxicillin.
3.7.7
Antibiotics for Preterm Premature Rupture of Membranes
Preterm rupture of the fetal membranes (PROM) occurs in 2.0–3.5% of pregnancies and increases the risk of infection for both mother and child and increases the risk of preterm delivery and associated complications of prematurity. PROM that occurs before 37 weeks’ gestation is referred to as preterm premature rupture of the membranes (PPROM). PPROM occurs in about 1% of all pregnancies and is an antecedent of 30–40% of preterm deliveries [77]. PPROM is the leading identifiable cause of preterm delivery and its complications, which can include respiratory distress syndrome, neonatal infection, and intraventricular hemorrhage [77]. The etiology of PROM is multifactorial, and infection, inflammation, hormones, apoptosis, and mechanical factors have been implicated [77]. Antibiotic treatment for PPROM is associated with a delay in delivery and a reduction in neonatal and maternal morbidity [78]. Erythromycin is an effective treatment, but amoxicillin/clavulanic acid should be avoided because it can increase the risk of necrotizing enterocolitis (acute inflammation in the intestines of a newborn that can cause necrosis of intestinal tissues) [78].
3.7.8
Corticosteroids for Preterm Labor
Respiratory distress syndrome occurs in about 10% of preterm infants and is characterized by lack of lung surfactant, a substance that maintains the structure of air sacs and allows them to inflate with air. In respiratory distress syndrome, the infant develops breathing problems because the air sacs collapse. Complications of respiratory distress syndrome include intraventricular hemorrhage (bleeding into the ventricles of the brain) and pneumothorax (collapse of the lung). Administration of corticosteroids to women expected to give birth preterm is associated with a significant reduction in mortality, respiratory distress syndrome, and intraventricular hemorrhage in preterm infants
Chapter 3 / LBW and Neonatal Mortality
75
[79]. For women with suspected preterm labor, steroids are administered antenatal and intrapartum, and women are followed with inpatient care.
3.7.9
Detection and Management of Breech
Breech presentation, the position during labor in which the buttocks or feet appear first, occurs in about 4% of term deliveries [80]. About one quarter to one half of breeches are undiagnosed until after the onset of labor [81]. Breech presentation increases the risk of cord prolapse, fetal hypoxia or asphyxia, and obstructed labor, and breech presentation is among the leading indicators for cesarean section [82]. External cephalic version is a procedure that externally rotates the fetus from a breech presentation to a vertex (head first) presentation [80]. Persistent breech presentation requires a cesarean section in a referral center.
3.7.10
Labor Surveillance
The partograph has been used as tool for monitoring labor and to identify women who may develop complications and need obstetrical intervention [83]. A new version of the partograph was introduced in 2000 [84]. Fetal heart rate, amniotic fluid, molding, cervix diameter, contractions per 10 minutes, pulse, blood pressure, temperature, urine chemistry, and use of drugs are recorded in the WHO partograph [84].
3.7.11
Clean Delivery Practice
Clean delivery practice for home births consists of hand washing for delivery and newborn care, use of clean instruments for cord cutting, and clean umbilical cord care. The training of traditional birth attendants in clean delivery practice and the provision of clean delivery kits reduce neonatal tetanus, neonatal mortality, and sepsis [12].
3.7.12
Resuscitation of Newborn Baby
Birth asphyxia, or failure to establish breathing at birth, is a major cause of neonatal mortality [12]. Approximately 5–10% of newborn infants require some assistance to begin breathing within the first 5 minutes after delivery [85]. Interventions for birth asphyxia include simple resuscitation techniques (mouth-to-mouth resuscitation), and traditional birth attendants and primary care staff are capable of learning and using these techniques.
3.7.13
Breast-feeding
Breast-feeding provides the foundation for neonatal health and is greatly protective against neonatal mortality [86] as well as against mortality in infancy and in the second year of life [87]. Breast-feeding helps to prevent hypothermia and hypoglycemia in newborn infants and provides protection against sepsis, acute respiratory tract infections, meningitis, omphalitis (umbilical infection), and diarrhea [86]. Breast milk contains maternal antibodies and other immunological factors that provide both passive and active immunological protection of the neonate. Colostrum is higher in protein and micronutrients than normal milk and helps to facilitate the establishment of normal flora in the digestive tract. Breast-feeding promotion and support by community workers is known to be effective in increasing breast-feeding duration and exclusiveness [12].
76
Semba and Victora
3.7.14
Prevention and Management of Hypothermia
At birth, infants are exposed to a colder temperature than experienced in utero, and infants are risk of losing heat soon after birth unless measures are taken to prevent this heat loss. In the newborn period, hypothermia has been associated with morbidity such as increased risk of infection, coagulation defects, metabolic abnormalities, hyaline membrane disease, and brain hemorrhage [12, 88]. Early suckling has been shown to protect against low body temperature in the neonate [89]. Skin-to-skin contact of the neonate with the mother, so-called kangaroo mother care (Section 3.7.15) has been emphasized as a low-cost intervention to prevent hypothermia. Other ways to prevent hypothermia include warming the room and immediately drying and wrapping the infant after delivery.
3.7.15
Kangaroo Mother Care
Kangaroo mother care is a technique for care of LBW infants that is characterized by skin-to-skin contact between the mother and her newborn, frequent or nearly exclusive breast-feeding, and early discharge from the hospital [90]. Kangaroo mother care has been shown to reduce nosocomial infection, severe illness, and lower respiratory tract disease and to increase infant weight gain [90]. Evidence on mortality reduction is not conclusive, in large part due to the absence of large, well-designed studies, but data on the reduction of severe illness are impressive.
3.7.16
Community-Based Pneumonia Case Management
A case management approach has been advocated as a simple and feasible intervention to reduce pneumonia case fatalities, which account for 20% of all child deaths (see Chapter 7). The assumptions of this approach are that a high proportion of potentially fatal bacterial pneumonia is cause by Haemophilus influenza and Streptococcus pneumoniae, that timely use of antibiotic therapy can reduce pneumonia case fatality, that a simple algorithm based on counting respiratory rates is sensitive and specific enough to identify those children who require antibiotic therapy, and that health care workers can use this algorithm to provide antibiotics to children [91]. A meta-analysis has shown that pneumonia case management reduces pneumonia mortality among neonates by 42% [91].
3.8
NUTRITIONAL INTERVENTIONS
The use of folic acid supplementation for prevention of neural tube defects (Section 3.7.1) and calcium supplementation for reducing the risk of preeclampsia (Section 3.7.4) have been described previously. Various nutritional interventions have been evaluated in pregnant women and for neonates and are described next.
3.8.1
Protein-Energy Supplementation
Interventions to increase protein-energy intake of pregnant women have included giving dietary advice to pregnant women, providing balanced energy/protein supplements during pregnancy, providing high-protein nutritional supplements during pregnancy, and providing isocaloric protein supplements, as examined in a meta-analysis [92]. For overweight women or those with high weight gain, energy/protein restriction has been evaluated.
Chapter 3 / LBW and Neonatal Mortality
77
Nutritional advice to increase energy and protein intake resulted in increased intake but had no consistent benefit for pregnancy outcomes [92]. Analysis of five trials [93–97] showed mean increases of 105.61 (95% confidence interval [CI] 18.94 to 230.15 kcal/day) for energy intake and 17.99 (95% CI −1.48 to 37.45) g/day for protein [92]. Balanced energy/protein supplementation in a large number of trials [50, 98–109] overall showed an increase in maternal weight gain and mean birth weight and a substantial reduction in SGA birth [92]. Pooled results from these trials showed that balanced energy/protein supplementation resulted in a gestational weight gain of 20.74 (95% CI 1.46 to 40.02) g/week, an increase in mean birth weight of 37.62 (95% CI −0.21 to 75.45) g, and reduction of the incidence of SGA birth (relative risk [RR] 0.68, 95% CI 0.56 to 0.84) [92]. There was no apparent effect on fetal growth in the largest trials of highest methodological quality [92]. High-protein supplementation during pregnancy in two trials [110, 111] showed no apparent benefit for weekly maternal weight gain and a nonsignificant decrease in birth weight of −58.37 (95% CI −146.23 to 29.50) g [92]. Isocaloric protein supplementation in three trials [103, 104, 111] showed a nonsignificant impact on gestational weight gain. The largest trial conducted in Chile showed an increased risk of SGA birth (RR 1.35, 95% CI 1.12 to 1.61) [111]. Energy/protein restriction was associated with a reduction in maternal weight gain in two trials [112, 113] of −254.81 (95% CI −436.56 to −73.06) g/week [92]. In three trials, there was an inconsistent effect on birth weight, but trials were conducted in Scotland [113] and Egypt [114].
3.8.2
Maternal Iron Supplementation
Iron deficiency anemia is highly prevalent among pregnant women worldwide, and severe anemia in pregnancy has been associated with increased risk of maternal and perinatal mortality [115]. The amount of dietary iron may be insufficient to meet the needs of increased demands for iron by the mother and growing fetus for a large proportion of women, and in developing countries, low consumption of iron-rich foods, malaria, and helminthic infections may further exacerbate the situation. Meta-analysis of 20 trials of iron supplementation trials for pregnant women showed that supplementation reduced the incidence of low maternal hemoglobin in late pregnancy but had no effect on birth outcomes [116]. In developing countries, iron supplementation has a substantial impact on reducing maternal anemia [117–121]. Current WHO/UNICEF guidelines recommend iron-folate supplementation for pregnant women where anemia is highly prevalent [12].
3.8.3
Maternal Iodine Supplementation
Iodine is essential for brain and cognitive development (see Chapter 17), and three trials conducted in developing countries suggested that maternal iodine supplementation or addition of iodine to drinking water supply reduced cretinism and improved child survival [122, 123], increased birth weight [124], and reduced neonatal mortality [125]. Iodine supplementation of pregnant women is not widely practiced, even in areas of endemic iodine deficiency, as universal salt iodization is considered the main intervention to control endemic iodine deficiency. However, iodized salt may not reach some high-risk populations for whom fish sauce is used as the main source of salt, as in the Mekong Delta of Vietnam.
78
3.8.4
Semba and Victora
Antenatal Vitamin A or b-Carotene Supplementation
Antenatal supplementation with preformed vitamin A, β-carotene, or a combination of the two has been evaluated in clinical trials in Asia and Africa among HIV-infected women [126–128] and among women in lowland Nepal [129]. Among HIV-infected pregnant women in Tanzania, supplementation with megadose β-carotene (30 mg/day) plus 5,000 IU of vitamin A had no effect on fetal growth or fetal loss [126], while the same combination of daily β-carotene and vitamin A significantly reduced preterm delivery but had no impact on fetal mortality among HIV-infected pregnant women in South Africa [127]. In a clinical trial that used preformed vitamin A alone (10,000 IU/day), HIV-infected pregnant women receiving supplementation had a significant reduction in incidence of LBW and an improvement in hemoglobin among their infants [128]. In a large trial in Nepal, weekly antenatal vitamin A or β-carotene supplementation had no impact on fetal loss, neonatal mortality, or prevalence of preterm births [129]. Megadoses of β-carotene of 20–30 mg/day have been associated with increased mortality in humans [130], and adverse effects of megadose β-carotene have been attributed to increased oxidative stress and impairment of mitochondrial function caused by excentric cleavage products of β-carotene [130–132].
3.8.5
Antenatal Zinc Supplementation
Zinc is required for normal growth, immunity, and development (see Chapter 15), and animal studies and some human data suggested that there was an association between maternal zinc status and birth outcomes [133, 134]. Antenatal zinc supplementation has been evaluated in many controlled clinical trials, and a meta-analysis showed that maternal zinc supplementation had no impact on birth weight but a small effect on reduction of preterm births [135]. It has been pointed out that many of the zinc supplementation trials took place in developed countries, and it is not conclusive whether zinc supplementation has no benefit for pregnant women in populations with more prevalent malnutrition [12]. However, the overall evidence does not support the use of zinc supplementation alone for pregnant women [12].
3.8.6
Multiple Micronutrient Supplementation
Although prenatal multivitamins are standard of care in many developed countries, there have been few controlled clinical trials that examined whether there is any benefit to pregnant women and birth outcomes. Randomized clinical trials of multiple micronutrient supplements are currently being conducted in developing countries such as Nepal, Pakistan, Guinea-Bissau, Bangladesh, and Indonesia. One trial in Nepal suggested that multiple micronutrient supplementation does not give any additional advantage over iron-folate supplements and may actually increase perinatal and neonatal mortality because of obstructed labor [136–138].
3.8.7
Reduction in Childhood Stunting
A long-term intergenerational strategy to improve neonatal morbidity and mortality may be to reduce childhood stunting, such that women have greater stature at the time of childbearing. Improved childhood nutrition, particularly in the first 2 to 3 years, would reduce the prevalence of childhood stunting and of consequent maternal short stature [139, 140]. In the long term, this should help reduce the risks of intrapartum fetal death, IUGR, and (to a lesser degree) preterm birth in developing countries [26, 27].
Chapter 3 / LBW and Neonatal Mortality
3.8.8
79
Prevention of Maternal Obesity
Maternal obesity is increasing in many developed countries [141–143] and is even becoming prevalent in some developing ones, especially in Latin America [58] (see Chapters 20 and 21). Given its strong association with both antepartum and intrapartum fetal death, reduction in maternal obesity would help reduce these adverse pregnancy outcomes, although such reduction could theoretically increase the risk of IUGR. Unfortunately, however, data on the efficacy of interventions to prevent or treat obesity are extremely discouraging. New preventive and therapeutic interventions are urgently required in both developed and developing countries to stem this worrisome epidemic.
3.9
IMPLEMENTATION OF INTERVENTIONS TO REDUCE LOW BIRTH WEIGHT AND NEONATAL MORTALITY
The Millennium Development goals include a commitment by the international community to reduce mortality in children aged 5 and under by two thirds from 1990 to 2015 [1]. It will not be possible to meet this goal without having a substantial reduction in neonatal mortality since neonatal mortality accounts for a large proportion of mortality in those younger than 5 years [1, 7]. Many effective interventions are known to reduce neonatal mortality, as presented in this chapter, and developing countries will need to scale up the magnitude of these interventions. Scaling up interventions, however, is a complex enterprise that needs to take several dimensions into account [144]. A four-step strategy has been proposed to scale up neonatal health that consists of assessing the situation and creating a policy environment conducive to neonatal health, achieving optimal neonatal care with the constraints of the situation, systematically scaling up neonatal care, and monitoring coverage, effect, and cost [9]. Martines and colleagues have proposed that progress of interventions to improve neonatal survival should be based on the following indicators: (1) neonatal mortality rate, (2) coverage of antenatal care and tetanus toxoid vaccination; (3) skilled care at birth; (4) exclusive breast-feeding, proportion of newborn babies breast-fed within 1 hour of delivery, proportion of infants exclusively breast-fed at 1 and 6 months of age; (5) postnatal care visit within 3 days of birth; and (6) proportion of births registered [7].
3.10
CONCLUSIONS
High neonatal and perinatal mortality are a major public health problem in many developing countries. Although high IUGR rates may contribute to this high mortality, it is caused largely by high birth-weight-specific (and gestational age-specific) mortality owing to inadequate access to trained birth attendants, high-risk obstetric care, and neonatal intensive care. The gestational age distribution also plays an important role. Even though data are sparse on prevalence of preterm birth in developing country settings, perinatal mortality is so much higher among preterm infants (particularly those born before 32 weeks) that preterm birth prevention should become a high priority for developing countries as well. The fetal growth (birth weight-for-gestational age) distribution plays a less-important role, although severely growth-restricted infants are at greatly increased risk of perinatal death in developing countries. Because maternal undernutrition is a major contributor to IUGR in developing country settings, it may play an important role in perinatal mortality. The etiologic contribution of IUGR is probably
80
Semba and Victora
even more important in the suboptimal long-term growth and development of children in such settings. Maternal undernutrition, particularly low prepregnancy BMI, is also likely to increase the risk of preterm birth and therefore of early neonatal death. One of the challenges for developing countries will be to reduce maternal undernutrition without encouraging a concomitant epidemic of maternal obesity. Maternal overnutrition has been demonstrated to have adverse consequences for both offspring and mother. These consequences may be even more important in settings without ready access to emergency obstetric care and caesarean section. It would be unfortunate indeed if developing countries compounded their problems in perinatal health by experiencing the same epidemic in obesity now plaguing so many developed countries. Work on neonatal survival [7, 9] showed that it is possible to achieve substantial reductions in early deaths through reaching universal coverage with simple, cost-effective interventions.
3.11 ●
●
●
●
●
●
RECOMMENDATIONS
Clinical and public health interventions should focus on reducing perinatal mortality, among both low- and normal-weight infants, rather than on preventing LBW. These interventions include institutional (hospital or clinic) delivery, access to caesarean section and other aspects of emergency obstetric care, and training of local health workers to recognize and treat neonatal sepsis (infection). Where universal institutional delivery is still a long way in the future, community-based strategies for providing simplified antenatal care, including tetanus immunization, clean delivery, newborn resuscitation, breast-feeding promotion, and antibiotic treatment of pneumonia and sepsis, will contribute to substantially reduce newborn mortality. Where maternal undernutrition is prevalent, universal balanced energy/protein supplementation should be offered. Other successful nutritional interventions are likely to be limited to prevention of neural defects through folate fortification of food or periconceptual supplementation. Priorities for future research include additional randomized trials of zinc, folate, and calcium supplementation and observational studies of possible interactions between common nutritional deficiencies (iron, zinc, folate, and vitamin A) and the microbial agents causing neonatal sepsis. Effectiveness studies using randomized or observational designs are important to assess the impact of interventions when these are rolled out on a large scale.
REFERENCES 1. Lawn JE, Cousens S, Zupan J, for the Lancet Neonatal Survival Steering Team. Four million neonatal deaths: When? Where? Why? Lancet 2005;365:891–900. 2. McCormick MC. The contribution of low birth weight to infant mortality and childhood morbidity. N Engl J Med 1985;312:82–90. 3. World Health Organization. Physical status: the use and interpretation of anthropometry. Geneva: World Health Organization, 1995. WHO Technical Report Series No. 854. 4. Barker DJ. Fetal origins of coronary heart disease. BMJ 1995;311:171–174. 5. Murray CJL, Lopez AD, eds. The global burden of disease: a comprehensive assessment of mortality and disability from diseases, injuries, and risk factors in 1990. Cambridge: Harvard University Press, 1996. 6. McKeown T. The modern rise of population. London: Arnold, 1976. 7. Martines J, Paul VK, Bhutta ZA, Koblinsky M, Soucat A, Walker N, et al. Neonatal survival: a call for action. Lancet 2005;365:1189–1197.
Chapter 3 / LBW and Neonatal Mortality
81
8. Andersson T, Högberg U, Bergström S. Community-based prevention of perinatal deaths: lessons from nineteenth century Sweden. Int J Epidemiol 2000;29:542–548. 9. Knippenberg R, Lawn JE, Darmstadt GL, Begkoyian G, Fogstad H, Walelign N, et al. Systematic scaling up of neonatal care in countries. Lancet 2005;365:1087–1098. 10. Sibley L, Ann ST. What can a meta-analysis tell us about traditional birth attendant training and pregnancy outcomes? Midwifery 2004;20:51–60. 11. De Brouwere V, Tonglet R, Van Lerberghe W. Strategies for reducing maternal mortality in developing countries: what can we learn from the history of the industrialized West? Trop Med Int Health 1998;3:771–782. 12. Bhutta ZA, Darmstadt GL, Hasan BS, Haws RA. Community-based interventions for improving perinatal and neonatal health outcomes in developing countries: a review of the evidence. Pediatrics 2005;115:519–617. 13. World Health Organization. Prevention of perinatal morbidity and mortality. Geneva: World Health Organization, 1970. WHO Technical Report Series No. 457. 14. Gardosi J, Mul T, Mongelli M, Fagan D. Analysis of birthweight and gestational age in antepartum stillbirths. Br J Obstet Gynaecol 1998;105:524–530. 15. Cnattingius S, Haglund B, Kramer MS. Differences in late fetal death rates in association with determinants of small for gestational age fetuses: population based cohort study. BMJ 1998;316:1483–1487. 16. Modanlou, HD, Dorchester WL, Thorosian A, Freeman RK. Macrosomia-maternal, fetal, and neonatal implications. Obstet Gynecol 1980;55:420–424. 17. Boyd, ME, Usher RH, Mclean FH. Fetal macrosomia: prediction, risks, proposed management. Obstet Gynecol 1983;61:715–722. 18. Govindasamy P, Stewart MK, Rutstein SO, Boerma JT, Sommerfelt AE. High-risk births and maternity care. Demographic and health survey. Calverton, MD: DHS, 1993. Comparative Studies No. 8. 19. Ferraz EM, Gray RH. A case-control study of stillbirths in northeast Brazil. Intl J Gynecol Obstet 1990;34:13–19. 20. Escoffery C, Greenwood R, Ashley D, Coard K, Keeling J, Golding J. Deaths associated with intrapartum asphyxia in Jamaica. Paediatr Perinat Epidemiol 1994;8(suppl 1):119–142. 21. Parker JD, Schoendorf KC, Kiely JL. Associations between measures of socioeconomic status and low birth weight, small for gestational age, and premature delivery in the United States. Ann Epidemiol 1994;4:271–278. 22. Perera T, Lwin KM. Perinatal mortality and morbidity including low birthweight: a South-east Asia regional profile. SEARO Regional Health Papers No. 3, 1984. 23. Victora CG, Barros FC, Vaughan PJ, Texeira AMB. Birthweight and infant mortality: a longitudinal study of 5914 Brazilian children. Intl J Epidimiol 1987;16(2):239–245. 24. Samms-Vaughan ME, McCaw-Binns AM, Ashley DC, Foster-Williams K. Neonatal mortality determinants in Jamaica. J Trop Pediatr 1990;36:171–175. 25. Gray RH, Ferraz EM, Amorim MS, De Melo LF. Levels and determinants of early neonatal mortality in natal northeastern Brazil: results of a surveillance and case-control study. Int J Epidemiol 1991;20: 467–473. 26. Kramer MS. Determinants of low birth weight: methodological assessment and meta-analysis. Bull World Health Organ 1987;65:663–737. 27. World Health Organization. Maternal anthropometry and pregnancy outcomes: WHO Collaborative Study. Bull World Health Organ 1995;73(suppl):1–98. 28. Williams RL, Creasy RK, Cunningham GC, Hawes WE, Norris FD, Tashiro M. Fetal growth and perinatal viability in California. Obstet Gynecol 1982;59:624–632. 29. Hogue CJR, Buehler JW, Strauss LT, Smith JC. Overview of the National Infant Mortality Surveillance (NIMS) project: design, methods, results. Public Health Rep 1987;102:126–138. 30. Villar J, Belizan JM. The relative contribution of prematurity and fetal growth retardation to low birth weight in developing and developed societies. Am J Obstet Gynecol 1982;143:793–798. 31. de Onis M, Habicht JP. Anthropometric reference data for international use: recommendations from a World Health Organization Expert Committee. Am J Clin Nutr 1996;64:650–658. 32. Blackmore CA, Savitz DA, Edwards LJ, Harlow SD, Bowes WA. Racial differences in the patterns of preterm delivery in central North Carolina, USA. Paediatr Perinat Epidemiol 1995;9:281–295.
82
Semba and Victora
33. Goldenberg RL, Cliver SP, Mulvihill FX, Hickey CA, Hoffman HJ, Klerman LV, Johnson MJ. Medical, psychosocial, and behavioral risk factors do not explain the increased risk for low birth weight among black women. Am J Obstet Gynecol 1996;175:1317–1324. 34. McCormick MC. The contribution of low birth weight to infant mortality and childhood morbidity. N Engl J Med 1985;312:82–90. 35. Committee to Study the Prevention of Low Birthweight, Division of Health Promotion and Disease Prevention, Institute of Medicine. Preventing low birthweight. Washington, DC: National Academy, 1985. 36. Dollfus C, Paletta M, Siegel E, Cross AW. Infant mortality: a practical approach to the analysis of the leading causes of death and risk factors. Pediatrics 1990;86:176–183. 37. Morrison JC. Preterm birth: a puzzle worth solving. Obstet Gynecol 1990;76(suppl):5S–12S. 38. Barker DJP. Fetal and infant origins of adult disease. London: BMJ, 1992. 39. Dubowitz LMS, Dubowitz V, Goldberg C. Clinical assessment of gestational age in the newborn infant. J Pediatr 1970;77:1–10. 40. Ballard JL, Novak KK, Driver M. A simplified score for assessment of fetal maturation of newly born infants. J Pediatr 1979;95:769–774. 41. Capurro H, Konichezky S. Fonseca D. Caldeyro-Barcia R. A simplified method for diagnosis of gestational age in the newborn infant. J Pediatr 1978;93:120–122. 42. Spinnato JA, Sibai BM, Shaver DC, Anderson GD. Inaccuracy of Dubowitz gestational age in low birth weight infants. Obstet Gynecol 1984;63:491–495. 43. Alexander GR, de Caunes F, Hulsey TC, Tompkins ME, Allen M. Validity of postnatal assessments of gestational age: comparison of the method of Ballard et al. and early ultrasonography. Am J Obstet Gynecol 1992;166:891–895. 44. Donovan EF, Tyson JE, Ehrenkranz RA, Verter J, Wright LL, Korones SB, et al. for the National Institute of Child Health and Human Development Neonatal Research Network. Inaccuracy of Ballard scores before 28 weeks’ gestation. J Pediatr 1999;135:147–152. 45. Balcazar H, Haas J. Classification schemes of small-for-gestational age and type of intrauterine growth retardation and its implications to early neonatal mortality. Early Hum Dev 1990;24:219–230. 46. Ashworth A. Effects of intrauterine growth retardation on mortality and morbidity in infants and young children. Eur J Clin Nutr 1998;52:S34–S42. 47. Barros FC, Hutly SRA, Victora CG, Kirkwood BR, Vaughan JP. Comparison of the causes and consequences of prematurity and intrauterine growth retardation: longitudinal study in southern Brazil. Pediatrics 1992;90:238–244. 48. United Nations International Children’s Emergency Fund (UNICEF). State of the World’s Children 2008. New York, UNICEF, 2007. 49. Subcommittee on Diet, Physical Activity, and Pregnancy Outcome, Food and Nutrition Board, US Institute of Medicine/National Academy of Sciences. Diet and activity during pregnancy and lactation. In: Nutrition issues in developing countries. Washington, DC: National Academy, 1992. 50. Ceesay SM, Prentice AM, Cole TJ, Foord F, Weaver LT, Poskitt EME, et al. Effects on birth weight and perinatal mortality of maternal dietary supplements in rural Gambia: 5 year randomised controlled trial. BMJ 1997;315:786–790. 51. Carmichael SL, Abrams B. A critical review of the relationship between gestational weight gain and pre-term delivery. Obstet Gynecol 1997;89:865–873. 52. Naeye RL. Maternal body weight and pregnancy outcome. Am J Clin Nutr 1990;52:273–279. 53. Little RE, Weinberg CR. Risk factors for antepartum and intrapartum stillbirth. Am J Epidemiol 1993;137:1177–1189. 54. Lucas A, Morley R, Cole TJ, et al. Maternal fatness and viability of preterm infants. BMJ 1988;296: 1495–1497. 55. Cnattingius, S, Bergstrom R, Lipworth L, Kramer MS. Prepregnancy weight and the risk of adverse pregnancy outcomes. N Engl J Med 1998;338:147–152. 56. Barros FC, Victora CG, Vaughan JP, Estanislasu HJ. Perinatal mortality in southern Brazil: a populationbased study of 7,392 births. Bull World Health Organ 1987;65:95–104. 57. Barros FC, Vaughan JP, Victora CG, Huttly SRA. An epidemic of caesarean sections in Brazil? The influence of tubal ligations and socioeconomic status. Lancet 1991;338:167–169.
Chapter 3 / LBW and Neonatal Mortality
83
58. World Health Organization. Obesity: preventing and managing the global epidemic. Geneva: World Health Organization, 1998. 59. Udall, JN, Harrison GG, Vaucher Y, Walson PD, Morrow GIII. Interaction of maternal and neonatal obesity. Pediatrics 1978;62:17–21. 60. Ounsted M, Scott A. Associations between maternal weight, height, weight-for-height, weight-gain and birth weight. In: Maternal nutrition in pregnancy: eating for two? Dobbing J, ed. London: Academic, 1981:113–129. 61. Wolfe HM, Zador IE, Gross TL, Martier SS, Sokol RJ. The clinical utility of maternal body mass index in pregnancy. Am J Obstet Gynecol 1991;164:1306–1310. 62. Kramer MS, Olivier M, McLean FH, Willis DM, Usher RH. The impact of intrauterine growth retardation and body proportionality on fetal and neonatal outcome. Pediatrics 1990;85:707–713. 63. Bang AT, Bang RA, Baitule SB, Reddy MH, Deshmukh MD. Effect of home-based neonatal care and management of sepsis on neonatal mortality: field trial in rural India. Lancet 1999;354:1955–1961. 64. Darmstadt GL, Bhutta ZA, Cousens S, Adam T, Walker N, de Bernis L, et al. Evidence-based, costeffective interventions: how many newborn babies can we save? Lancet 2005;365:977–988. 65. Hibbard BM. The role of folic acid in pregnancy. J Obstet Gynaecol Br Commonw 1964;71: 529–542. 66. Lumley J, Watson L, Watson M, Bower C. Periconceptual supplementation with folate and/or multivitamins for preventing neural tube defects. Cochrane Database Syst Rev 2000;(2):CD001056. 67. Vandelaer J, Birmingham M, Gasse F, Kurian M, Shaw C, Garnier S. Tetanus in developing countries: an update on the maternal and neonatal tetanus elimination initiative. Vaccine 2003;21: 3442–4335. 68. Demicheli V, Barale V, Rivetti A. Vaccines for women to prevent neonatal tetanus. Cochrane Database Syst Rev 2005;(4):CD002959. 69. Schmid G. Economic and programmatic aspects of congenital syphilis prevention. Bull World Health Organ 2004;82:402–409. 70. Peeling RW, Ye H. Diagnostic tools for preventing and managing maternal and congenital syphilis: an overview. Bull World Health Organ 2004;82:439–446. 71. Walter GJ. Antibiotics for syphilis diagnosed during pregnancy. Cochrane Database Syst Rev 2001;(3): CD001143. 72. Duley L, Meher S, Abalos E. Management of pre-eclampsia. BMJ 2006;332:463–468. 73. Atallah AN, Hofmeyr GJ, Duley L. Calcium supplementation during pregnancy for preventing hypertensive disorders and related problems. Cochrane Database Syst Rev 2000;(3):CD001059. 74. Whitty CJM, Edmonds S, Mutabingwa TK. Malaria in pregnancy. Br J Obstet Gynecol 2005;112: 1189–1195. 75. Garner P, Gulmezoglu AM. Drugs for preventing malaria-related illness in pregnant women and death in the newborn. Cochrane Database Syst Rev 2003;(1):CD000169. 76. Smaill F. Antibiotics for asymptomatic bacteriuria in pregnancy. Cochrane Database Syst Rev 2001;(2): CD000490. 77. Parry S, Strauss JF. Premature rupture of the fetal membranes. N Engl J Med 1998;338:663–670. 78. Kenyon S, Boulvain M, Neilson J. Antibiotics for preterm premature rupture of membranes. Cochrane Database Syst Rev 2001;(4):CD001058. 79. Crowley P. Prophylactic corticosteroids for preterm birth. Cochrane Database Syst Rev 1996;(1): CD000065. 80. Coco AS, Silverman SD. External cephalic version. Am Fam Physician 1998;58:731–738, 742–744. 81. Roberts CL, Cameron CA, Nassar N, Raynes-Greenow CH. A simple patient-initiated intervention to increase antenatal detection of breech presentation at term. Paediatr Perinat Epidemiol 2004;18:371–376. 82. Founds SA. Maternal posture for cephalic version of breech presentation: a review of the evidence. Birth 2005;32:137–144. 83. World Health Organization. World Health Organization partograph in management of labour. Lancet 1994;343:1399–1404. 84. World Health Organization. Managing complications in pregnancy and childbirth: a guide for midwives and doctors. IMPAC. Geneva: World Health Organization, 2003. WHO/RHR/00.7.
84
Semba and Victora
85. Niermeyer S, Kattwinkel J, van Reempts P, Nadkami V, Philips B, Zideman D, et al. International guidelines for neonatal resuscitation: an excerpt from the Guidelines 2000 for Cardiopulmonary Resuscitation and Emergency Cardiovascular Care: International Consensus on Science. Pediatrics 2000;106:e29. 86. Huffman SL, Zehner ER, Victora C. Can improvements in breast-feeding practices reduce neonatal mortality in developing countries. Midwifery 2001;17:80–92. 87. WHO Collaborative Study Team on the Role of Breastfeeding on the Prevention of Infant Mortality. Effect of breastfeeding on infant and child mortality due to infectious diseases in less developed countries: a pooled analysis. Lancet 2000;355:451–455. 88. World Health Organization. Thermal control of the newborn: a practical guide. Geneva: World Health Organization, 1993. 89. van den Bosch CA, Bullough CH. Effect of early suckling on term neonates’ core body temperature. Ann Trop Paediatr 1990;10:347–353. 90. Conde-Agudelo A, Diaz-Rossello JL, Belizan JM. Kangaroo mother care to reduce morbidity and mortality in low birthweight infants. Cochrane Database Syst Rev 2003;(2):CD002771. 91. Sazawal S, Black RE, for the Pneumonia Case Management Trials Group. Effect of pneumonia case management on mortality in neonates, infants, and preschool children: a meta-analysis of communitybased trials. Lancet Infect Dis 2003;3:547–556. 92. Kramer MS, Kakuma R. Energy and protein intake in pregnancy (review). Cochrane Database Syst Rev 2003;(4):CD000032. 93. Hankin ME, Symonds EM. Body weight, diet and pre-eclamptic toxaemia of pregnancy. Austr N Z J Obstet Gynenol 1962;4:156–160. 94. Hunt IF, Jacob M, Ostergard NJ, Masri G, Clark VA, Coulson AH. Effect of nutrition education on the nutritional status of low-income pregnant women of Mexican descent. Am J Clin Nutr 1976;29: 675–684. 95. Sweeney C, Smith H, Foster JC, Specht J, Kochenour NK, Prater BM. Effects of a nutrition intervention program during pregnancy: maternal data phases 1 and 2. J Nurse Midwifery 1985;30:149–158. 96. Kafatos AG, Vlachonikolis IG, Codrington CA. Nutrition during pregnancy: the effects of an educational intervention program in Greece. Am J Clin Nutr 1989;50:970–979. 97. Briley C, Flanagan NL, Lewis NM. In-home prenatal nutrition intervention increased dietary iron intakes and reduce low birthweight in low-income African American women. J Am Dietet Assoc 2002;102:984–987. 98. Ross SM, Nel E, Naeye RL. Differing effects of low and high bulk maternal dietary supplements during pregnancy. Early Hum Dev 1985;10:295–302. 99. Blackwell RQ, Chow BF, Chinn KSK, Balckwell BN, Hsu SC. Prospective maternal nutrition study in Taiwan: rationale, study design, feasibility and preliminary findings. Nutr Rep Int 1973;7: 517–532. 100. Mora JO, de Navarro L, Clement J, Wagner M, de Paredes B, Herrera MG. The effect of nutritional supplementation on calorie and protein intake of pregnant women. Nutr Rep Int 1978;17:217–228. 101. Rush D, Stein Z, Susser M. A randomized controlled trial of prenatal nutritional supplementation in New York City. Pediatrics 1980;65:683–697. 102. Elwood PC, Haley TJL, Hughes SJ, Sweetnam PM, Gray OP, Davies DP. Child growth (0–5 years), and the effect of entitlement to a milk supplement. Arch Dis Child 1981;56:831–835. 103. Viegas OAC, Scott PH, Cole TJ, Mansfield HN, Wharton P, Wharton BA. Dietary protein energy supplementation of pregnant Asian mothers at Sorrento, Birmingham. I. Unselective during second the third trimesters. BMJ 1982;285:589–592. 104. Viegas OAC, Scott PH, Cole TJ, Eaton P, Needham PG, Wharton BA. Dietary protein energy supplementation of pregnant Asian mothers at Sorrento, Birmingham. II. Selective during third trimester only. BMJ 1982;285:592–595. 105. Campbell Brown M. Protein energy supplements in primigravid women at risk of low birthweight. In: Nutrition in pregnancy. Proceedings of the Tenth Study Group of the RCOG. Campbell DM, Gillmer MDG, eds. London: RCOG, 1983:85–98. 106. Girija A, Geervani P, Rao GN. Influence of dietary supplementation during pregnancy on lactation performance. J Trop Pediatr 1984;30:79–83.
Chapter 3 / LBW and Neonatal Mortality
85
107. Ross SM, Nel E, Naeye RL. Differing effects of low and high bulk maternal dietary supplements during pregnancy. Early Hum Dev 1985;10:295–302. 108. Kardjati S, Kusin JA, de With C. Energy supplementation in the last trimester of pregnancy in East Java. I. Effect on birthweight. Br J Obstet Gynaecol 1988;95:783–794. 109. Atton C, Watney PJM. Selective supplementation in pregnancy: effect on birth weight. J Hum Nutr Dietet 1990;3:381–392. 110. Iyengar L. Effect of dietary supplements late in pregnancy on the expectant mother and her newborn. Indian J Med Res 1967;55:85–89. 111. Mardones-Santander F, Rosso P, Stekel A, Ahumada E, Llaguno S, Pizzaro F, et al. Effect of a milkbased food supplement on maternal nutritional status and fetal growth in underweight Chilean women. Am J Clin Nutr 1988;47:413–419. 112. Campbell DM, MacGillivray I. The effect of a low calorie diet or a thiazide diuretic on the incidence of pre-eclampsia and on birthweight. Br J Obstet Gynaecol 1975;82:572–577. 113. Campbell DM. Dietary restriction in obesity and its effect on neonatal outcome. In: Nutrition in pregnancy. Proceedings of the Tenth Study Group of the RCOG. Campbell DM, Gillmer MDG, eds. London: RCOG, 1983:243–250. 114. Badrawi H, Hassanein MK, Badroui MHH, Wafa YA, Shawky HA, Badrawi N. Pregnancy outcome in obese pregnant mothers. New Egypt J Med 1993;6:1717–1726. 115. Gallego EB, ed. Severe anemia in pregnancy. Report of a workshop held at the Institute of Child and Mother Health in Dhaka, Bangladesh. Ottawa: International Development Research Centre, 2000. 116. Mahomed K. Iron supplementation in pregnancy. Cochrane Database Syst Rev 2000;(2):CD000117. 117. Agarwal K, Agawal D, Mishra KP. Impact of anaemia prophylaxis in pregnancy on maternal haemoglobin, serum ferritin and birth weight. Indian J Med Res 1991;94:277–280. 118. Suharno D, West KJ, Muhilal C, Karyadi D, Hautvast J. Supplementation with vitamin A and iron for nutritional anaemia in pregnant women in West Java, Indonesia. Lancet 1993;342:1325–1328. 119. Menendez C, Todd J, Alonso P, Francis N, Lulat S, Ceesary S, et al. The effects of iron supplementation during pregnancy, given by traditional birth attendants, on the prevalence of anaemia and malaria. Trans R Soc Trop Med Hyg 1994;88:590–593. 120. Atukorala S, de Silva L, Dechering W, Dassanaeike T, Perera R. Evaluation of effectiveness of ironfolate supplementation and antihelminthic therapy against anemia in pregnancy—a study in the plantation sector of Sri Lanka. Am J Clin Nutr 1994;60:286–282. 121. Preziosi P, Prual A, Galan P, Daouda H, Boureima H, Hercberg S. Effect of iron supplementation on the iron status of pregnant women: consequences for newborns. Am J Clin Nutr 1997;66:1178–1182. 122. Pharaoh P, Buttfield I, Hetzel B. Neurological damage to the fetus resulting from severe iodine deficiency during pregnancy. Lancet 1971;1:308–310. 123. Pharoah P, Connolly K. Effects of maternal iodine supplementation during pregnancy. Arch Dis Child 1991;66:145–147. 124. Thilly C, Delange F, Lagasse R, Bourdoux P, Ramioul L, Berquist H, et al. Fetal hypothyroidism and maternal thyroid stratus in severe endemic goiter. J Clin Endocrinol Metab 1978;47:354–360. 125. De Long GR, Leslie PW, Wang SH, Jiang XM, Zhang ML, Rakeman M, et al. Effect on infant mortality of iodination of irrigation water in a severely iodine-deficient area of China. Lancet 1997;350: 771–773. 126. Fawzi WW, Msamanga GI, Spiegelman D, Urassa EJ, McGrath N, Mwakagile D, et al. Randomised trial of effects of vitamin supplements on pregnancy outcomes and T cell counts in HIV-infected women in Tanzania. Lancet 1998;351:1477–1482. 127. Coutsoudis A, Pillay K, Spooner E, Kuhn L, Coovadia HM. Randomized trial testing the effect of vitamin A supplementation on pregnancy outcomes and early mother-to-child HIV-1 transmission in Durban, South Africa. AIDS 1999;13:1517–1524. 128. Kumwenda N, Miotti PG, Taha TE, Broadhead R, Biggar RJ, Jackson JB, et al. Antenatal vitamin A supplementation increases birth weight and decreases anemia among infants born to human immunodeficiency virus-infected women in Malawi. Clin Infect Dis 2002;35:618–624. 129. Katz J, West KP Jr, Khatry SK, Pradhan EK, LeClerq SC, Christian P, et al. Maternal low-dose vitamin A or β-carotene supplementation has no effect on fetal loss and early infant mortality: a randomized cluster trial in Nepal. Am J Clin Nutr 2000;71:1570–1576.
86
Semba and Victora
130. Siems W, Wiswedel I, Salerno C, Crifo C, Augustin W, Schild L, et al. β-Carotene breakdown products may impair mitochondrial functions—potential side effects of high-dose β-carotene supplementation. J Nutr Biochem 2005;16:385–397. 131. McGill CR, Green NR, Gropper SS. β-Carotene supplementation decreases leukocyte superoxide dismutase activity and serum glutathione peroxidase concentration in humans. J Nutr Biochem 2003;14:656–662. 132. Palozza P, Serini S, DiNicuolo F, Piccioni E, Calviello G. Prooxidant effects of β-carotene in cultured cells. Mol Aspects Med 2003;24:353–362. 133. King J. Determinants of maternal zinc status during pregnancy. Am J Clin Nutr 2000;71 (suppl 5);1334S–1343S. 134. Keen C, Clegg M, Hanna L, et al. The plausibility of micronutrient deficiencies being a significant contributing factor to the occurrence of pregnancy complications. J Nutr 2003;133:1597S–1605S. 135. Mahomed K. Zinc supplementation in pregnancy. Cochrane Database Syst Rev 2000:CD000230. 136. Christian P, Shrestha I, LeClerq S, et al. Supplementation with micronutrients in addition to iron and folic acid does not further improve the hematologic status of pregnant women in rural Nepal. J Nutr 2003;133:3492–3498. 137. Christian P, Khatry S, Katz J, et al. Effects of alternative maternal micronutrient supplementations on low birth weight in rural Nepal: double blind randomised community trial. BMJ 2003;326:571. 138. Christian P, West KP, Khatry S, et al. Effects of maternal micronutrient supplementation on fetal loss and infant mortality: a cluster-randomized trial in Nepal. Am J Clin Nutr 2003;78:1194–1202. 139. Haas JD, Murdoch S, Rivera J, Martorell R. Early nutrition and later physical work capacity. Nutr Rev 1996;54(2 pt 2):S41–S48. 140. Martorell R, Ramakrishnan U, Schroeder DG, Ruel M. Reproductive performance and nutrition during childhood. Nutr Rev 1996;54(4 pt 2):S15–S21. 141. Subcommittee on Nutritional Status and Weight Gain During Pregnancy, Food and Nutrition Board, US Institute of Medicine/National Academy of Sciences. Nutrition during pregnancy. Washington, DC: National Academy, 1990. 142. Galuska DA, Serdula M, Pamuk E, Siegel PZ, Byers T. Trends in overweight among US adults from 1987 to 1993. Am J Public Health 1996;86:1729–1735. 143. Kuczmarski RJ, Flegal KM, Campbell SM, Johnson CL. Increasing prevalence of overweight among US adults. JAMA 1994;272:205–211. 144. Victora CG, Hanson K, Bryce J, Vaughan JP. Achieving universal coverage with health interventions. Lancet 2004:364:1541–1548.
4
Infant Mortality Parul Christian
4.1
INTRODUCTION
Each year, more than 10 million children under 5 years of age die, with almost 4 million within the first 4 weeks of life [1, 2]. The most recent estimate of the number of infant deaths (deaths under the age of 1 year) is 7.2 million in the developing world compared with about 54,000 who die in the industrialized world [3] (Table 4.1). Thus, a vast majority of child deaths occur in infancy and in developing countries, predominantly those in South Asia and sub-Saharan Africa. It is estimated that six countries account for 50% of the worldwide deaths in children under 5 years and 42 countries for 90% [1]. The same countries are likely to harbor the highest risk of infant mortality rates (IMRs). One of the eight United Nations Millennium Development Goals (MDGs) is to reduce mortality by two thirds among children under 5 years by 2015 using a 1990 baseline. It is now halfway to this deadline, with less than a decade remaining to achieve this goal. Child and neonatal survival are placed at high priority for action by the global health community, including governments, international organizations, scientists, and programmers. In 2003, the Bellagio Study Group on Child Survival put out a five-article series in the Lancet [1, 4–7] that was a call to action for all segments of the public health community to bring to the forefront the continuing high rates and unacceptable disparities of child mortality in the world. This was followed in 2005 by a series [8–11] by the Neonatal Survival Steering Committee that focused attention on the neonate and the burden of morbidity and mortality in this short period of human life after birth. The child survival group identified four prerequisites for transforming knowledge into action to reduce child mortality: leadership; strong health systems; adequate and targeted resources; awareness and commitment to action [7]. Apart from a strong political will and commitment, it is estimated that an additional US $52.4 billion will be needed to scale up child health interventions to attain full coverage of these in 75 countries with the highest mortality rates [12]. An alternate cost estimate is that of US $5.1 billion required to save the lives of 6 million children who die of preventable and treatable causes in 42 countries in which 90% of child deaths occur [13]. Along these lines, a strong case for a global fund for maternal, neonatal, and child survival was made [14] to coalesce global effort toward preventing maternal and child deaths and for reducing health inequities that persist in the 21st century. This chapter provides an overview of From: Nutrition and Health: Nutrition and Health in Developing Countries, Second Edition Edited by: R. D. Semba & M. W. Bloem © Humana Press, Totowa, NJ
87
88
Christian
Table 4.1 Infant mortality rates and number of infant deaths by United Nations International Children’s Emergency Fund (UNICEF) region Infant mortality rate Number of deaths Region (per 1,000 births) (millions) Sub-Saharan Africa 104 2.80 Middle East and North Africa 45 0.44 South Asia 67 2.48 East Asia and Pacific 31 0.98 Latin America and Caribbean 27 0.31 CEE/CIS 34 0.18 Industrialized countries 5 0.05 Developing countries 60 7.20 Least-developed countries 98 2.73 Source: From [3]. CEE/CIS Central Eastern Europe/Central Independent States
the trends, causes, and risk factors of infant mortality and current evidence on effective interventions for reducing its burden in the developing world.
4.2 4.2.1
GLOBAL TRENDS Historical Trends: United States
The dramatic declines in mortality rates, including those in infant mortality, that were achieved in the United States during the late 19th and early 20th centuries had never been recorded in any other period in history. Nearly all the mortality decline was related to those in infectious diseases [15]. While much debate exists regarding the major causes of these improvements, three explanations have been put forth: (1) economic advances and improvement in nutrition; (2) behavior change due to health behavior campaigns leading to improved hygiene; and (3) large-scale public health innovations, including clean water technologies, sanitation, refuse management, milk pasteurization, and meat inspection [16]. Recent analyses suggested that clean water technologies (filtration and chlorination) were associated with nearly halving total mortality and reductions in three quarters of infant and two thirds of child mortality in major US cities [15]. Currently, worldwide, 1.1 billion people lack access to clean water, and 2.4 billion do not have adequate sanitation (http://www.wsp.org). MDG-7 aims to reduce by half the proportion of individuals without access to safe drinking water by 2015.
4.2.2
Decline in Infant Mortality in Developing Countries
Global trends suggest that infant mortality is declining [17, 18] in many regions of the developing world, although as indicated in Table 4.2, the rates in many African nations may have reached a plateau. Even in South Asia, the decline appears to have slowed. South Asia contributes to the highest number of child deaths, while sub-Saharan Africa has the highest mortality rates. The declines in IMR are largely attributable to those in postneonatal mortality, with neonatal mortality rates having remained unchanged over the past decade [8]. The high coverage rates achieved by the expanded programs on
Chapter 4 / Infant Mortality
Table 4.2 Infant mortality rates over the past 40 years by region Last update: May 2004 Infant mortality rate Regional summaries 1960 1970 1980 1990 1995 Northern Africa 167 142 104 66 50 Sub-Saharan Africa 163 141 117 109 109 Latin America 102 86 61 43 35 Eastern Asia 147 83 48 37 36 South Asia 149 130 114 87 77 Southeastern Asia 111 87 68 54 45 Western Asia 152 128 83 53 55 Oceania 132 97 72 63 61 Developed regions 36 23 14 10 8 EURASIA 51 32 38 34 35 (countries in CIS) Developing regions 142 109 88 71 67 World 127 96 79 64 61
89
2000 38 104 30 32 70 38 50 59 6 35
2002 34 104 28 30 67 36 49 59 6 35
62 57
61 55
Source: United Nations International Children’s Emergency Fund (UNICEF) monitoring the situation of women and children, http://www.childinfo.org/cmr/revis/db1.htm, accessed February 19, 2006. CIS Central Independent States
immunization and national programs for the control of diarrheal diseases were mainly responsible for the rapid gains in child survival of the 1980s [19–21]. Among five categories of explanatory factors for infant mortality, improvements in the use of health services, environmental conditions, and socioeconomic status (SES) may be more likely to be associated with the declining trends in IMR during the 1990s; fertility behavior and breast-feeding and infant feeding may have played only a small role [22]. The reversal in mortality decline from the 1960s during the 1990s in Africa has long been a cause of much concern and perhaps, but not fully, attributable to the HIV/AIDS epidemic and mother-to-child transmission (MTCT) [23]. A pooled analysis shows that IMR among HIV-infected infants in Africa was 35.2% compared with 4.9% among uninfected ones [24]. By the second year of life, more than half the infected children die, compared to only 7.6% uninfected children. The regional variation between South Asia and sub-Saharan Africa may also in part be explained by malaria, which contributes to 20% of child deaths in Africa [1, 17, 25]. A note of caution regarding the adequacy of sample sizes, derived mostly from Demographic Health Survey (DHS) data for examining increasing (or decreasing) trends, should be made; of all surveys conducted between 1986 and 2002 in Africa, only half of the trends observed in mortality reduction achieved statistical significance [26]. Global inequity in child health and survival is wide, and both geographic differences between rich and poor countries and within country/region inequities between the rich and the poor need urgent attention [6]. Compared to a rate of 6 per 1,000 in affluent countries, 61 per 1,000 live-born infants die in the first year of life. The declines in mortality are also lower in developing countries relative to the richer ones, making the gap wider. A stark example of this is provided in the difference between the IMR in Afghanistan and that in Japan, with the latter having the lowest rate in the world (Fig. 4.1).
90
Christian 275 250
Japan
Afghanistan
IMR per 1000 births
225 200 175 150 125 100 75 50 25 0 1960
1970
1980
1990
1995
2000
2002
Year
Fig. 4.1. Infant mortality trends in Afghanistan and Japan over the past 40 years.
Preventive Interventions -Vaccines -Vitamin A -Bednets -Zinc
Exposures Resistance to disease
- Inadequate water and sanitation - Crowding -Disease vector
Sickness
Health care seeking, provision and quality
Mortality
Undernutrition -PEM -Micronutrient deficiency -Low birth weight
Fig. 4.2. This figure illustrates that poorer children are more likely to be exposed to infectious pathogens due to inadequate sanitation and clean water supply, crowding, and higher exposure to disease vectors. This will result in an increased susceptibility to disease exacerbated by undernutrition and increased sickness due to lack of access to preventive interventions. After becoming sick, lower quality of health care can cause increased mortality. (Adapted from [6].) PEM: Protein energy malnutrition
The same situation exists within countries with high levels of inequality between the poorest and richest segments of the population. The causal pathway shown in Fig. 4.2 examines why poor children tend to die at a much higher rate than their richer counterparts [6]. Another differential in infant mortality is seasonal variation observed in many regions of the world. This seasonality may be related to numerous factors, including rainfall; extreme temperatures; harvest and hungry seasons; diseases such as malaria, measles, diarrhea, acute lower respiratory infections, and other infections; and low birth weight [27–36].
Chapter 4 / Infant Mortality
4.3
91
DETERMINANTS OF INFANT MORTALITY
An analytic framework for studying the determinants of child survival proposed by Mosley and Chen [37] and recently examined for its cogency to modern times by Hill [38] defines five categories of proximate determinants: maternal factors (age, parity, birth interval); environmental contamination (air, food/water/fingers, skin/soil, inanimate objects, insect vectors); nutrient deficiencies (calories, protein, micronutrients); injury (accidental/intentional); and personal illness control (personal prevention measures, medical treatment). Distal determinants as developed by the United Nations International Children’s Emergency Fund (UNICEF) for undernutrition, including human, economic, and organizational resources and the political and ideological system, could also be added to such an analytic framework [39].
4.3.1
Macrofactors: Socio-Politico-Economic Dimensions
Both modernization (economic, social, and political) and dependency theories, although seemingly opposing, may influence infant mortality [40]. The former may explain intranational and the latter international variation in IMRs, although an interaction of the two may provide a more holistic explanation [40]. The economic modernization theory stresses economic growth as the driving force behind development within countries. Economic growth is tied to increases in industrialization and urbanization and thereby
Fig. 4.3. Declines in infant mortality rate with increasing levels of girls’ education. (From [44]).
92
Christian
increased standards of living and access to medical care, which may lead to decline in mortality. A social modernization perspective stresses the role of education as an intranational factor in the development process. The often-quoted example of Kerala State in India, where high levels of education among women, among other social factors, has been linked to IMR, is more comparable to that in the developed world [41–43]. Using ecologic data, Fig. 4.3 illustrates the impact of girls’ education on infant mortality [44]. Increases in education may lead to increased viability in the labor market, resulting in economic growth [45]. However, decreases in IMR may also be linked to fertility reductions and birth spacing [46], both of which are associated with maternal education. Last, better-educated mothers will be more knowledgeable about health and nutrition, which is likely to result in better infant health and survival. It has long been demonstrated that maternal education induces behavioral changes, which in turn may have an impact on better feeding and child care practices and health service utilization, which in turn may have an impact on child health [47]. Less understood and perhaps examined is the role of education in enhancing maternal self-esteem and status, resulting in higher degrees of control and decision-making power. Women with increased decision-making abilities are known to prioritize expenditures on health and nutrition of their children [48, 49]. Last, the political modernization perspective posits that political democracies that are more responsive to public opinion, interests, and social movements are more likely to promote health-related issues such as infant mortality [40]. Lack of democracy and repressive governments, on the other hand, are less likely to be responsive. Some studies have also shown that increased government spending is associated with lower infant mortality [50]. In contrast to the modernization theory, according to dependency theory the capitalist nations create a global division of labor and trade dependence that destabilizes the economies of developing countries, leading to decreased economic growth and increased income inequality, in turn leading to the poor well-being of the population [40]. A decrease in the state’s ability to generate revenue depresses its ability to support funding of health and social service programs. Furthermore, many developing countries are caught in a debt crisis, which may directly affect government spending on programs to reduce infant mortality. There is also evidence to suggest that multinational corporations may foster increased infant mortality [40]. An analysis of 59 developing countries found that intranational political factors interact with international economic forces to have an impact on infant mortality; both multinational corporations and international lending institutions (International Monetary Fund, World Bank) may adversely affect infant mortality [40].
4.3.2
Gender
Gender inequality is a factor of global importance in trying to combat infant mortality. Female newborns are at a higher biologic advantage for survival compared to males. In later infancy, behavioral factors and male gender preference result in the reversal of this advantage. In rural Nepal, the adjusted odds ratio for male mortality (relative to female) was 1.39 in the first week of life, 1.22 in the 8- to 28-day period, and 0.73 at 4–24 weeks of life [51]. Indeed, according to modernization theory, economic development affects child mortality, but there may be a gender differential in this impact. At low levels of development, even strong gender bias against females is offset by
Chapter 4 / Infant Mortality
93
greater susceptibility to disease and poor nutritional conditions. In contrast to this, in more developed settings, with adequate means to ensure health, male and female risks are equalized. It is at the intermediate levels of development that boy children benefit preferentially from public health measures as a result of cultural biases against female infants [52–54]. Also, total fertility rates show a strong negative relationship with maleto-female IMR, with low total fertility rate associated with higher female survival due to a higher value placed in female children [54]. In Bangladesh, mortality of sons but not daughters was associated with a decrease in both initiation and continuation of contraceptive use [55]. Another finding is related to the impact of gainful employment of females positively influencing female infants due to improved women’s status in general [54]. Another differential important to consider is derived from the theory of evolutionary psychology, which proposes that heterogeneous communities with competing racial/ ethnic/linguistic groups can override other structural variables, such as gender, resulting in lower female discrimination [54]. A growing concern, however, is the continuing high rate of female infanticide related to strong preference for males in countries such as India and China, which have highly heterogeneous populations. Many reports of “missing girls” due to selective abortions and female infanticide in India are available in the literature. As recently as 1998, using data from the Special Fertility and Mortality Survey, of about 1.3 million births studied, the adjusted sex ratio for the second and third birth when the preceding child was a girl was 759 and 719 per 1,000 males [56]. In contrast, these ratios were about equal (1,102:1,176) if the previous children were boys. This analysis estimated that selective abortion of female fetuses may account for 0.5 million missing female births yearly, with approximately 10 million abortions having occurred in the past two decades.
4.3.3
Household Socioeconomic Factors
The SES factors that have been associated with infant mortality include maternal (and paternal) education, household assets, occupation, rural versus urban residence, race/ethnicity, and access and quality of health care and safe water and sanitation. The role of women’s education was discussed in the preceding section. Maternal education in many settings has been shown to be associated with a reduction in neonatal and infant mortality [51, 57–62]. Others have found this association to disappear when other explanatory factors, such as income and health services, have been adjusted for in multivariate models [63]. In Norway, using the medical birth registry during 1967 to 1998, data were analyzed to examine maternal education and the risk of infant death [64]. Risk difference for neonatal mortality between high and low maternal education was found to be reduced from 3.5/1,000 in the 1970s to 0.9/1,000 in the 1990s. Conversely, for postneonatal mortality, the risk difference increased from 0.7/1,000 to 2.0/1,000 during this time. The authors inferred that, for neonatal mortality, the influence of socioeconomic factors may have declined, and obstetric and neonatal care services were more likely to play a role. Postneonatal mortality, on the other hand, may be more closely associated with SES. These data are important for the implementation of public health interventions targeted to different periods of risk. Also, note that covariates of infant mortality may be variable and setting-specific and may change over time.
94
Christian
Lower infant mortality has also been linked to household ownership/use of toilets, piped water, and sanitation [65–69]. Distance from the nearest health center and quality of health care services have also been associated with infant mortality [62, 70, 71]. Access to health care can be reduced by removing user fees. A simulation model based on evidence for the impact of key interventions on child mortality calculated that approximately 233,000 deaths of children under 5 years could be prevented annually by abolition of user fees with alternative financing strategies in 20 African countries [72].
4.3.4
Maternal Age, Parity, and Birth Spacing
Maternal age has been documented to have an inverse J-shaped relationship with infant mortality; both young and older mothers have an increased risk of infant deaths [73–75]. Because teenage pregnancy may be associated with low SES and other risk factors, adjusting for confounders may lead to an attenuated risk associated with maternal age per se. For example, after adjusting for race, marital status, parity, education, smoking, prenatal care utilization, and poverty status, the risk of postneonatal but not neonatal mortality was significantly associated with younger adolescent age (12–17 years) but not with older adolescents (age 18–19 years) in the United States [76]. First birth, especially at young age, is associated with an increased risk of infant morality. Conversely, high parity may also be a predictor of increased risk, perhaps due to maternal depletion in malnourished settings. Thus, the relationship between parity and infant mortality is also J-shaped, with nulliparity and increasing parity associated with an increased risk of infant mortality [51, 77–83]. Twinning compared to singleton births also increases the risk of infant mortality [84, 85]. Perinatal, neonatal, and 24-week mortality was six to eight times higher among twins than singleton births in rural Nepal [86]. Birth spacing is well recognized as a major risk factor for neonatal and infant mortality. Numerous demographic health survey analyses have demonstrated the benefits of a longer birth interval [71, 87–93]. For neonatal and infant mortality, using data collected between 1990 and 1997 from 17 developing countries, the risk of dying decreased with increasing birth interval up to 3 years, after which the slope plateaued, unlike with child mortality, for which the lower risk persisted even for an interval of 4 years or more [92]. Adjusted analysis, again using DHS data, indicated neonatal mortality to be reduced by 40% for preceding birth interval of 3 years or more compared with an interval of less than 2 years [94]. Several biologic and sociobehavioral pathways exist to explain the association of increased mortality with short birth interval. One such posited mechanism is related to the maternal depletion syndrome, although evidence for this may be limited. A second mechanism may be related to increased transmission of infectious disease, although total number of children may be a stronger predictor for this [87]. A third pathway through which birth interval may have an impact on mortality could be related to competition for scarce resources; the risk of mortality associated with a short interval was lower if the previous sibling had died [91, 95–96]. Alternately, a short subsequent interval may also increase the risk of mortality of an index child, again due to resources being diverted to a younger sibling [87, 88, 97–100].
4.3.5
Maternal Nutrition and Infant Mortality
Prepregnancy weight, height, and weight gain during pregnancy are associated with fetal growth and preterm and birth weight. These outcomes and their influence on perinatal and infant mortality were examined in Chapter 3. As mentioned in Chapter 3,
Chapter 4 / Infant Mortality
Table 4.3 Risk of 6-month infant mortality by low birth weight and its causes Mortality Causes n % n Preterm only 222 17.3 24 Small for gestational age only 895 69.8 40 Both preterm and small for gestational age 165 12.9 25
95
% 10.8 4.5 15.2
Preterm gestational age < 37 weeks, small for gestational age birth weight below tenth centile of US national reference for fetal growth [105]
antenatal food supplementation has been found to improve birth weight and fetal growth in malnourished settings. A study in the Gambia clearly demonstrated that maternal supplementation during pregnancy with a daily high-calorie and protein food supplement would lead to a reduced incidence of low birth weight and perinatal mortality [101]. An antenatal supplementation trial conducted in rural Nepal demonstrated that folic acid with or without iron or zinc significantly reduced the risk of infant mortality among preterm infants [102]. Reduction in maternal anemia and low birth weight incidence may explain in part the beneficial impact on infant mortality. On the other hand, antenatal vitamin A supplementation has not been found to have an impact on either fetal loss or infant mortality [103], although among vitamin A-deficient night-blind women, infant mortality was significantly higher, and providing weekly vitamin A during pregnancy reduced infant mortality up to 3 months [104]. In the same study in Nepal, low birth weight only due to preterm occurred in just 17% of births, as compared with low birth weight due to an infant small for gestational age (70% of births) (P. Christian, unpublished data; Table 4.3). However, the 6-month IMR was double in the group whose low birth weight was due to preterm birth and threefold when both preterm and small-for-gestational-age infants were present, suggesting that the risk of mortality associated with preterm birth may be higher than that associated with fetal growth retardation despite the higher rates of small-for-gestational age infants in many developing countries. The mortality rate among full-term infants born greater than 2.5 kg was 2.7%. In Nepal, where the hookworm is highly endemic, geohelminth infestation may be strongly associated with the etiology of maternal anemia during pregnancy [106]. In such a setting, deworming twice during pregnancy in the second and third trimesters was associated with a significant reduction in severe anemia during pregnancy and improved birth weight and infant survival [107], suggesting that in endemic areas where prevalence of anemia is high, antenatal anthelmintic treatment along with antenatal iron-folate supplementation should be routinely provided as per the international guidelines [108].
4.3.6
Breast-feeding
Breast-feeding has long been known to provide protection against infections and infectious mortality. The current World Health Organization (WHO)/UNICEF recommendation is to breast-feed exclusively for the first 6 months of life and beyond 6 months to continue breast-feeding while providing safe complementary foods into the first 2 years of life or more. The antimicrobial, anti-inflammatory,
96
Christian
and immunomodulatory properties of breast milk [109, 110] combined with its nutritional composition that is best suited to an infant’s needs during the early period of postnatal growth and development of the immature gut and the immune system make breast milk the ideal source of nutrition for an infant. These properties of human milk afford a survival benefit to the infant. A three-country (Brazil, Pakistan, Philippines) pooled analysis provided an estimate of the magnitude of survival benefit afforded by breast-feeding by age in the first 12 months of life [111]. Breast-feeding was associated with improved survival for both boys (odds ratio [OR] = 3.5, 95% confidence interval [CI] 2.4–5.0) and girls (OR = 4.1, 95% CI 2.8–6.1) in the first 6 months of life, with the protective effect declining in the second 6-month period in both boys (OR = 1.8, 95% CI 1.1–3.0) and girls (OR = 2.9, 95% CI 1.6–5.2). In the first 6 months, protection against diarrheal disease mortality was higher (combined sex OR = 6.1, 95% CI 4.1–9.0) compared with that against acute lower respiratory infection (OR = 2.4, 95% CI 1.6–3.5). This difference between infectious causes of mortality disappeared in the second 6 months of life. Using secondary data from a multicenter randomized trial on immunization-linked vitamin A supplementation in Ghana, India, and Peru, non-breast-fed and partially breast-fed infants had a 10-fold and 2.5-fold increased risk, respectively, of dying compared to predominantly breast-fed infants [112]. Breast-feeding may also be protective for neonatal sepsis, hypothermia, and hypoglycemia [113, 114]. Reasons for terminating breast-feeding may also influence subsequent risk of mortality in children. In Guinea-Bissau, compared with weaning among healthy mothers and children, illness in either the child or mother or the onset of a new pregnancy as a reason for termination of breast-feeding was associated with a three or four times higher risk of infant/child mortality [115]. Even in countries with high HIV-1 prevalence, exclusive breast-feeding for the first 6 months of life is recommended in the absence of affordable, feasible, acceptable, sustainable, and safe replacement feeding [116]. Following 6 months, weaning to replacement feeding with complete cessation of breast-feeding is recommended, although the conditions under which replacement feeding is to be done remain the same. Simulation models predicting HIV-free survival of infants of HIV-1-positive mothers showed that breast-feeding is safer than replacement feeding between 7 days and 4 months of age. For the interval between 4 and 6 months, replacement feeding is similar to breastfeeding, and after 6 months replacement feeding is substantially safer than breast-feeding for infant HIV-free survival [117]. Using current data on risks of postnatal HIV transmission from mixed and exclusive breast-feeding, another simulation aims to inform policies regarding infant feeding practices among HIV-1-infected women [118]. This simulation demonstrated that, in low infant mortality settings (IMR < 25/1,000), replacement feeding resulted in the highest HIV-free survival rates in the first 2 years of life. Conversely, in settings with higher IMR (25–100/1,000), exclusive breast-feeding up to 6 months and early breast-feeding cessation at 6 months produced the best survival, both relative to “no intervention,” by which “usual” infant feeding involving early, predominant, and mixed breast-feeding continued for up to 2 years is practiced. In countries with IMR above 100/1,000, replacement feeding produced the best HIV-free survival. Such countries include Zambia, Tanzania, Ethiopia, Malawi, Rwanda, Cote de’Ivoire, Mali, Democratic Republic of the Congo, Angola, and Mozambique.
Chapter 4 / Infant Mortality
4.4
97
DIRECT AND UNDERLYING CAUSES OF INFANT MORTALITY
Despite the lack of adequate vital registration and autopsy data among infants, several estimates based on models using nationally representative surveys and special studies using parental verbal autopsies are available to establish causes of infant deaths. The current WHO estimates of major causes of death in children under 5 years [2] can be intrapolated for causes of deaths among infants. Worldwide, 73% of deaths in children in this age category can be attributed to the following causes: pneumonia (19%), diarrhea (17%), malaria (8%), neonatal causes (37%), AIDS/HIV (3%), measles (4%), injuries (3%), and others (10%). Causes of neonatal mortality are discussed in the next section. Another estimate based on a 42-country prediction model showed slightly different estimates, attributing 52.6% of deaths to neonatal causes, 14.1% to diarrhea, 8.2% to respiratory infections, 0.3% to AIDS, and 24.7% to other causes [1, 119]. The proportions of deaths caused by malaria and HIV/AIDS are much higher in Africa, although these proportions vary by existence of either or both these infections. MTCT is one of the primary causes of infection in the fetus, newborn, and breastfeeding infant. Infants in many African countries where malaria (predominantly caused by Plasmodium falciparum) is endemic are at a high risk of infection, severe anemia, and mortality [27, 120–124]. An analysis for the year 2000 from studies in 18 countries in middle and southern Africa estimated that, of 100 million children under 5 years old living in areas where malaria transmission occurs, about 804,000 died from the direct effects of malaria, suggesting that the mortality burden associated with this infection is high [125]. Malarial infection through maternal transmission at birth or in utero may also increase the risk of neonatal death. In Tanzania, cord parasitemia was associated with an almost ninefold risk of neonatal death [121]. Maternal malarial infection is associated with low birth weight and increased risk of infant mortality. Assuming that 25% of pregnant women in malaria-endemic areas in Africa have placental malaria, it is estimated that 5.7% of infant deaths could result from an indirect cause of malaria in pregnancy [126]. Mortality in infants in Burkina Faso has been shown to peak after the rainy season, primarily due to increase in malaria infections during this time period [27]. In Tanzania, a treated bed net project that involved both the public and private sectors led to a successful implementation of increased usage from 10% to 50% and a record 27% reduction in mortality in children 1 month to 4 years of age over the course of 3 years [127]. In Kenya, in a randomized community-based trial, adherence and usage of treated bed nets increased significantly in intervention versus control villages, and infant mortality was reduced by 22% [128]. Among 48 demographic surveillance studies, P. falciparum malaria was associated with a twofold increase in the risk of all-cause mortality in those under 5 years old, suggesting that malaria may explain a higher burden of childhood mortality in Africa [120]. While this pattern of mortality cause structure in sub-Saharan Africa has an impact on the proportion of causes related to neonatal deaths and therefore infant deaths, it does not have an impact on the contribution of diarrheal deaths or those due to pneumonia in older children [1]. When considering causes of infant mortality, both neonatal and postneonatal, one needs to consider (1) overlap or multiplicity of causes and (2) the role of undernutrition as an underlying cause for much of the infant mortality in low-income countries. For example, comorbidity of pneumonia and diarrhea is high, suggesting shared risk factors and exacerbation of risk due to coexistence of multiple morbidities (Fig. 4.4) [1, 129]. Often, measles is
98
Christian
Fig. 4.4. Overlap between deaths attributed to diarrhea and pneumonia [1].
20-42%
15-44%
Diarrhea
Pneumonia
4-16%
80 Africa
Population attributable fraction (%)
71.1
Southeast Asia
The Americas
World
70 64.8
66.4
64.7
63.4 60.7
60
57.7
56.1
54.6
52.5
57.3
53.8
52.3
50 45.2
44.8
38.1
40
33.7
32.4
31.2
30 24.3
20 10 0 All causes
Diarrhea
Pnemonia
Measles
Malaria
Cause of death
Fig. 4.5. Population attributable fraction for undernutrition of child deaths by cause in three high mortality WHO regions and the world. (Adapted from Ref. 133.)
also complicated by pneumonia and diarrhea [1]. Even with causes of neonatal mortality, a considerable overlap among sepsis, preterm delivery, and birth asphyxia has been observed using a neonatal verbal autopsy method in a rural setting in Nepal [130]. The work by Pellitier has long established the risk of child mortality attributable to undernutrition, especially mild-to-moderate [131, 132]. As underlying factors, both underweight (90%) of deliveries occur at home, and newborn care is home based. The first trial showed that newborn skin
Chapter 4 / Infant Mortality
103
wiping with chlorhexadine solution reduced neonatal mortality by 28% among low birth weight infants [162]. Previously, relative to nonintervention time periods, both vaginal cleansing prior to delivery among women and full-body cleansing among newborns with 0.25% chlorhexadine were shown to reduce neonatal mortality by 22% in Malawi [163] and Egypt [164]. In the same population in Nepal, a nested, randomized trial of topical application of chlorhexadine to the umbilical cord on days 1–4, 6, 8, and 10 compared with dry cord care or cord care with soap and water significantly reduced the risk of omphalitis (by 25%) and neonatal mortality (by 24%) [165]. A third trial conducted in Nepal used a participatory intervention with women’s groups in which a facilitator supported the group meetings to identify perinatal problems and strategies for addressing them [166]. Birth outcomes were monitored in a large cohort of 28,931 women. Relative to the control clusters, neonatal mortality was found to be significantly lower (by 30%) in the intervention clusters [166], demonstrating that a low-cost, local, and potentially sustainable intervention could have a huge impact on the risk of early infant deaths. Practices that were improved due to the intervention included antenatal care, institutional deliveries, trained birth attendance, and hygiene. Another such approach using traditional birth attendants who provided antenatal care and safe delivery kits led to a 30% reduction in perinatal mortality in Pakistan [167]. These trials provide encouraging results for simple community-based newborn interventions that can be effective on a large scale. In Gadchiroli, India, home-based neonatal care and identification of high-risk neonates has been successfully implemented over the past decade [168–172]. Thus, in resource-poor settings such home-based delivery models may be more feasible and affordable than regionalized care as practiced in the developing world involving primary, secondary, and tertiary care [173]. Results from several other such effectiveness studies are being awaited to inform the formulation of a newborn care package for addressing the high rates of neonatal mortality—the highest contributor to infant mortality—in the developing world. Cost-effectiveness analyses for sub-Saharan Africa and Southeast Asia suggested that the most effective mix of interventions were community-based newborn care package followed by antenatal care [174–176]. Packages were more effective than individual interventions due to synergies on costs, especially related to common delivery modes.
4.7
FUTURE ACTIONS
Current evidence exists to show that most infant and child deaths are preventable with low-cost, simple interventions that are somehow failing to reach those most in need. The two Lancet series, termed the Lancet’s campaign on child survival [177], draw urgent attention to and provide a much-needed push for revitalizing efforts to reduce child and newborn deaths and thereby achieve MDG-4 by 2015 [178]. A wide group of institutions, agencies, scientists, policymakers, and programmers have begun meeting once every 2 years for a “Countdown 2015” to take stock of the progress being made in preventing child deaths [178]. Partnerships for the “continuum of care approach” involving the mother, the newborn, and the child have been formed, including the Healthy Newborn Partnership, Partnership for Safe Motherhood and Newborn Health, and the Child Survival Partnership created by several countries, agencies, and international organizations [179]. And yet, the UN 2005 Human Development Report (www.undp.org) has
104
Christian
found indicators of development, public health, and education to be either slowing or stagnating, and there is concern that the MDGs will be missed by a large margin by most countries [180, 181]. Another barrier is related to the tracking of mortality in low-income countries that relies on extrapolations of trends and data from household surveys to monitor change. There is a need for coordination and consistent application of an agreed-on methodology for monitoring mortality trends [182]. The Child Mortality Coordination Group is such a group that is poised to provide technical and other assistance to countries in an effort to help strengthen their ability to collect and examine data [182]. However, urgent measures are simultaneously needed to initiate vital registration and certification systems for accurate assessment of trends and leading causes of infant and child mortality [183].
REFERENCES 1. Black RE, Morris SS, Bryce J. Where and why are 10 million children dying every year? Child survival I. Lancet 2003;361:2226–2234. 2. Bryce J, Boschi-Pinto C, Shibuya K, Black RE, WHO Child Health Epidemiology Reference Group. WHO estimates of the causes of death in children. Lancet 2005;365:1147–1152. 3. United Nations International Children’s Emergency Fund. The state of the world’s children 2005. New York: United Nations Children’s Fund, 2005. 4. Jones G, Steketee RW, Black RE, Bhutta ZA, Morris SS, Bellagio Child Survival Study Group. How many child deaths can we prevent this year? Child survival II. Lancet 2003;362:65–71. 5. Bryce J, el Arifeen S, Pariyo G, Lanata CF, Gwatkin D, Habicht J-P, Multi-Country Evaluation of IMCI Study Group. Reducing child mortality: can public health deliver? Child survival III. Lancet 2003;362:159–164. 6. Victora CG, Wagstaff A, Schellenberg JA, Gwatkin D, Claeson M, Habicht J-P. Applying an equity lens to child health and mortality: more of the same is not enough. Child survival IV. Lancet 2003;362: 233–241. 7. Bellagio Study Group on Child Survival. Knowledge into action for child survival. Child survival V. Lancet 2003;362:323–327. 8. Lawn JE, Cousens S, Zupan J, Lancet Survival Steering Team. Four million neonatal deaths: When? Where? Why? Neonatal survival 1. Lancet 2005;365:891–900. 9. Darmstadt GL, Bhutta ZA, Cousens S, Adam T, Walker N, de Bernis L, Lancet Neonatal Survival Steering Team. Evidence-based, cost-effective interventions: how many newborn babies can we save? Neonatal survival 2. Lancet 2005;365:977–988. 10. Knippenberg R, Lawn JE, Darmstadt GL, Begkoyian G, Fogstad H, Walelign N, Paul VK, Lancet Neonatal Survival Steering Team. Systematic scaling up of neonatal care in countries. Neonatal survival 3. Lancet 2005;365:1087–1098. 11. Martines J, Paul VK, Bhutta ZA, Koblinsky M, Soucat A, Walker N, Bahl R, Fogstad H, Costello A, Lancet Neonatal Survival Steering Team. Neonatal survival 4. Lancet 2005;365:1189–1197. 12. Mason E. Child survival: time to match commitments with action (comment). Lancet 2005;365:1286– 1287. 13. Bryce J, Black RE, Walker N, Bhutta ZA, Lawn JE, Steketee RW. Can the world afford to save the lives of 6 million children each year? Lancet 2005; 365:2193–2200. 14. Costello A, Osrin D. The case for a new global fund for maternal, neonatal, and child survival. Lancet 2005;366:603–605. 15. Cutler D, Miller G. The role of public health improvements in health advances: the twentieth century United States. Demography 2005;42:1–22. 16. Condran GA, Crimmins-Gardner E. Public health measures and mortality in US cities in the late nineteenth century. Human Ecol 1978;6:27–54.
Chapter 4 / Infant Mortality
105
17. Ahmed OB, Lopez AD, Inoue M. The decline in child mortality: a reappraisal. Bull World Health Organ 2000;78:1175–1191. 18. World Health Organization. World health report 2002. Reducing risks, promoting healthy life. Geneva: World Health Organization, 2002. No. WHA 540.1. 19. Sachs JD, chair. Macroeconomics and health: investing in health for human development. Geneva: World Health Organization, 2001. 20. Claeson M, Waldman RJ. The evolution of child health programmes in developing countries: from targeting diseases to targeting people. Bull World Health Organ 2000;78:1234–1245. 21. United Nations International Children’s Emergency Fund. Progress since the world summit for children: a statistical review. New York: United Nations International Children’s Emergency Fund, 2001. Available at: http://www.unicef.org/pubsgen/wethechildren-stats/sgreport_adapted_stats_eng.pdf. 22. Rutstein SO. Factors associated with trends in infant mortality and child mortality in developing countries during the 1990s. Bull World Health Organ 2000;78:1256–1270. 23. Adetunji J. Trends in under-5 mortality rates and the HIV/AIDS epidemic. Bull World Health Organ 2000;78:1200–1206. 24. Newell M-L, Coovadia H, Cortina-Borja M, Rollins N, Gaillard P, Dabis F, Ghent International AIDS Society Working Group. Mortality of infected and uninfected infants born to HIV-infected mothers in Africa: a pooled analysis. Lancet 2004;364:1236–1243. 25. Korenromp EL, Williams BG, Gouws E, Dye C, Snow RW. Measurement of trends in childhood malaria mortality in Africa: an assessment of progress toward targets based on verbal autopsy. Lancet Infect Dis 2003;3:349–358. 26. Korenromp EL, Arnold F, Williams BG, Nahlen BL, Snow RW. Monitoring trends in under-5 mortality rates through national birth history surveys. Int J Epidemiol 2004;33:1293–1301. 27. Kynast-Wolf G, Hammer GP, Muller O, Kouyate B, Becher H. Season of death and birth predict patterns of mortality in Burkina Faso. Int J Epidemiol Advance Access August 2, 2005. 28. Rayco-Solon P, Moore SE, Fulford AJ, Prentice AM. Fifty-year mortality trends in three rural African villages. Trop Med Int Health 2004;9:1151–1160. 29. Vaahtera M, Kulmala T, Maleta K, Cullinan T, Salin ML, Ashorn P. Epidemiology and predictors of infant morbidity in rural Malawi. Paediatr Perinat Epidemiol 2000;14:363–371. 30. Borus PK, Cumberland P, Sonoiya S, Kombich J, Tukei PM, Cutts FT. Measles trends and vaccine effectiveness in Nairobi, Kenya. East Afr Med J 2003;80:361–364. 31. Becker S, Weng S. Seasonal patterns of deaths in Matlab, Bangladesh. Int J Epidemiol 1998;27: 814–823. 32. Bouvier P, Breslow N, Doumbo O, Robert CF, Picquet M, Mauris A, Dolo A, Dembele HK, Delley V, Rougemont A. Seasonality, malaria, and impact of prophylaxis in a West African village. II. Effect on birthweight. Am J Trop Med Hyg 1997;56:384–389. 33. Popkin BM, Guilkey DK, Schwartz JB, Flieger W. Survival in the perinatal period: a prospective analysis. J Biosoc Sci 1993;25:359–370. 34. Eregie CO, Ofovwe G. Observations from a cluster survey on seasonality in neonatal tetanus. East Afr Med J 1992;69:619–621. 35. Gonzalez Perez G, Galvez AM, Herrera Leon LL. Seasonal variations in infant mortality in Cuba. An Esp Pediatr 1988;28:521–525. 36. Victora CG, Vaughan JP, Barros FC. The seasonality of infant deaths due to diarrheal and respiratory diseases in southern Brazil, 1974–1978. Bull Pan Am Health Organ 1985;19:29–39. 37. Mosley WH, Chen LC. An analytical framework for the study of child survival in developing countries. 1984. Bull World Health Organ 2003;81:140–145. 38. Hill K. Frameworks for studying the determinants of child survival. Bull World Health Organ 2003;81:138–139. 39. United Nations International Children’s Emergency Fund. The state of the world’s children 1998. New York: Oxford University Press, 1998:24. 40. Shandra JM, Nobles J, London B, Williamson JB. Dependency, democracy, and infant mortality: a quantitative, cross-national analysis of less developed countries. Soc Sci Med 2004;59:321–333. 41. Philip E. Why infant mortality is low in Kerala. Indian J Pediatr 1985;52:439–443.
106
Christian
42. Bryant JH. Health for all: the dream and the reality. World Health Forum 1988;9:291–302; discussion 303–314. 43. Franke RW, Chasin BH. Kerala State, India: radical reform as development. Int J Health Serv 1992;22:139–156. 44. Save the Children. State of the world’s mothers 2004. Westport, CT: Save the Children, 2004. 45. Bellew R, Raney L. Educating girls. Finance Dev 1992;29:54–56. 46. Caldwell J. The theory of fertility decline. New York: Academic, 1982. 47. Cebu Study Team. Underlying and proximate determinants of child health: The Cebu Longitudinal Health and Nutrition Study. Am J Epidemiol 1991;133:185–201. 48. Katz J, West KP Jr, Pradhan EK, LeClerq SC, Shakya TR, Khatry SK, Shrestha SR. Impact of providing a small income on women’s nutritional status and household food expenditures in rural Nepal. Food Nutr Bull 2001;22:13–18. 49. Katz J, West KP Jr, Pradhan EK, LeClerq SC, Khatry SK, Shrestha SR. The impact of a small steady stream of income for women on family health and economic well-being. Global Public Health 2007;2:35–52. 50. Wimberley D. Investment dependence and alternative explanations of third world mortality: a crossnational study. Am Sociol Rev 1990;55:830–854. 51. Katz J, West KP Jr, Khatry SK, Christian P, LeClerq SC, Pradhan EK, Shrestha SR. Risk factors for early infant mortality in Sarlahi district, Nepal. Bull World Health Organ 2003;81:717–725. 52. Fauveau V, Koenig MA, Wojtyniak B. Excess female deaths among rural Bangladeshi children: an examination of cause-specific mortality and morbidity. Int J Epidemiol 1991;20:729–735. 53. Nielsen F, Alderson A. Income inequality, development, and dualism: results from an unbalanced cross-national panel. Am Sociol Rev 1995;60:674–701. 54. Fuse K, Crenshaw EM. Gender imbalance in infant mortality: a cross-national study of social structure and female infanticide. Soc Sci Med 2006;62:360–374. 55. Johnson NE, Sufian AJM. Effect of son mortality on contraceptive practice in Bangladesh. J Biosoc Sci 1992;24:9–16. 56. Jha P, Kumar R, Vasa P, Dhingra N, Thiruchelvam D, Moineddin R. Low male-to-female sex ratio of children born in India: national survey of 1.1 million households. Lancet 2006;367:211–218. 57. Amin R. Infant and child mortality in Bangladesh. J Biosoc Sci 1988;20:59–65. 58. Ahmed MF. Infant mortality in Bangladesh: a review of recent evidence. J Biosoc Sci 1991;23:327–336. 59. Curtis SL, Steele K. Variations in familial neonatal mortality risks in four countries. J Biosoc Sci 1996;28:141–159. 60. Desai S, Alva S. Maternal education and child health: is there a strong causal relationship? Demography 1998;35:71–81. 61. Asling-Monemi K, Pena R, Ellsberg MC, Persson LA. Violence against women increases the risk of infant and child mortality: a case-referent study in Nicaragua. Bull World Health Organ 2003;81:17–18. 62. Bhargava A, Chowdhury S, Singh KK. Healthcare infrastructure, contraceptive use and infant mortality in Uttar Pradesh, India. Econ Hum Biol 2005;3:388–404. 63. Cleland J, Bicego G, Fegan G. Socioeconomic inequalities in childhood mortality: the 1970s to the 1980s. Health Trans Rev 1992;2:1–18. 64. Arntzen A, Samuelsen SO, Bakketeig LS, Stoltenberg C. Socioeconomic status and risk of infant death. A population-based study of trends in Norway, 1967–1998. Int J Epidemiol 2004;33:279–288. 65. Brockerhoff M. Rural-to-urban migration and child survival in Senegal. Demography 1990;27:601–616. 66. Davanzo J, Butz WP, Habicht JP. How biological and behavioural influences on mortality in Malaysia vary during the first year of life. Pop Stud 1983;37:381–402. 67. Brockerhoff M, Derose LF. Child survival in East Africa: the impact of preventive health care. World Dev 1996;24:1841–1857. 68. Merrick TW. The effect of piped water on early childhood mortality in urban Brazil, 1970 to 1976. Demography 1985;22:1–24. 69. Davanzo J, Habicht JP. Infant mortality decline in Malaysia, 1946–1975: the roles of changes in variables and changes in the structure of the relationships. Demography 1986;23:143–160. 70. Paul BK. Health service resources as determinants of infant death in rural Bangladesh: an empirical study. Soc Sci Med 1991;32:43–49.
Chapter 4 / Infant Mortality
107
71. Becher H, Muller O, Jahn A, Gbangou A, Kynast-Wolf G, Kouyate B. Risk factors of infant and child mortality in rural Burkina Faso. Bull World Health Organ 2004;82:265–273. 72. James C, Morris SS, Keith R, Taylor A. Impact on child mortality of removing user fees: simulation model. BMJ 2005;331;747–749. 73. Bicego G, Ahmad OB. Infant and child mortality. Demographic and health surveys, comparative studies No. 20. Calverton, MD: Macro International, 1996. 74. Geronimus AT, Korenman S. The socioeconomic costs of teenage childbearing: evidence and interpretation. Demography 1993;30:281–290. 75. Manda SOM. Unobserved family and community effects on infant mortality in Malawi. Genus 1998;54:143–164. 76. Markovitz BP, Cook R, Flick LH, Leet TL. Socioeconomic factors and adolescent pregnancy outcomes: distinctions between neonatal and post-neonatal deaths? BMC Public Health 2005;5:79–85. 77. Mavalankar DV, Trivedi CR, Gray RH. Levels and risk factors for perinatal mortality in Ahmedabad, India. Bull World Health Organ 1991;69:435–442. 78. Van den Broeck J, Eeckels R, Massa G. Maternal determinants of child survival in a rural African community. Int J Epidemiol 1996;25:998–1004. 79. Hull TH, Gubhaju B. Multivariate analysis of infant and child mortality in Java and Bali. J Biosoc Sci 1986;18:109–118. 80. Leach A, McArdle TF, Banya WAS, Krubally O, Greenwood AM, Rands C, et al. Neonatal mortality in a rural area of the Gambia. Ann Trop Paediatr 1999;19:33–43. 81. Barros FC, Victoria CG, Vaughan JP, Estanislau HJ. Perinatal mortality in southern Brazil: a population-based study of 7,392 births. Bull World Health Organ 1987;65:95–104. 82. Greenwood AM, Greenwood BM, Bradley AK, Williams K, Shenton FC, Tulloch S, et al. A prospective survey of the outcome of pregnancy in a rural area of the Gambia. Bull World Health Organ 1987;65:635–643. 83. Kusin JA, Kardjati S, de With C. Infant mortality in Madura, Indonesia. Implications for action. J Trop Pediatr 1989;35:129–132. 84. Razzaque A, Ahmed K, Wai L. Twinning rates in a rural area of Bangladesh. Hum Biol 1990;62:505–514. 85. Chowdhury MK, Khan NU, Wai L, Bairagi R. Sex differences and sustained excess in mortality among discordant twins in Matlab, Bangladesh: 1977–1985. Int J Epidemiol 1990;19:387–390. 86. Katz J, West KP, Khatry SK, LeClerq SC, Christian P, Pradhan EK, Shrestha SR. Twinning rates and survival of twins in Nepal. Int J Epidemiol 2001;30:802–807. 87. Cleland J, Sathar ZA. The effect of birth spacing on childhood mortality in Pakistan. Pop Stud 1984;38:401–418. 88. Koenig MA, Phillips JF, Campbell OM, D’Souza S. Birth intervals and childhood mortality in rural Bangladesh. Demography 1990;27:251–265. 89. Miller JE, Trussell J, Pebley AR, Vaughan B. Birth spacing and child mortality in Bangladesh and the Philippines. Demography 1992;29:305–318. 90. Madise NJ, Diamond I. Determinants of infant mortality in Malawi: an analysis to control for death clustering within families. J Biosoc Sci 1995;27:95–106. 91. Whitworth A, Stephenson R. Birth spacing, sibling rivalry and child mortality in India. Soc Sci Med 2002;55:2107–2119. 92. Rutstein SO. Effects of preceding birth intervals on neonatal, infant and under-5 years mortality and nutritional status in developing countries: evidence from the demographic and health surveys. Int J Gynecol Obstet 2005;89:S7–S24. 93. Madise NJ. Infant mortality in Zambia: socioeconomic and demographic correlates. Soc Biol 2003;50:148–166. 94. Setty-Venugopal V, Upadhyay UD. Birth spacing: three to five saves lives. Baltimore, MD: Johns Hopkins University, Population Information Program, 2002. 95. De Sweemer C. The influence of child spacing on child survival. Pop Stud 1984;38:47–72. 96. Swenson I. Relationships between pregnancy spacing, sex of infants, maternal age, and birth order, and neonatal and post-neonatal mortality in Bangladesh. Soc Biol 1981;28:299–307.
108
Christian
97. Hobcraft JN, McDonald JW, Rutstein SO. Demographic determinants of infant and early child mortality: a comparative analysis. Pop Stud 1985;39:363–385. 98. Palloni A, Millman S. Effects of inter-birth intervals and breastfeeding on infant and early childhood mortality. Pop Stud 1986;40:215–236. 99. Pebley AR, Stupp PW. Reproductive patterns and child mortality in Guatemala. Demography 1987;24:43–60. 100. Retherford RD, Choe MK, Thapa S, Gubhaju BB. To what extent does breastfeeding explain birthinterval effects on early childhood mortality? Demography 1989;26:439–450. 101. Ceesay SM, Prentice AM, Cole TJ, Foord F, Weaver LT, Poskitt EM, Whitehead RG. Effects on birth weight and perinatal mortality of maternal dietary supplements in rural Gambia: 5 year randomised controlled trial. BMJ 1997;315:786–790. 102. Christian P. Micronutrients and reproductive health issues: an international perspective. J Nutr 2003;133:1969S–1973S. 103. Katz J, West KP Jr, Khatry SK, Pradhan EK, LeClerq SC, Christian P, Wu LSF, Adhikari RK, Shrestha SR, Sommer A. Maternal low-dose vitamin A or beta-carotene supplementation has no effect on fetal loss and early infant mortality: a randomized cluster trial in Nepal. Am J Clin Nutr 2000;71:1507– 1576. 104. Christian P, West KP Jr, Khatry SK, LeClerq SC, Kimbrough-Pradhan E, Katz J, Shrestha SR. Maternal night blindness increases risk of mortality in the first 6 months of life among infants in Nepal. J Nutr 2001;131:1510–1512. 105. Alexander GR, Himes JH, Kaufman RB, Mor J, Kogan M. A United States national reference for fetal growth. Obstet Gynecol 1996;87:163–168. 106. Dreyfuss ML, Stoltzfus RJ, Shrestha JB, Pradhan EK, LeClerq SC, Khatry SK, Shrestha SR, Katz J, Albonico M, West KP Jr. Hookworms, malaria and vitamin A deficiency contribute to anemia and iron deficiency among pregnant women in the plains of Nepal. J Nutr 2000;130:2527–2536. 107. Christian P, Khatry SK, West KP Jr. Antenatal anthelmintic treatment, birthweight, and infant survival in rural Nepal. Lancet 2004;364:981–983. 108. Stoltzfus RJ, Dreyfuss ML. Guidelines for the use of iron supplements to prevent and treat iron deficiency anemia. International Nutritional Anemia Consultative Group, World Health Organization, United Nations Children’s Fund. Washington, DC: ILSI, 1998. 109. Goldman AS, Chheda S, Garofalo R. Evolution of immunologic functions of the mammary gland and the postnatal development of immunity. Pediatr Res 1998;43:155–162. 110. Labbok MH, Clark D, Goldman AS. Breastfeeding: maintaining an irreplaceable immunological resource. Nat Rev Immunol 2004;4:565–572. 111. WHO Collaborative Study Team on the Role of Breastfeeding on the Prevention of Infant Mortality. Effect of breastfeeding on infant and child mortality due to infectious diseases in less developed countries: a pooled analysis. Lancet 2000;355:451–455. 112. Bahl R, Frost C, Kirkwood BR, Edmond K, Martines J, Bhandari N, Arthur P. Infant feeding patterns and risks of death and hospitalization in the first half of infancy: multicenter cohort study. Bull World Health Organ 2005;83:418–426. 113. Huffman SL, Zehner ER, Victora C. Can improvements in breast-feeding practices reduce neonatal mortality in developing countries? Midwifery 2001;17:80–92. 114. Ashraf RN, Jalil F, Zaman S, Karlberg J, Khan SR, Lindblad BS, Hanson LA. Breast feeding and protection against neonatal sepsis in a high risk population. Arch Dis Child 1991;66:488–490. 115. Jakobsen MS, Sodemann M, Molbak K, Alvarenga IJ, Nielsen J, Aaby P. Termination of breastfeeding after 12 months of age due to a new pregnancy and other causes is associated with increased mortality in Guinea-Bissau. Int J Epidemiol 2003;32:92–96. 116. World Health Organization. New data on the prevention of mother-to-child transmission of HIV and their policy implications: conclusions and recommendations. Geneva, October 11–13, 2000, approved January 15, 2001 [cited January 19, 2001]. Available at: http://www.who.int/child-adolescent-health/ publications/NUTRITION/New_data.htm, 2000. 117. Ross JS, Labbok MH. Modeling the effects of different infant feeding strategies on infant survival and mother-to-child transmission of HIV. Am J Public Health 2004;94:1174–1180.
Chapter 4 / Infant Mortality
109
118. Piwoz EG, Ross JS. Use of population-specific infant mortality rates to inform policy decisions regarding HIV and infant feeding. J Nutr 2005;135:1113–1119. 119. Morris SS, Black RE, Tomaskovic L. Predicting the distribution of under-five deaths by cause in countries without adequate vital registration systems. Int J Epidemiol 2003;32:1041–1051. 120. Snow RW, Korenromp EL, Gouws E. Pediatric mortality in Africa: Plasmodium falciparum malaria as a cause or risk? Am J Trop Med Hyg 2004;71:16–24. 121. Villamor E, Msamanga G, Aboud S, Urassa W, Hunter DJ, Fawzi WW. Short report: adverse perinatal outcomes of HIV-1-infected women in relation to malaria parasitemia in maternal and umbilical cord blood. Am J Trop Med Hyg 2005;73:694–697. 122. Verhoeff FH, Cessie SL, Kalanda BF, Kazembe PN, Broadhead RL, Brabin BJ. Post-neonatal infant mortality in Malawi: the importance of maternal health. Ann Trop Paed 2004;24:161–169. 123. Merchant T, Schellenberg JA, Nathan R, Abdulla S, Mukasa O, Mshinda H, Lengeler C. Anaemia in pregnancy and infant mortality in Tanzania. Trop Med Int Health 2004;9:262–266. 124. Gemperli A, Vounatsou P, Kleinschmidt I, Bagayoko M, Lengeler C, Smith T. Spatial patterns of infant mortality in Mali: the effect of malaria endemicity. Am J Epidemiol 2004;159:64–72. 125. Rowe AK, Rowe SY, Snow RW, Korenromp EL, Armstrong Schellenberg JR, Stein C, Nahlen BL, Bryce J, Black RE, Steketee RW. The burden of malaria mortality among African children in the year 2000. Int J Epidemiol 2006 Advance Access February 28, 2006. 126. Guyatt HL, Snow RW. Malaria in pregnancy as an indirect cause of infant mortality in sub-Saharan Africa. Trans R Soc Trop Med Hyg 2001;95:569–576. 127. Armstrong Schellenberg JRM, Abdulla S, Natha R, et al. Effect of large-scale social marketing of insecticide-treated nets on child survival in rural Tanzania. Lancet 2001;357:1241–1247. 128. Lindblade KA, Eisele TP, Gimnig JE, Alaii JA, Odhiambo F, ter Kuile FO, Hawley WA, Wannemuehler KA, Phillips-Howard PA, Rosen DH, Nahlen BL, Terlouw DJ, Adazu K, Vulule JM, Slutsker L. sustainability of reductions in malaria transmission and infant mortality in western Kenya with use of insecticide-treated bednets. 4 to 6 years of follow-up. JAMA 2004;291:2571–2580. 129. Fenn B, Morris SS, Black RE. Comorbidity in childhood in northern Ghana: magnitude, associated factors, and impact on mortality. Int J Epidemiol 2005;34:368–375. 130. Freeman JV, Christian P, Khatry SK, Adhikari RK, LeClerq SC, Katz J, Darmstadt GL. Evaluation of neonatal verbal autopsy using physician review versus algorithm-based cause-of-death assignment in rural Nepal. Paediatr Perinat Epidemiol 2005;19:323–331. 131. Pelletier DL. The potentiating effects of malnutrition on child mortality: epidemiologic evidence and policy implications. Nutr Rev 1994;52:409–415. 132. Pelletier DL, Frongillo EA Jr, Schroeder DG, Habicht JP. The effects of malnutrition on child mortality in developing countries. Bull World Health Organ 1995;73:443–448. 133. Caulfield LE, de Onis M, Blossner M, Black RE. Undernutrition as an underlying cause of child deaths associated with diarrhea, pneumonia, malaria, and measles. Am J Clin Nutr 2004;80:193–198. 134. Caulfield LE, Richard SA, Black RE. Undernutrition as an underlying cause of malaria morbidity and mortality in children less than 5 years old. Am J Trop Med Hyg 2004;71:55–63. 135. Pelletier DL, Frongillo EA. Changes in child survival are strongly associated with changes in malnutrition in developing countries. J Nutr 2003;133:107–119. 136. Rice AL, West KP Jr, Black RE. Vitamin A deficiency. In: Comparative quantification of health risks. Global and regional burden of disease attributable to selected major risk factors, vol. 1. Ezzati M, Lopez AD, Rodgers A, Murray CJL, eds. Geneva: World Health Organization, 2004;4:211–256. 137. Caulfield L, Black RE. Zinc deficiency. In: Comparative quantification of health risks. Global and regional burden of disease attributable to selected major risk factors, vol. 1. Ezzati M, Lopez AD, Rodgers A, Murray CJL, eds. Geneva: World Health Organization, 2004;5:257–279. 138. Tielsch JM, Khatry SK, Stoltzfus RJ, Katz J, LeClerq SC, Adhikari R, Mullany LC, Shrestha S, Black RE. Effect of routine prophylactic supplementation with iron and folic acid on preschool child mortality in southern Nepal: community-based, cluster-randomised, placebo-controlled trial. Lancet 2006;367:144–152. 139. Sazawal S, Black RE, Ramsan M, Chwaya HM, Stoltzfus RJ, Dutta A, Dhingra U, Kabole I, Deb S, Othman MK, Kabole FM. Effects of routine prophylactic supplementation with iron and folic acid on
110
140. 141. 142. 143. 144. 145. 146.
147.
148.
149. 150. 151. 152. 153.
154. 155. 156.
157.
158.
159.
160.
Christian admission to hospital and mortality in preschool children in a high malaria transmission setting: community-based, randomised, placebo-controlled trial. Lancet 2006;367:133–143. Datta N, Mand M, Kumar V. Validation of causes of infant death in the community by verbal autopsy. Indian J Pediatr 1988;55:599–604. Kalter HD, Gray RH, Black RE, Gultiano SA. Validation of postmortem interviews to ascertain selected causes of death in children. Int J Epidemiol 1990;19:380–386. Mirza NM, Macharia WM, Wafula EM, Agwanda RO, Onyango FE. Verbal autopsy: a tool for determining cause of death in a community. E Afr Med J 1990;67:693–698. Snow B, Marsh K. How useful are verbal autopsies to estimate childhood causes of death? Health Policy Plan 1992;7:22–29. Marsh DR, Sadruddin S, Fikree FF, Krishnan C, Darmstadt GL. Validation of verbal autopsy to determine the cause of 137 neonatal deaths in Karachi, Pakistan. Paed Perinat Epidemiol 2003;17:132–142. Shrivastava SP, Kumar A, Ojha AK. Verbal autopsy determined causes of neonatal deaths. Indian Pediatr 2001;38:1022–1025. Weiner R, Ronsmans C, Dorman E, Jilo H, Muhoro A, Shulman C. Labour complications remain the most important risk factors for perinatal mortality in rural Kenya. Bull World Health Organ 2003;81:561–566. Kulmala T, Vaahtera M, Rannikko J, et al. The relationship between antenatal risk characteristics, place of delivery and adverse delivery outcome in rural Malawi. Acta Obstet Gynecol Scand 2000;79:984–990. Chalumeau M, Salanave B, Bouvier-Colle MH, De Bernis L, Prual A, Breart G. Risk factors for perinatal mortality in West Africa: a population-based study of 20326 pregnancies. Acta Paediatr 2000;89:1115–1121. Child Health Research Project. Reducing perinatal and neonatal mortality. Volume 3, No. 1. Report of a meeting May 10–12, 1999. Baltimore, MD: Johns Hopkins University, 1999. World Health Organization. The world health report 2001. Geneva: World Health Organization, 2001. Koblinsky MA, Tinker A, Daly P. Programming for safe motherhood: a guide to action. Health Policy Plan 1994;9:252–266. United Nations International Children’s Emergency Fund. State of the world’s children report 2001. New York: United Nations International Children’s Emergency Fund, 2000. Barros FC, Victora CG, Barros AJD, Santos IS, Albernaz E, Matijasevich A, Domingues MR, Sclowitz IKT, Hallal PC, Silveira MF, Vaughan JP. The challenge of reducing neonatal mortality in middle-income countries: findings from three Brazilian birth cohorts in 1982, 1993, and 2004. Lancet 2005;365: 847–854. Lancet. The world’s forgotten children (comment). Lancet 2003;361:1. Working Group on Women and Child Health. Improving child health: the role of research. BMJ 2002;324:1444–1447. Okeke IN, Laxminarayan R, Bhutta ZA, Duse AG, Jenkins P, O’Brien TF, Pablos-Mendez A, Klugman KP. Antimicrobial resistance in developing countries. Part I: recent trends and current status. Lancet Infect Dis 2005;5:481–493. Okeke IN, Klugman KP, Bhutta ZA, Duse AG, Jenkins P, O’Brien TF, Pablos-Mendez A, Laxminarayan R. Antimicrobial resistance in developing countries. Part II: strategies for containment. Lancet Infect Dis 2005;5:568–580. Rahmathullah L, Tielsch JM, Thulasiraj RD, Katz J, Coles C, Devi S, John R, Prakash K, Sadanand AV, Edwin N, Kamaraj C. Impact of supplementing newborn infants with vitamin A on early infant mortality: community based randomised trial in southern India. BMJ 2003;327:254–259. Humphrey JH, Agoenstina T, Wu L, Usman A, Nurachim M, Subardja D, Hidayat S, Tielsch J, West KP Jr, Sommer A. Impact of neonatal vitamin A supplementation on infant morbidity and mortality. J Pediatr 1996;128:489–496. Humphrey JH, Iliff PJ, Marinda ET, Mutasa K, Moulton LH, Chidawanyika H, Ward BJ, Nathoo KJ, Malaba LC, Zijenah LS, Zvandasara P, Ntozini R, Mzengeza F, Mahomva AI, Ruff AJ, Mbizvo MT, Zunguza CD, ZVITAMBO Study Group. Effects of a single large dose of vitamin A, given during
Chapter 4 / Infant Mortality
161. 162.
163. 164. 165.
166.
167. 168.
169. 170.
171. 172. 173. 174.
175. 176.
177. 178. 179. 180. 181. 182.
183.
111
the postpartum period to HIV-positive women and their infants, on child HIV infection, HIV-free survival, and mortality. J Infect Dis 2006;193:860–871. Fawzi, WW, Msamanga GI, Hunter D, et al. Randomized trial of vitamin supplements in relation to transmission of HIV-1 through breastfeeding and early child mortality. AIDS 2002;16:1935–1944. Tielsch JM, Darmstadt GL, Mullany LC, Khatry SK, Katz J, LeClerq SC, Shrestha S, Adhikari R. Impact of newborn skin-cleansing with chlorhexadine on neonatal mortality in southern Nepal: a community-based, cluster-randomized trial. Pediatrics 2007;76:725–731. Taha TE, Biggar RJ, Broadhead RL, et al. Effect of cleaning the birth canal with antiseptic solution on maternal and newborn morbidity and mortality in Malawi. BMJ 1997;315:216–220. Bakr AF, Karkour T. Effect of predelivery vaginal antisepsis on maternal and neonatal morbidity and mortality in Egypt. J Womens Health 2005;14:496–501. Mullany LC, Darmstadt GL, Khatry SK, Katz J, LeClerq SC, Shrestha S, Adhikari R, Tielsch JM. Topical applications of chlorhexidine to the umbilical cord prevent omphalitis and neonatal mortality in southern Nepal: a community-based, cluster-randomized trial. Lancet 2006; 367:910–918. Manandhar DS, Osrin D, Shrestha BP, Mesko N, Morrison J, Tumbahangphe KM, Tamang S, Thapa S, Shrestha D, Thapa B, Shrestha JR, Wade A, Borghi J, Standing H, Manandhar M, de L Costello AM, MIRA Makwanpur Trial Team. Effect of a participatory intervention with women’s groups on birth outcomes in Nepal: cluster-randomised controlled trial. Lancet 2004;364:970–979. Jokhio AH, Winter HR, Cheng KK. An intervention involving traditional birth attendants and perinatal and maternal mortality in Pakistan. N Engl J Med 2005;352:2091–2099. Bang AT, Bang RA, Stoll BJ, Baitule SB, Reddy HM, Deshmukh MD. Is home-based diagnosis and treatment of neonatal sepsis feasible and effective? Seven years of intervention in the Gadchiroli field trial (1996 to 2003). J Perinatol 2005;25S:S62–S71. Reddy MH, Bang AT. How to identify neonates at risk of death in rural India: clinical criteria for the risk approach. J Perinatol 2005;25S:S44–S50. Bang AT, Reddy HM, Bang RA, Deshmukh MD. Why do neonates die in rural Gadchiroli, India? (Part II): estimating population attributable risks and contribution of multiple morbidities for identifying a strategy to prevent deaths. J Perinatol 2005;25S:S35–S43. Bang AT, Bang RA. Background of the field trial of home-based neonatal care in Gadchiroli, India. J Perinatol 2005;25S:S3–S10. Bang AT, Bang RA, Reddy HM. Home-based neonatal care: summary and applications of the field trial in rural Gadchiroli, India (1993 to 2003). J Perinatol 2005;25S:S108–S122. Paul VK, Singh M. Regionalized perinatal care in developing countries. Semin Neonatal 2004; 9:117–124. Adam T, Lim SS, Mehta S, Bhutta ZA, Fogstad H, Mathai M, Zupan J, Darmstadt GL. Cost effectiveness analysis of strategies for maternal and neonatal health in developing countries. BMJ 2005;331:1107–1110. Barnett S, Nair N, Lewycka S, Costello A. Community interventions for maternal and perinatal health (commentary). Int J Obstet Gynaecol 2005;112:1170–1173. Borghi J, Thapa B, Osrin D, Jan S, Morrison J, Tamang S, Shrestha BP, Wade A, Manandhar DS, de L Costello AM. Economic assessment of a women’s group intervention to improve birth outcomes in rural Nepal. Lancet 2005;366:1882–1884. Horton R. Newborn survival: putting children at the centre (comment). Lancet 2005;365:821–822. Bryce J, Victora CG. Child survival: countdown to 2015 (comment). Lancet 2005;365:2153–2154. Tinker A, ten Hoppe-Bender P, Azfar S, Bustreo F, Bell R. A continuum of care to save newborn lives (comment). Lancet 2005;365:822–825. Dyer O. Goals to reduce poverty and infant mortality will be missed. News BMJ 2005;331:593. Lancet Infectious Diseases. Poor shooting at the millennium development goals (editorial). Lancet Infect Dis 2005;5:529. Child Mortality Coordination Group. Tracking progress towards the Millenium Development Goals: reaching consensus on child mortality levels and trends. Bull World Health Organ 2006; 84:225–232. Lopez AD. Commentary: estimating the causes of child deaths. Int J Epidemiol 2003;32:1052–1053.
“This page left intentionally blank.”
5
Child Growth and Development Mercedes de Onis
5.1
INTRODUCTION
The quality of life of infants and young children, as opposed to mere survival, is becoming increasingly important. Most developing countries have experienced dramatic decreases in their infant and under-5 mortality rates over the last three decades. As greater numbers of children survive, it becomes critical to pay closer attention to children’s ability to develop their full physical and mental potentials. This will in turn have important consequences in adult life. Child growth is internationally recognized as the best global indicator of physical well-being in children because poor feeding practices—in both quantity and quality—and infections, or more often a combination of the two, are major factors that affect physical growth and mental development in children [1]. Poor child growth is the consequence of a range of factors that are closely linked to the overall standard of living and whether a population can meet its basic needs, such as access to food, housing, and health care. Child growth assessment thus not only serves as a means for evaluating the health and nutritional status of children but also provides an excellent measurement of the inequalities in health faced by populations. Based on this principle, internationally set health goals for this century will be assessed on the basis of improvements in the rates of underweight among children younger than 5 years [2]. There is strong evidence that poor physical growth is usually associated with deficient or delayed mental development [3], and a number of studies have demonstrated a relationship between growth status and school performance and intellectual achievement [4, 5]. The precise mechanism linking impaired growth and poor mental development is not known. The association cannot be regarded as a simple causal relationship because of the complex environmental factors that affect both growth and development; many socioeconomic disadvantages that coexist with stunting or underweight may also detrimentally affect mental development. It is possible that more than one mechanism act together. For example, nutritionally deprived children are often described as lethargic, possibly because they reduce their activity as a protective measure to conserve energy [6]. This reduced activity limits the child’s ability for exploration and interaction and thus may have negative consequences for children’s motor and cognitive development. Children who do not practice their existing skills may be less likely to acquire new skills. At the same time, the apathy these children exhibit could lead adults to treat them From: Nutrition and Health: Nutrition and Health in Developing Countries, Second Edition Edited by: R. D. Semba & M. W. Bloem © Humana Press, Totowa, NJ
113
114
de Onis
differently from nonstunted children. Undernutrition could also have a direct effect on children’s central nervous system. These complex relationships make it difficult to disentangle the exact mechanisms of the association between deficits in growth and poor mental development. Impaired growth is ultimately a response to limited nutrient availability or utilization at the cellular level. Although in the past most of the attention has been directed toward the negative consequences associated with inadequate protein-energy intake, there is increasing recognition of the important role that micronutrient deficiency plays in children’s growth and development. At severe levels of protein-energy deficiency, linear growth probably stops, and body reserves are used as energy and protein sources to maintain vital functions. At less-severe stages, however, it may be possible to cope by simply slowing the rate of linear growth and other compensatory mechanisms, such as reduced activity. The negative consequences of micronutrient deficiencies range from altered immunity and increased risk of infectious diseases and death to reduced growth and mental development [7].
8
Educational level
6
No education Primary Secondary
Height-for-age standard deviations
4
Higher
2
0
-2
-4
-6
-8
Nepal
Pakistan
Bolivia Country
Fig. 5.1. Variation of height for age according to educational level.
Peru
Chapter 5 / Child Growth and Development
115
Nutritional deficiencies in turn are deeply rooted in poverty and deprivation. Poverty breeds undernutrition, which in turn generates poverty in a vicious cycle that perpetuates across generations. The intrinsic links between poverty and nutrition have been reviewed in detail elsewhere [8]. Based on national-level data, Fig. 5.1 shows the effect of socioeconomic status on stunting (i.e., low height-for-age) for four countries in Asia and Latin America. These associations are consistent across those countries with similar dose-response relationship. Regardless of the origin, the consequences of impaired growth and development in children can be long lasting and compromise academic performance and the ability to contribute to society. Most growth retardation occurs very early in life; the two periods of highest vulnerability are during intrauterine development and during the transition from reliance on breast milk to addition of other foods to the diet, generally beginning in the second 6 months of life [9]. In fact, almost all of the growth retardation documented in studies carried out in developing countries has its origin in the first 2 or 3 years of life [10]. Once present, growth retardation usually remains for life as growth deficits are generally not recuperated [11]. This chapter reviews concepts and indicators for measuring impaired fetal and child growth; describes the magnitude and geographical distribution of growth retardation in developing countries; discusses the links between fetal and child growth retardation; outlines the main health and social consequences of impaired growth in terms of morbidity, mortality, child development, and adult-life consequences; and reviews interventions aimed at promoting healthy growth and development.
5.2
MEASURING IMPAIRED GROWTH: CONCEPTS AND INDICATORS
Assessing childhood growth remains a mainstay of pediatric care in all settings, that is, in the most advanced health care centers and those faced with severe resource constraints. It is the most widespread approach for assessing body size, weight, composition, and proportions. It can be done inexpensively and noninvasively and is of inherent interest to caretakers responsible for children’s welfare. Growth assessment’s principal utility to health care stems from its screening value, such as assessing general well-being; identifying growth faltering and excessive growth; managing infant feeding; evaluating maternal lactation performance, the suitability of weaning practices, and related infant behaviours and the follow-up of children with medical conditions known to affect growth adversely (e.g., renal and cardiac patients). It is also useful for population health purposes, such as the assessment of community levels of over- and undernutrition, the prediction and ongoing assessments of feeding emergencies, and assessments of economic resource distribution.
5.2.1
Fetal Growth
Growth failure is a cumulative process that can begin in utero. Various criteria have been used to classify an infant as having experienced normal, subnormal, or supranormal growth in utero. An expert committee from the World Health Organization (WHO) recommended the tenth percentile of a birth-weight-for-gestational-age, sex-specific,
116
de Onis
single/twins risk curve for the classification of small for gestational age [1]. Strictly speaking, small-for-gestational-age infants are not synonymous to intrauterine growth restriction (IUGR); some small-for-gestational-age infants may merely represent the lower tail of the normal fetal growth distribution. In individual cases, however, it is usually very difficult to determine whether an observed birth weight that is low for gestational age is the result of true in utero growth restriction or represents a “normally small” infant. Classification of IUGR is therefore based on the established cutoff for small for gestational age. The higher the prevalence of infants small for gestational age in a given population, the greater the likelihood that small for gestational age is a result of IUGR [1]. Historically, because valid assessment of gestational age is often not available in developing countries, the incidence of low birth weight (LBW) has been used as a proxy to quantify the magnitude of IUGR in these settings. This approach, however, underestimates considerably the true magnitude of IUGR as it does not take into account those infants whose weight at birth falls below the tenth percentile but who weigh more than 2500 g; many of these infants are likely also to have IUGR [12]. It is thus important to improve the availability and quality of gestational age estimates on a population-wide basis in developing countries. This includes, if feasible, recording early in pregnancy the mother’s recall of the date her last normal menstrual period began and the training of birth attendants in the physical assessment of the newborn. In developed countries, early ultrasound examination has improved the validity and reliability of gestational age assessment, although evidence from randomized trials did not demonstrate improvement in maternal or fetal/infant outcomes with routine early ultrasound [13]. The issue of which reference curve to use in assessing growth at birth has been a cause of debate. Based on the observations that children of well-off populations in developing countries experience similar growth patterns as those of healthy, well-nourished children in developed countries and that children of the same genetic background show differing growth performance depending on the environment in which they grow up, there is prevailing international consensus that children of all races have the same growth potential, and that country- or race-specific growth references are not advised [1]. Growth curves should certainly not be adjusted for factors that may be a cause of growth retardation. For example, making adjustments for the height of stunted parents in deprived populations could reinforce the wrong impression that children from these populations are born small for genetic reasons, and that not much can be done about this. On this basis, a group of international experts recommended that an international fetal growth reference curve should be developed based on pooled data from countries in different geographical regions where fetal growth is believed to be optimal [13]. There remain outstanding research questions in the classification and definition of IUGR. Although the use of a single, sex-specific international reference is justifiable, research is needed to assess whether infants of different genetic backgrounds born at a particular weight for gestational age are at substantially different risks for mortality and morbidity. Similarly, it would be important to determine whether infants who are born small because their mothers are primiparous or living at high altitude are at the same risk for adverse outcomes as those of equivalent size who are small because, for instance, their mothers are stunted, have preeclampsia, or are smokers. In addition, research is needed to base the criteria for defining IUGR on evidence of increased risk
Chapter 5 / Child Growth and Development
117
for important health outcomes, such as perinatal mortality. Because proportionality at birth may be related to adverse health outcomes [13, 14], an attempt should also be made to develop reference data and indicators for the classification of newborns as “wasted” and “stunted” and to quantifying the morbidity and mortality risks associated with these two types of infants.
5.2.2
Child Growth Indicators and Their Interpretation
In children, the three most commonly used indicators to assess growth status are weightfor-age, length/height-for-age, and weight-for-length/height. Weight-for-age is the most commonly applied and, for more than half of the world’s countries, the sole anthropometric indicator used [15]. Although it is the easiest indicator to use when children’s ages are known, weight-for-age lacks the biological specificity necessary to separate weight- from length/height-related deficits or excesses in growth. Conversely, length/height-for-age and weight-for-length/height permit the distinction of stunted, wasted, and overweight children and allow the appropriate targeting of interventions [16, 17]. The routine collection of length/height measurements (recumbent length up to 2 years of age and standing height for older children) is important because this enables the assessment of not only weight-for-height, but also body mass index (i.e., ratio of weight in kilograms to the square of height in meters), a valuable indicator proposed for monitoring the increasing public health problems of overweight and obesity in childhood [18]. The interpretation of the commonly used anthropometric indicators is as follows: Low weight-for-age: Weight-for-age reflects body mass relative to chronological age. It is influenced by both the child’s height (height-for-age) and weight (weight-for-height). Its composite nature makes interpretation complex. For example, weight-for-age fails to distinguish between short children of adequate body weight and tall, thin children. However, in the absence of significant wasting in a community, similar information is provided by weight-for-age and height-for-age in that both reflect an individual’s or population’s long-term health and nutritional experiences. Short-term changes, especially reductions in weight-for-age, reveal changes in weight-for-height. In general terms, the worldwide variation of low weight-for-age and its age distribution are similar to those of low height-for-age [19]. Low height-for-age: Stunted growth reflects a process of failure to reach linear growth potential as a result of suboptimal health or nutritional conditions. On a population basis, high levels of stunting are associated with poor socioeconomic conditions (Fig. 5.1) and increased risk of frequent and early exposure to adverse conditions such as illness or inappropriate feeding practices. Similarly, a decrease in the national stunting rate is usually indicative of improvements in overall socioeconomic conditions of a country [20]. The worldwide variation of the prevalence of low height-for-age is considerable, ranging from 5% to 65% among the less-developed countries [21]. In many such settings, prevalence starts to rise at about 3 months of age; the process of stunting slows at around 3 years of age, after which mean heights run parallel to the current international reference [10]. Therefore, the age modifies the interpretation of findings: For children in the age group below 2–3 years, low height-for-age probably reflects a continuing process of “failing to grow” or “stunting”; for older children, it reflects a state of “having failed to grow” or “being stunted.” From the point of view of interventions, it is important to differentiate between these two groups.
118
de Onis
Low weight-for-height: Wasting or thinness indicates in most cases a recent and severe process of weight loss, which is often associated with acute starvation or severe disease. However, wasting also may be the result of chronic unfavorable conditions. Provided there is no severe food shortage, the prevalence of wasting is usually below 5%, even in poor countries [19]. The Indian subcontinent, where a higher prevalence of wasting is found, is an important exception. A prevalence between 10% and 14% is regarded as serious and above or equal to 15% as critical [1]. Typically, the prevalence of low weight-for-height reaches a peak in the second year of life [19]. Lack of evidence of wasting in a population does not imply the absence of current nutritional problems: Stunting and other deficits may be present [22]. Given these characteristics wasting or thinness demands a careful assessment whenever it is encountered. High weight-for-height: Overweight is the preferred term for describing high weightfor-height [1]. Even though there is a strong correlation between high weight-for-height and obesity as measured by adiposity, greater lean body mass can also contribute to high weight-for-height. On an individual basis, therefore, “fatness” or “obesity” should not be used to describe high weight-for-height. However, on a population-wide basis, high weight-for-height can be considered as an adequate indicator of obesity because the majority of individuals with high weight-for-height are obese. Strictly speaking, the term obesity should be used only in the context of adiposity measurements, for example, skinfold thickness. Other available anthropometric indicators that are used to describe growth status during childhood include mid-upper arm circumference (MUAC), body mass index (BMI), skinfolds, and head circumference; however, none of these has achieved such widespread use as the height- and weight-based indicators mentioned due, in part, to the lack of widely acceptable pediatric reference data for their interpretation. For some of these measurements, technical difficulties result in high intra- and interindividual variation and require skilled individuals to perform the measurements accurately and precisely. For skinfolds, the cost of equipment also has precluded their wide application in children. MUAC-for-age has been proposed as an alternative indicator for use where the collection of height and weight measurements is difficult (e.g., refugee crises); however, its proper application requires the use of age-specific reference data for its accurate interpretation [1]. Its use also requires the ascertainment of age, an important drawback under difficult field conditions.
5.2.3
The International Reference Population
The designation of a child as having impaired growth implies some means of comparison with a “reference” child of the same age and sex. Thus, in practical terms, anthropometric values need to be compared across individuals or populations in relation to an acceptable set of reference values. This need has made the choice of a growth reference population an important issue that has received considerable attention in the last decades. The international reference growth curves, the so-called National Center for Health Statistics (NCHS)/WHO international reference population, were formulated in the 1970s by combining growth data from two distinct data sets. All samples consisted of healthy, well-nourished US children as the curves were originally planned to serve as a
Chapter 5 / Child Growth and Development
119
reference for the United States. A detailed account of the historical background of the NCHS/WHO growth charts can be found elsewhere [23]. WHO adopted the reference curves of the NCHS for international use in the late 1970s based on the then-growing evidence that the growth patterns of well-fed, healthy preschool children from diverse ethnic backgrounds are very similar [23]. The adoption by WHO of the NCHS-based growth curves resulted in their wide international dissemination. Throughout the 1980s, several microcomputer-based software versions of the NCHS/WHO international growth reference were developed and supported by the Centers for Disease Control and Prevention (CDC) and WHO. These software-based references have contributed to the wide acceptance of the concept of the international growth reference because they simplified the handling of anthropometric data from surveys, surveillance, and clinical studies. Although the NCHS/WHO international growth curves have served many useful purposes throughout these years, because of a number of serious drawbacks, the suitability of these curves for international purposes was challenged in the mid-1990s [1, 24]. Work conducted by WHO demonstrated that the NCHS/WHO international reference is sufficiently flawed that it interferes with the sound health and nutritional management of infants and young children. These flaws arise from both technical and biological considerations. In particular, the current international reference may lead to the early introduction of complementary foods in exclusively breast-fed infants, which often has adverse consequences for the health and nutritional well-being of infants [25, 26]. As a result, WHO began planning in 1994 for new references that reflect how children should grow in all countries rather than merely describing how they grew at a particular time and place [27, 28]. The WHO Multicentre Growth Reference Study (MGRS) (1997–2003) collected primary growth data and related information from 8,440 affluent children from widely differing ethnic backgrounds and cultural settings (Brazil, Ghana, India, Norway, Oman, and United States) [29]. The MGRS combined a longitudinal study from birth to 24 months with a cross-sectional study of children aged 18 to 71 months. In the longitudinal study, mothers and newborns were screened and enrolled at birth and visited at home a total of 21 times on weeks 1, 2, 4, and 6; monthly from 2 to 12 months; and bimonthly in the second year. Data were collected on anthropometry; motor development; feeding practices; child morbidity; perinatal factors; and socioeconomic, demographic, and environmental characteristics [29]. The new WHO growth curves based on these data represent the best description of physiological growth and establish the breast-fed infant as the biological norm for growth and development.
5.2.4
Issues in the Interpretation of Growth Data
One essential consideration is the appropriate use of the reference data. The way in which a reference is interpreted and the clinical and public health decisions that will be based on it are as important as the choice of the reference. The reference should be used as a general guide for screening and monitoring and not as a fixed standard that can be applied in a rigid fashion to individuals from different ethnic, socioeconomic, and nutritional and health backgrounds. For clinical or individual-based application, reference values should be used as a screening tool to detect individuals at greater risk of health or nutritional disorders, and they should not be viewed as a self-sufficient diagnostic tool.
120
de Onis
For population-based application, the reference values should be used for comparison and monitoring purposes. In a given population, a high prevalence of anthropometric deficit will be indicative of significant health and nutritional problems. However, it is not only those individuals below the cutoff point who are at risk; the entire population is at risk, and the cutoff point should be used only to facilitate the application of the indicator [30]. There are three different systems by which a child or a group of children can be compared to the reference population: Z-scores (standard deviation [SD] scores), percentiles, and percent of median. For population-based assessment (including surveys and nutritional surveillance), the Z-score is widely recognized as the best system for analysis and presentation of anthropometric data because of its advantages compared to the other methods [1]. At the individual level, however, although there is substantial recognition that the Z-score is the most appropriate descriptor of malnutrition, health and nutrition centers (e.g., supplementary feeding programmes in refugee camps) have been in practice reluctant to adopt its use for individual assessment. A detailed description of the three systems, including a discussion of their strengths and weaknesses, can be found elsewhere [31]. In clinical applications, children are commonly classified using a cutoff value, often ≤ 2 and ≥ 2 Z-scores. The rationale for this is the statistical definition of the central 95% of a distribution as the “normal” range, which is not necessarily based on the optimal point for predicting functional outcomes. A better approach to classifying individual children would be to base the cutoffs on the relationship between growth deficits and health outcomes, such as mortality, morbidity, and child development [30]. The difficulty of this approach is that these relationships differ according to the prevalence of health and nutritional disorders, and thus it would be more advisable to develop practical methods for identifying local cutoffs that take account of local circumstances. For population-based applications, a major advantage of the Z-score system is that a group of Z-scores can be subjected to summary statistics such as the mean and SD. The mean Z-score, although less commonly used, has the advantage of describing the nutritional status of the entire population directly without resorting to a subset of individuals below a set cutoff. A mean Z-score significantly lower than zero (the expected value for the reference distribution) usually means that the entire distribution has shifted downward, suggesting that most, if not all, individuals have been affected. Using the mean Z-score as an index of severity for health and nutrition problems results in increased awareness that, if a condition is severe, an intervention is required for the entire community, not just those who are classified as “malnourished” by the cutoff criteria [30, 32]. In addition, the observed SD value of the Z-score distribution is very useful for assessing data quality [1]. Last, experience with population surveillance has contributed to emphasizing the usefulness of identifying prevalence ranges to assess the severity of a situation as the basis for making public health decisions. For example, when 10% of a population is below the −2 SD cutoff for weight-for-height, is that too much, too little, or average? The intention of the so-called trigger levels is to assist in answering this question by giving some kind of guideline for the purpose of establishing levels of public health importance of a situation. Such classifications are very helpful for summarizing prevalence data and can be used for targeting purposes when establishing intervention priorities. It is
Chapter 5 / Child Growth and Development
121
Table 5.1 Classification for assessing severity of growth deficits by prevalence ranges among children under 5 years of age Severity of growth deficits by prevalence ranges (%) Indicator Low Medium High Very high Stunting 26 [69] >24 (F)
>18 >18 15–49 15–49 25–69 30–59 30–59 25–58 25–58 25–58 25–58 20–49 20–49
26.6 18
47.4 33.9 31.9 33.2 78.6 71.4 79.6 96.9 87.8 92.2 66.2 39.1 77.9
37.8 25.9
>30 NCHS OB NCHS OVE ≥25 ≥25 >30
>20 15–74 15–74 20–49 20–49 > 25 yr
80.2 44.6 59.1 63.8 45.9 83.8 37.1 10 47.6
26.3 6.8 12.9
32.7
29.4 10.1 25.1 69.9 46.6 59.8
79.4 59.0 72.7 83.5 70.8 88.2 52.2
27.9 9.0 21.0
49.7
Doak and Popkin
American Samoa [48]
1993 1993 1987/1988 1987/1988 1994 1992–1994 1992–1994 1994
Obesity criteria (BMI) Age group
Kuwait [74] Morocco [75] Morocco [6] Morocco [75] Saudi Arabia [76] Senegal [6] Tunisia [58] Turkey [6] Sub-Saharan Africa Benin [6] Burkina Faso [6] Cameroon [6] Central African Republic [6] C’ote d’Ivoire [6] Congo [58]
1997 1997 1993–1994 1993–1994 1984–1985 1984–1985 1992 1992 1984–1985 1984–1985 1996 1996 1998 1998 1990 1990 1998 1998
2,798 (U) 775 (R) 3,435 3,435 41,921 41,921 1,615 (U) 1,596 (R) 41,921 41,921 13,177 13,177 1,386 (U) 1,779 (R) 8,611 8,611 1,087 (U) 2,123 (R)
≥25 ≥25 >30 >25–30 >30 25–29.99 ≥25 ≥25 >30 25–29.99 >30 25–30 ≥25 ≥25 >30 25 ≥25 ≥25
20–49 20–49 18 18 Adults Adults 20–49 20–49 Adults Adults 15–95 15–95 20–49 20–49 Adults Adults 20–49 20–49
1996 1996 1992 1992 1998 1998 1994 1994 1994 1994 1986/1987
1,000 (U) 1,603 (R) 543 (U) 3,079 (R) 717 (U) 886 (R) 926 (U) 1,443 (R) 1,256 (U) 1,757 (R) 2,295
≥25 ≥25 ≥25 ≥25 ≥25 ≥25 ≥25 ≥25 ≥25 ≥25 25
20–49 20–49 20–49 20–49 20–49 20–49 20–49 20–49 20–49 20–49 >18
32.3 35.2 – –
– – 16.0 29.0
2.4 20.0
–
69.9 46.6 40.6 32.3 – – 50.3 27.9 – – 24.0 27.0 33.0 11.0 8.3 32.7 63.2 65.6 18.4 10.5 21.3 5.4 36.7 19.5 12.3 5.6 30.7 8.4 15.2
36.4 33.8 5.2 18.7
5.2 18.7 19.8 28.0
5.3 26.3
Chapter 21 / Obesity in Developing Countries
Jordan [6]
– 623
(continued)
624
Table 21.1 (continued) Obesity patterns in adults in lower- and middle-income countries: studies with large sample size Percent obese Country Congo [77] Ghana [6] Kenya [6] Madagascar [6] Malawi [6] Mali [58] Mali [6] Namibia [6] Niger [6] Nigeria [6]
South Africa [79] South Africa [6]
1990 1998 1998
Sample (n) 2,295 3,004 (U) 1,344(R) 773 (U) 1,448 (R) 869 (U) 2,499 (R) 681 (U) 1,898 (R) 361 (U) 2,393 (R) 4,868 4,868 1,353 (U) 1,401 (R) 725 (U) 1,810 (R) 630 (U) 2,834 (R) 885 (U) 1349 (R) 7,187 7,187 986 (Bl) 2,293 (U) 2,066 (R)
Obesity criteria (BMI) >30 >25 >25 ≥25 ≥25 ≥25 ≥25 ≥25 ≥25 ≥25 ≥25 25 >30 ≥25 ≥25 ≥25 ≥25 ≥25 ≥25 ≥25 ≥25 >30 25–30 [69] 24–30 (F) 30 ≥25 ≥25
Age group >18 18 18 20–49 20–49 20–49 20–49 20–49 20–49 20–49 20–49 Adults Adults 20–49 20–49 20–49 20–49 20–49 20–49 20–49 20–49 15–64 15–64 15–64 20–49 20–49
Males – – –
– –
14.7 41.9 7.9
Females 3.4 – – 32.2 12.2 27.9 15.3 10.3 3.6 27.0 10.5 – – 21.6 6.1 41.1 15.2 31.6 4.5 23.9 23.4 18.0 38.8
Total – 23.6 4.1
44.4 61.0 55.8
28.0
7.2 0.8
16.5 40.3
Doak and Popkin
South Africa [78]
Year 1986/1987 1991 1992 1998 1998 1998 1998 1997 1997 1992 1992 1991 1991 1996 1996 1992 1992 1998 1998 1992 1992 1979 1979
Mauritius [32] Uganda [6] Zambia [6] Zimbabwe [6]
1996 1996 1992 1992 1995 1995 1996 1996 1994 1994
1,064 (U) 2,891 (R) 5,111 5,111 423 (U) 2,961 (R) 1,600 (U) 2,482 (R) 619 (U) 1,329 (R)
≥25 ≥25 >30 >25 ≥25 ≥25 ≥25 ≥25 ≥25 ≥25
20–49 20–49 25–74 25–74 20–49 20–49 20–49 20–49 20–49 20–49
5.3 35.7
28.5 11.4 15.1 47.7 23.3 9.4 25.9 11.5 36.8 23.7
10.6 42.2
Bl black, NCHS National Center for Health Statistics, R rural, U urban, F female, NCHS OB obesity based on NCHS criteria, NCHS OVE overweight based on NCHS criteria.
Chapter 21 / Obesity in Developing Countries
Tanzania [6]
625
626
Doak and Popkin
Fig. 21.1. Obesity patterns in Latin America.
Fig. 21.2. Obesity patterns in Asia.
21.3.1.3 Western Pacific The island nations such as Samoa and Nauru, Fiji, and Melanesia have been the subject of many studies. The interest in this region is due to unusually high rates of obesity in the population as well as high rates of chronic disease. In some countries, over half the population had grade II or above obesity (Fig. 21.3). In most countries, obesity was much greater for females than it is for males. 21.3.1.4 Middle East The limited data for the oil-exporting countries such as Kuwait and Saudi Arabia indicate over a third of the adult population is overweight or obese (data not shown for overweight prevalence) (Fig. 21.4). In the North African countries, the situation reflects an emerging problem, with considerable grade I overweight and less grade II and above. Again, female obesity was higher in all countries where data were available for both genders.
Chapter 21 / Obesity in Developing Countries
627
Fig. 21.3. Obesity patterns in Western and South Pacific.
Fig. 21.4. Obesity patterns in North Africa and the Middle East.
21.3.1.5 Sub-Saharan Africa Aside from Mauritius, there are no nationally representative surveys in sub-Saharan Africa. Data for adult women only are available for many countries and are based on the Demographic Health Surveys [6]. The scattered data from South Africa, Mali, and the Congo indicate high levels of obesity in urban sub-Saharan Africa (Fig. 21.5). Data are available from rural areas from the Demographic Health Surveys, showing that in much of rural Africa, overweight in women is still minimal. Exceptions are Nigeria, Zimbabwe, and South Africa, with greater than 20% overweight in rural areas in Nigeria and Zimbabwe and as high as 55% in South Africa. These results confirm previous studies on Africans, particularly women, indicating high levels of obesity in rural as well as urban areas [23].
21.3.2
Obesity Trends in Lower- and Middle-Income Countries
We have excellent data on trends in body composition for a small number of lowerand middle-income countries. Where we have data (Brazil in Latin America; China,
628
Doak and Popkin
Fig. 21.5. Obesity patterns in sub-Saharan Africa. Table 21.2 Obesity trends among adults in lower- and middle-income countries
Country South America Brazil [14]
Brazil [80]
Brazil [80] Brazil [24] Mexico [21] Mexico [21] Mexico [21]
South Pacific Nauru [37] Nauru [37] Rural Western Samoa [37] Urban Western Samoa [37]
Year
Sample (n)
Obesity criteria (BMI)
Males
1975 1989 2003 1974/1975 1989 1996 1974/1975 1989 1974 1989 1988 1995 1996 1988 1995 1996
88,625 13,350 59,204 94,699 23,544 3,179 94,699 23,544 94,699 23,544 19,022 2,042 (U) 203 (R) 19,022 2,042 (U) 203 (R)
≥25 ≥25 ≥25 25 25 25 25–29.99 25–29.99 >30 >30 25–30
15.7 25.7 38.2 19.6 31.1 – 16.8 24.9 3.1 5.9 – 39.0 20.0 – 11.0 4.0
24,0 39,5 38,1 27.2 50.8 35.8 20.1 37.6 8.2 13.3 10 35.0 26.0 15.0 23.0 19.0
20.0 31.8 38.1 23.5 38.9 – 18.5 29.9 5.7 9.6 – – – – – –
1975/1976 1982 1987 1994 1978 1991 1978 1991
– – – 1,344 745 960 744 769
>30 >30 >30 >30 >30 >30 >30 >30
63.2 70.7 67.2 80.2 18.7 34.8 38.2 48.4
72.4 75.8 69.8 78.6 37.9 52.1 60.3 72.1
– – – 79.4 29.7 44.1 50.0 61.9
Percent obese Females Total
(continued)
Chapter 21 / Obesity in Developing Countries
629
Table 21.2 (continued) Obesity trends among adults in lower- and middle-income countries
Country Fiji [ethnic Fijian] [65]
Fiji [ethnic Indian] [65]
American Samoa, age 25–39 [48]
American Samoa, age 40–58 [48]
Western Samoa, age 25–39 [48, 81]
Western Samoa, age 40–58 [48, 81]
Asia China [14] China [29] Urban China [30]
Rural China [30]
China
Year
Sample (n)
Obesity criteria (BMI)
Percent obese Males Females Total
≥26 ≥25 ≥27 ≥25 ≥26 ≥27 (≥25 M) ≥27 ≥25 >25
34.7 32 26.8 – 3.6 11
57.8 64 47.4 64.4 22.1 38
46.7 49 37.8 46.9 14.4 26
9 18 98.4
– 33.9 94.4
21.4 25.9
1994 1990 1994 1990
>25 >30 >30 >25
100 76.6 80.3 97.9
95.7 78.7 86.1 95.7
1994 1990 1994 1991
>25 >30 >30 >25
97.5 80.2 81 88
97.8 85.8 90 87.3
1995 1991 1995 1991
>25 >30 >30 >25
84.9 32.9 33.3 83.9
89 54.9 55.1 93.6
1995 1991 1995
>25 >30 >30
82.5 45.8 41.7
95.8 70 78.2
≥25 ≥25 25 25 >25 >25 >25 >25 >25 >25 25–30 25–30 25–30 >30 >30 >30
10.3 22.1 – – – – – – – – 5.9 9.5 8.3 0.3 0.5 0.7
1958–1970 1,947 1980 1993 1993 1958–1970 485 1980 1,288 1993 1993 1990
1991 2000 1982 1989 1982 1989 1992 1982 1989 1992 1989 1991 1993 1989 1991 1993
1,226 1,226
8,680 9,570 6,459 4,965 5,510 1,606 8,477 7,814 3,556 20,911 5,056 5,353 4,920 5,056 5,353 4,920
15,2 24,6 – – – – – – – – 10.3 11.4 11.3 0.6 0.8 0.7
12.9 23.4 6.0 8.9 9.7 12.0 14.9 6.1 7.5 8.4 8.2 9.5 9.9 0.5 0.7 0.7 (continued)
630
Doak and Popkin
Table 21.2 (continued) Obesity trends among adults in lower- and middle-income countries
Country
Year
India [61]
1975–1979 1988–1990 1994 1993 2000 1992 1997 2002
Indonesia [14] Vietnam [14]
Africa Mauritius [32]
Europe Russia
Sample (n)
Obesity criteria (BMI)
Males
6,428 13,422 1,832 13,827 22,725 6,545 16,270 92,484
>25 >25 >25 ≥25 ≥25 ≥25 ≥25 ≥25
Percent obese Females
Total
– – – 7.9 11.4 1.0 2.9 4.3
3.4 4.1 6.6 15.3 22.1 2.2 5.4 6.5
– – – 12.0 17.0 1.6 4.3 5.5
1987 1992 1987 1992
5,021 5,111 5,021 5,111
30
22.7 30.4 3.4 5.3
27.5 32.6 10.4 15.1
25.2 31.6 7.1 10.6
*9/1992 2/1993 8/1993 11/1993 12/1994 10/1995 10/1996 9/1992 2/1993 8/1993 11/1993 12/1994 10/1995 10/1996 2004
7,305 9,058 9,238 8,278 6,967 6,528 6,231 7,305 9,058 9,238 8,278 6,967 6,528 6,231 7,077
30–45 30–45 30–45 30–45 30–45 30–45 30–45 25–30 25–30 25–30 25–30 25–30 25–30 25–30 ≥25
8.4 9.7 9.2 10.0 9.5 9.3 10.8 33.5 34.4 34.1 34.4 35.4 31.8 33.4 47.4
23.2 25.8 25.7 25.7 26.6 27.2 27.9 33.1 32.5 32.6 32.2 31.6 31.4 30.5 58.4
– – – – – – – – – – – – – – 53.4
R rural, U urban, M male, *month/year.
Indonesia, and Vietnam in Asia; Mauritius in Africa; Nauru and Western Samoa in the South Pacific; and Russia), we find significant increases in obesity occurring (see Table 21.2 and Fig. 21.6). In Fig. 21.6, we have, for the purpose of comparison, converted all the trends into a rate representing annual percentage point increase. 21.3.2.1 Brazil Elsewhere, we presented in detail the trends in Brazil [24, 25]. The proportion of obesity among adult males almost doubled (3.1% to 5.9%) between 1974 and 1989 for BMI above 30 [24]. A study of trends documenting trends in overweight (BMI ≥ 25)
Chapter 21 / Obesity in Developing Countries
631
Fig. 21.6. Obesity trends: the percentage increase in obesity prevalence per 10-year period.
from 1975 to 2003 showed a greater rate of increase in the period from 1975 to 1989 compared to the later period (1989 to 2003). The annual rate of increase in the earlier period was nearly twice that of the later period, 0.84% per annual increase compared to 0.45% per annual increase [14]. These trends are consistent with earlier reports. 21.3.2.2 China The shifts in diet, physical activity, and overweight status in China are among the most rapid ever documented. Elsewhere, we showed that among school-aged children, Chinese obesity rates are rapidly reaching levels comparable with the United States, although this is not so for adults [26]. These changes are much greater among urban residents of all income backgrounds and greater still among middle- and higher-income rural residents [27–29]. In China, we have found that, although obesity prevalence is lower among the lowest-income tertile, the rate of increase among this group is the greatest. When one looks at education of women, one finds already for China that lesseducated women are more overweight than women with more education [11]. The rates of obesity based on national nutrition surveys in China in 1982–1992 indicate a moderate increase; however, this obscures more rapid shifts in diet, activity, and obesity seen in the last few years [30, 31]. During the more recent period, the data in Table 21.2 show a consistent increase in obesity in urban and rural areas among adults. The increase in the prevalence of BMI of 25 or above doubled for men and nearly doubled for women between 1991and 2000. 21.3.2.3 Indonesia Data for Indonesia are based on the Indonesia Family Life Surveys (IFLS) from 1993 and 2000. The IFLS was a longitudinal survey conducted in 1993–1994 in 321 communities and 13 provinces by the Rand Corporation in collaboration with Lembaga Demografi, University of Indonesia. The survey included 7,162 households and is representative of 83% of the population. In 2000, the rate of contact from the baseline sample was 95%. The prevalence for grade I obesity and above was 12.0% overall in 1993 and 17.0% in 2000; in both surveys, the prevalence was higher for women than for men.
632
Doak and Popkin
21.3.2.4 Vietnam The trends data for Vietnam are based on the Vietnamese Living Standards Surveys (VLSS) conducted in 1992–1993 and 1997–1998. The surveys were nationally representative of urban and rural populations (General Statistical Office [GSO], 1994 [82]) and were conducted by the GSO. Both of the VLSS were multipurpose surveys that collected weight and height data. A third survey, conducted in 2002, was designed by the Ministry of Health and collected by the GSO in a manner similar to the VLSS. Vietnam showed among the lowest prevalences of grade I obesity and above in all survey years, with 1.6% prevalence in 1992 and 5.5% in 2002. 21.3.2.5 Kuwait Both grade I and grade II obesity rose rapidly in Kuwait. In 1980–1981, the prevalence of grade I and above was over 50% for females and nearly as high for males. This prevalence of overweight rose to approximately 70% for both males and females by 1994, a rate of 14.5 percentage points per decade. Grade II obesity increased by a total of 12.8%, representing a per-decade percentage point increase of 9.8%. 21.3.2.6 Mauritius The small island republic of Mauritius has a very high prevalence of adult-onset diabetes [32]. Among males and females, a rapid increase in obesity is occurring. In particular, the increase in female grade II and above obesity was higher than that found in many high-income countries. During a 5-year period (1987–1992), there were marked increases in grades I and II obesity. It is important to note that this increase in obesity occurred despite the existence of a national health promotion campaign that successfully used the mass media, price policy, other legislative and fiscal measures, and widespread education activity in the community, workplace, and schools to change many behaviors related to coronary heart disease (CHD) and hypertension. The results were remarkable: Hypertension was reduced considerably, cigarette smoking in men and women declined, heavy alcohol use declined, mean serum cholesterol decreased, and there was increased activity [33, 34]. Of course, it is quite possible that the reduction in the extent and amount of smoking is linked partially with this weight increase [35]. However, it is also possible that the rate of increase in obesity would have been much higher without the national health promotion campaign. 21.3.2.7 Russia Russia has one of the highest rates of mortality related to CHD in the world. Despite marked shifts toward a lower-fat diet in the postreform period, during which price subsidies of meat and dairy products were removed, there is evidence of an increase in adult obesity. We have collected data for seven rounds of the nationally representative RLMS and found a consistent increase in adult and elderly obesity [36]. The remarkable point to note is that the effects of the economic reform-induced dietary changes have not been linked with meaningful changes in obesity patterns. Prevalence of grade I overweight among females showed a consistent decline between 1992 and 1996, while males showed virtually no difference between the first and last rounds of the survey. The survey showed an overall increase in grade II obesity for males and females and an increase in total obesity of over 5 percentage points per 10-year period for Russia.
Chapter 21 / Obesity in Developing Countries
633
Despite the overall increase in obesity, year-to-year fluctuations underscore the fact that the economy is in flux, and that these changes cannot be used to predict future directions of this trend. However, based on the survey from 2004, over 50% of the adult population had grade I obesity and above. 21.3.2.8 Western Pacific A large body of literature documents the high rates of obesity, in particular grade III and above overweight status, in populations residing in the Western Pacific Islands. Modernization has been associated with a very high prevalence of obesity in the West and South Pacific islands, particularly among urban residents [37–39]. In those islands (e.g., Fiji, Kiribati, Nauru, American and Western Samoa, Vanuatu), high rates of severe obesity are seen that mirror the rates found among Native American groups in the United States [40]. The trends reported in these studies of Hodge and colleagues indicate not only that obesity levels were high but also that the prevalence of obesity continued to increase considerably in each island. In Nauru and Western Samoa, the levels of grades I and II obesity were among the highest found and were still increasing steadily.
21.4
IMPLICATIONS FOR PUBLIC HEALTH
The obesity epidemic is linked with rapid shifts in adult-onset diabetes and many other noncommunicable diseases [41]. Adult-onset diabetes and many other comorbidities of obesity are increasing rapidly in many lower-income countries [42, 43]. The most relevant comorbidities are hypertension, dyslipidemia, and atherosclerosis. The epidemiological prevalence data are spotty but indicate serious and high levels of these conditions, in particular adult-onset diabetes. A study from 1997 provided a strong basis for linking diet, activity, and body composition trends discussed in this chapter to increased rates of prevalence for a larger number of cancers [44]. A clear literature has shown that in terms of mechanisms and epidemiology, obesity and activity are closely linked to adult-onset diabetes. Several reviews made the case for these factors. Zimmet and his colleagues [32, 33, 42, 45, 46] have been particularly earnest in exploring these issues at the population level in lower-income and transitional societies. Some basic characteristics of adult-onset diabetes may provide a clear basis for linking key components of the nutrition transition—increases in obesity and reductions in activity—to the rapid increases in adult-onset diabetes in lower-income countries.
21.4.1
Obesity
It is clear that obesity and, more particularly, the upper-body regional distribution of body fat, is a key parameter in the etiology of adult-onset diabetes. A vast literature has shown significant direct obesity relationships with adult-onset diabetes, and animal studies support this relationship. The work on abdominal obesity and its effects is more recent but appears to be promising in explaining more precisely the role that body composition plays. In addition, there is a strong relationship between weight gain and risk of developing diabetes. The odds of getting diabetes are considerable with a weight gain of 5–8 kg for adults, and the strength of association is even higher as weight gain increases [47].
634
21.4.2
Doak and Popkin
Physical Activity
It is understood that exercise may help to prevent adult-onset diabetes in an obese patient. Exercise may offset the hyperinsulinemia that is associated with obesity and reduces the likelihood that a person will display the signs that allow him or her to be categorized as having adult-onset diabetes, after controlling for a given level of obesity. Because exercise is associated with lower insulin levels, it may help to offset (or prevent) the hyperinsulinemia that is common among obese persons and consequentially the development of insulin resistance. Zimmet and coworkers [42, 46] reviewed these relationships and noted other critical studies on this topic.
21.4.3
Interactions of Obesity and Activity
Physical activity and obesity have independent effects on serum insulin, but together they interact such that the impact of physical activity differs according to the level of obesity. For example studies showed that for each level of BMI or waist–hip ratio, there is a different effect of physical activity on serum insulin level.
21.4.4
Genetic Component
Zimmet and others who have focused on this issue as it relates to lower-income countries have felt that the highest genetic susceptibility for adult-onset diabetes was for Pacific Islanders, American Indians, Mexican Americans and other Hispanics, and Asian Indians. Those with modest genetic susceptibility include Africans, Japanese, and Chinese. McGarvey and colleagues [48, 49] and O’Dea and colleagues [50] also have thoroughly explored the same issues among Australian Aborigines and other South Pacific groups and have provided careful documentation of this linkage of the nutrition transition with adult-onset diabetes.
21.5
RESEARCH AND POLICY IMPLICATIONS
It is clear that the nutrition transition as noted elsewhere in this volume is closely linked with rapid increases in obesity. It is also clear that there is great potential for serious adverse public health consequences from the nutrition transition and the resultant large increase in obesity. These trends in obesity are not limited to one region, country, or racial/ethnic grouping. The overall levels that we find in selected countries such as Mexico, Brazil, Egypt, South Africa, China, Malaysia, and most nations from both the Middle East and the Western Pacific are indicative of major public health problems. That these changes appear to be occurring across so many countries underscores the urgent need to better understand the underlying environmental causes. Focusing attention solely on genetic causes of obesity will not help to resolve, slow, or reverse the current, global, epidemic of obesity and chronic disease. International studies can help to better understand the cultural, environmental, and behavioral determinants that contribute to the universal trends toward rising overweight and obesity. Clearly, excess body fat develops when dietary energy intake exceeds energy expenditure. Excess energy intake and insufficient physical activity are major direct determinants of energy imbalance. Diet and activity patterns have shifted in comparable ways in many countries, and as such, diet and activity may contribute to the obesity epidemic in a similar way across all populations. Other contributors, such as metabolic
Chapter 21 / Obesity in Developing Countries
635
differences, inactivity, and macronutrient composition such as percentage energy from fat, are unknown [51]. Clearly, diet and activity do contribute to overweight and obesity as shown by longitudinal studies in lower-income countries [18, 52–54]. Although there will be large differences in the underlying socioeconomic and behavioral factors related to obesity in each country, the policies and programs that alter these patterns may be best understood by examining settings around the world. At present, there are few examples of lower-income countries that have developed national programs and policies focused on the rapid increases in obesity and the related changes in the structure of diet and activity. There are discussions under way in several countries and smaller-scale interventions in many countries. Mauritius and Singapore are unique in following a systematic national approach. The small island republic in the Indian Ocean of Mauritius found such a high level of cardiovascular disease as part of an adult health survey conducted in 1987 that it launched a broad comprehensive health promotion program, described in this chapter. This program used the mass media, price policy, other legislative and fiscal measures, and widespread education activity in the community, workplace, and schools. The results were remarkable in terms of health effects, but overall there was no decrease in obesity [33, 34]. If diet changed in a positive manner and activity increased, there must have been some decline in the rate of increase of obesity. Singapore has also developed a national program in the schools to address child obesity. The results have not been written up, but the unpublished information suggests a very effective intervention was developed. The challenge we face in lower-income countries is in determining how to arrest this rapid increase in obesity before the health system is overwhelmed with obesity-related problems. Effective prevention requires that obesity and chronic disease appear on the national agenda in the earliest stages. Evidence shows that obesity occurs in adults before it occurs in children, and that obesity occurs first in women compared to men. Thus, in the context of economic growth, it is important to have monitoring systems in place. To the extent that monitoring is not possible, low- and middle-income countries should emphasize economic growth in the context of ensuring a healthy food supply and an active lifestyle. While no countries have been able to reverse existing trends, there are examples of countries such as South Korea [55, 56] that have experienced a less-severe epidemic in obesity due to government programs promoting healthful, traditional, foods. Acknowledgments Preparation of this chapter was supported in part by grants from the US National Institutes of Health (R01-HD30880). We thank the following staff of the Carolina Population Center, University of North Carolina at Chapel Hill: Tom Swasey for his work on the graphics and Frances Dancy for administrative assistance.
REFERENCES 1. Omran AR. The epidemiologic transition. A theory of the epidemiology of population change. Milbank Mem Fund Q 1971;49(4):509–538. 2. McGuire AL, Barer JM, Montaner JS, Hogg RS. There and back again: the impact of adult HIV prevalence on national life expectancies. HIV Med 2005;6(2):57–58. 3. Popkin BM. The nutrition transition in the developing world. Dev Policy Rev 2003;21(5):581–597. 4. Popkin BM. An overview on the nutrition transition and its health implications: the Bellagio meeting. Public Health Nutr 2002;5(1A):93–103. 5. Popkin, BM. Global nutrition dynamics: the world is shifting rapidly toward a diet linked with noncommunicable diseases. Am J Clin Nutr 2006;84(2):289–298.
636
Doak and Popkin
6. Mendez MA, Monteiro CA, Popkin BM. Overweight exceeds underweight among women in most developing countries. Am J Clin Nutr 2005;81(3):714–721. 7. Popkin BM, Lu B, Zhai F. Understanding the nutrition transition: measuring rapid dietary changes in transitional countries. Public Health Nutr 2002;5(6A):947–953. 8. Popkin BM, Doak CM. The obesity epidemic is a worldwide phenomenon. Nutr Rev 1998;56(4 pt 1): 106–114. 9. Popkin BM, Gordon-Larsen P. The nutrition transition: worldwide obesity dynamics and their determinants. Int J Obes Relat Metab Disord 2004;28(suppl 3):S2–S9. 10. Mendez MA, Popkin B. Globalization, urbanization and nutritional change in the developing world. Electronic J Agr Dev Econ 2005;1:220–241. 11. Monteiro CA, Conde WL, Lu B, Popkin BM. Obesity and inequities in health in the developing world. Int J Obes Relat Metab Disord 2004;28(9):1181–1186. 12. Monteiro CA, Moura EC, Conde WL, Popkin BM. Socioeconomic status and obesity in adult populations of developing countries: a review. Bull World Health Organ 2004;82(12):940–946. 13. Steyn K, Bourne L, Jooste P, Fourie JM, Rossouw K, Lombard C. Anthropometric profile of a black population of the Cape Peninsula in South Africa. East Afr Med J 1998;75(1):35–40. 14. Popkin BM, Conde W, Hou N, Monteiro C. Why the lag globally in obesity trends for children as compared to adults? Unpublished manuscript, 2005. 15. Doak CM, Adair LS, Bentley M, Monteiro C, Popkin BM. The dual burden household and the nutrition transition paradox. Int J Obes Relat Metab Disord 2005;29(1):129–136. 16. Garrett JL, Ruel MT. Stunted child-overweight mother pairs: prevalence and association with economic development and urbanization. Food Nutr Bull 2005;26(2):209–221. 17. Du S, Lu B, Zhai F, Popkin BM. A new stage of the nutrition transition in China. Public Health Nutr 2002;5(1A):169–174. 18. Jahns L, Baturin A, Popkin BM. Obesity, diet, and poverty: trends in the Russian transition to market economy. Eur J Clin Nutr 2003;57(10):1295–1302. 19. Adair LS, Popkin BM. Are child eating patterns being transformed globally? Obes Res 2005;13:1281–1299. 20. WHO Expert Committee on Physical Status. Physical Status: The use and interpretation of anthropometry. Geneva: World Health Organization, 1995. Report No.: 854. 21. Rivera JA, Barquera S, Campirano F, Campos I, Safdie M, Tovar V. Epidemiological and nutritional transition in Mexico: rapid increase of non-communicable chronic diseases and obesity. Public Health Nutr 2002;5(1A):113–122. 22. Forrester T, Wilks R, Bennet F, McFarlane-Anderson N, McGee D. Obesity in the Caribbean. In: The origins and consequences of obesity. Chadwick DJ, Cardew G, eds. Chichester, UK: Wiley, 1996. 23. Bourne LT, Lambert EV, Steyn K. Where does the black population of South Africa stand on the nutrition transition? Public Health Nutr 2002;5(1A):157–162. 24. Monteiro CA, Mondini L, de Souza AL, Popkin BM. The nutrition transition in Brazil. Eur J Clin Nutr 1995;49(2):105–113. 25. Monteiro CA, Conde WL, Popkin BM. Is obesity replacing or adding to undernutrition? Evidence from different social classes in Brazil. Public Health Nutr 2002;5(1A):105–112. 26. Popkin BM, Richards MK, Montiero CA. Stunting is associated with overweight in children of four nations that are undergoing the nutrition transition. J Nutr 1996;126(12):3009–3016. 27. Popkin BM, Paeratakul S, Zhai F, Ge K. A review of dietary and environmental correlates of obesity with emphasis on developing countries. Obes Res 1995;3(suppl 2):145s–153s. 28. Popkin BM, Paeratakul S, Zhai F, Ge K. Dietary and environmental correlates of obesity in a population study in China. Obes Res 1995;3(suppl 2):135s–143s. 29. Popkin BM, Paeratakul S, Ge K, Zhai F. Body weight patterns among the Chinese: results from the 1989 and 1991 China Health and Nutrition Surveys. Am J Public Health 1995;85(5):690–694. 30. Ge K, Zhai F, Yan H. The dietary and nutritional status of Chinese population: 1992 National Nutrition Survey. Vol. 1. Beijing: People’s Medical Publishing House, 1996. 31. Ge K, Weisell R, Guo X, et al. The body mass index of Chinese adults in the 1980s. Eur J Clin Nutr 1994;48(suppl 3):S148–S154. 32. Hodge AM, Dowse GK, Gareeboo H, Tuomilehto J, Alberti KG, Zimmet PZ. Incidence, increasing prevalence, and predictors of change in obesity and fat distribution over 5 years in the rapidly developing population of Mauritius. Int J Obes Relat Metab Disord 1996;20(2):137–146.
Chapter 21 / Obesity in Developing Countries
637
33. Dowse GK, Gareeboo H, Alberti KG, et al. Changes in population cholesterol concentrations and other cardiovascular risk factor levels after 5 years of the non-communicable disease intervention programme in Mauritius. Mauritius Non-communicable Disease Study Group. BMJ 1995;311(7015):1255–1259. 34. Uusitalo U, Feskens EJ, Tuomilehto J, et al. Fall in total cholesterol concentration over 5 years in association with changes in fatty acid composition of cooking oil in Mauritius: cross sectional survey. BMJ 1996;313(7064):1044–1046. 35. Flegal KM, Troiano RP, Pamuk ER, Kuczmarski RJ, Campbell SM. The influence of smoking cessation on the prevalence of overweight in the United States. N Engl J Med 1995;333(18):1165–1170. 36. Popkin BM, Zohoori N, Baturin A. The nutritional status of the elderly in Russia, 1992 through 1994. Am J Public Health 1996;86(3):355–360. 37. Hodge AM, Dowse GK, Toelupe P, Collins VR, Imo T, Zimmet PZ. Dramatic increase in the prevalence of obesity in western Samoa over the 13 year period 1978–1991. Int J Obes Relat Metab Disord 1994;18(6):419–428. 38. Hodge AM, Dowse GK, Zimmet PZ, Collins VR. Prevalence and secular trends in obesity in Pacific and Indian Ocean island populations. Obes Res 1995;3(suppl 2):77s–87s. 39. Taylor R, Badcock J, King H, et al. Dietary intake, exercise, obesity and noncommunicable disease in rural and urban populations of three Pacific Island countries. J Am Coll Nutr 1992;11(3):283–293. 40. Brown PJ, Konner M. An anthropological perspective on obesity. Ann N Y Acad Sci 1987;499:29–46. 41. Beaglehole R, Yach D. Globalisation and the prevention and control of non-communicable disease: the neglected chronic diseases of adults. Lancet 2003;362(9387):903–908. 42. Zimmet PZ, McCarty DJ, de Courten MP. The global epidemiology of non-insulin-dependent diabetes mellitus and the metabolic syndrome. J Diabetes Complications 1997;11(2):60–68. 43. King H, Aubert RE, Herman WH. Global burden of diabetes, 1995–2025: prevalence, numerical estimates, and projections. Diabetes Care 1998;21(9):1414–1431. 44. World Cancer Research Fund. Food, nutrition and the prevention of causes: a global perspective. Washington, DC: World Cancer Research Fund in association with the American Institute for Cancer Research, 1997. 45. Hodge AM, Dowse GK, Toelupe P, Collins VR, Zimmet PZ. The association of modernization with dyslipidaemia and changes in lipid levels in the Polynesian population of Western Samoa. Int J Epidemiol 1997;26(2):297–306. 46. Zimmet PZ. Kelly West Lecture 1991. Challenges in diabetes epidemiology—from West to the rest. Diabetes Care 1992;15(2):232–252. 47. Ford ES, Williamson DF, Liu S. Weight change and diabetes incidence: findings from a national cohort of US adults. Am J Epidemiol 1997;146(3):214–222. 48. McGarvey ST, Quested C, Tufa J. Correlates and predictors of cross-sectional and longitudinal adiposity in adults from Samoa and American Samoa. Providence, RI: Department of Medicine, Brown University, 1998. 49. Parra E, Saha N, Soemantri AG, et al. Genetic variation at nine autosomal microsatellite loci in Asian and Pacific populations. Hum Biol 1999;71(5):757–779. 50. O’Dea K, Patel M, Kubisch D, Hopper J, Traianedes K. Obesity, diabetes, and hyperlipidemia in a central Australian aboriginal community with a long history of acculturation. Diabetes Care 1993;16(7):1004–1010. 51. Bray GA, Popkin BM. Dietary fat intake does affect obesity! Am J Clin Nutr 1998;68(6):1157–1173. 52. Paeratakul S, Popkin BM, Kohlmeier L, Hertz-Picciotto I, Guo X, Edwards LJ. Measurement error in dietary data: implications for the epidemiologic study of the diet–disease relationship. Eur J Clin Nutr 1998;52(10):722–727. 53. Paeratakul S, Popkin BM, Keyou G, Adair LS, Stevens J. Changes in diet and physical activity affect the body mass index of Chinese adults. Int J Obes Relat Metab Disord 1998;22(5):424–431. 54. Bell AC, Ge K, Popkin BM. Weight gain and its predictors in Chinese adults. Int J Obes Relat Metab Disord 2001;25(7):1079–1086. 55. Kim S, Moon S, Popkin BM. The nutrition transition in South Korea. Am J Clin Nutr 2000;71(1):44–53. 56. Lee MJ, Popkin BM, Kim S. The unique aspects of the nutrition transition in South Korea: the retention of healthful elements in their traditional diet. Public Health Nutr 2002;5(1A):197–203. 57. Dufour DLSL, Reina JC, Spurr GB. Anthropometry and secular changes in stature of urban Columbian women of different socioeconomic status. Am J Hum Biol 1994;6:749–760. 58. Shetty PS, James WP. Body mass index. A measure of chronic energy deficiency in adults. FAO Food Nutr Pap 1994;56:1–57.
638
Doak and Popkin
59. Berdasco A. Body mass index values in the Cuban adult population. Eur J Clin Nutr 1994;48(suppl 3): S155–S163; discussion S64. 60. Dhurandhar NV, Kulkarni PR. Prevalence of obesity in Bombay. Int J Obes Relat Metab Disord 1992;16(5):367–375. 61. Sachdev H. Nutritional status of children and women in India: recent trends. Bull Nutr Found India 1997;18(3):1–2. 62. Ismail MN, Zawaih H, Chee SS, Ng KK. Prevalence of obesity and chronic energy deficiency (CED) in adult Malaysians. Malay J Nutr 1995;1(19):1–9. 63. Solon FS. Nutrition related chronic diseases in the Philippines. Nutrition Center of the Philippines Report Series, 2(1). Makati City, Philippines: Nutrition Center of the Philippines, 1997. 64. Tanphaichitr V, Kulapongse S, Pakpeakatvatana R, Leelahagul P, Tamwiwat C, Lochaya S. Prevalence of obesity and its associated risks in Urban Thais. In: Progress in obesity research 1990. Oomura Y, Tarui S, Inoue S, Shimazu T, eds. London: Libbey; 1991:649–653. 65. Saito S. National Nutrition Survey, main report. Suva, Fiji: National Food and Nutrition Committee, Republic of Fiji, 1995. 66. Federated States of Micronesia. Department of Human Resources OoHS. Technical report prepared for the government and Department of Human Resources of the Federated States of Micronesia: The 1987/88 National Nutrition Survey of the Federated States of Micronesia. Noumea, New Caledonia: South Pacific Commission, 1989. 67. Hodge AM, Dowse G, Zimmet P. Obesity in Pacific populations. Pac Health Dialog 1996;3(1):77–86. 68. Tassie JM, Papoz L, Barny S, Simon D. Nutritional status in adults in the pluri-ethnic population of New Caledonia. The CALDIA Study Group. Int J Obes Relat Metab Disord 1997;21(1):61–66. 69. Evans T, Whitehead M, Diderichsen F, Bhuiya A, Wirth M. Challenging inequities in health: from ethics to action. New York: Oxford University Press, 2001. 70. Kingdom of Tonga National Food and Nutrition Committee. The 1986 National Nutrition Survey of the Kingdom of Tonga. New Caledonia: South Pacific Commission, 1987. 71. al-Mannai A, Dickerson JW, Morgan JB, Khalfan H. Obesity in Bahraini adults. J R Soc Health 1996;116(1):30–32, 37–40. 72. Khorshid A, Galal OM. Development of food consumption monitoring system for Egypt. National Agricultural Research Project. Final Report. Submitted to the U.S. Department of Agriculture and the Egyptian Ministry of Agriculture, 1995. 73. Ajlouni K, Jaddou H, Batieha A. Obesity in Jordan. Int J Obes Relat Metab Disord 1998;22(7):624–628. 74. al-Isa AN. Prevalence of obesity among adult Kuwaitis: a cross-sectional study. Int J Obes Relat Metab Disord 1995;19(6):431–433. 75. Kingdom of Morocco Dirreccion de la Statisque. Consommation et dispueses des menages 1984/85. Vol. 6, Situation nutritionelle de la population du Maroc. Rabat, Morocco: Ministere de Affaire Economique et Sociale, 1992. 76. al-Nuaim AR, al-Rubeaan K, al-Mazrou Y, al-Attas O, al-Daghari N, Khoja T. High prevalence of overweight and obesity in Saudi Arabia. Int J Obes Relat Metab Disord 1996;20(6):547–552. 77. Delpeuch F, Cornu A, Massamba JP, Traissac P, Maire B. Is body mass index sensitively related to socio-economic status and to economic adjustment? A case study from the Congo. Eur J Clin Nutr 1994;48(suppl 3):S141–S147. 78. Jooste PL, Steenkamp HJ, Benade AJ, Rossouw JE. Prevalence of overweight and obesity and its relation to coronary heart disease in the CORIS study. S Afr Med J 1988;74(3):101–104. 79. Steyn K, Fourie J, Rossouw JE, Langenhoven ML, Joubert G, Chalton DO. Anthropometric profile of the coloured population of the Cape Peninsula. S Afr Med J 1990;78(2):68–72. 80. Monteiro CA, MH DAB, Conde WL, Popkin BM. Shifting obesity trends in Brazil. Eur J Clin Nutr 2000;54(4):342–346. 81. Ezeamama AE, Viali S, Tuitele J, McGarvey ST. The influence of socioeconomic factors on cardiovascular disease risk factors in the context of economic development in the Samoan archipelago. Soc Sci Med 2006 Nov;63(10):2533–2545. 82. General Statistical Office (1994): Vietnam Living Standards Survey, 1992–1993. Hanoi. Statistical Publishing House.
22
Rapid Urbanization and the Challenges of Obtaining Food and Nutrition Security Marie T. Ruel, James L. Garrett, and Lawrence Haddad
22.1
INTRODUCTION
Over the period 2000–2030, the urban population of the developing world is projected to double—from 1.97 billion to 3.93 billion—whereas the rural population is projected to increase from 2.90 billion to 2.96 billion [1]. Figure 22.1 shows that 48% of the population, some 3.04 billion people, now live in urban areas (estimates from 2003). About 77% of Latin Americans live in cities and close to 40% of Africans and Asians [1]. The urban population in developing countries is expected to grow more than three times faster (2.29% annually) than the rural population (0.06% annually) between now and 2030. Over the same period, the urban population of Africa is expected to increase from 329 million to 748 million (the rural population is projected to increase from 521 to 650 million); for Asia, the urban population will increase from 1.5 billion to 2.7 billion (the rural population is projected to decline from 2.3 to 2.2 billion); and for Latin America, the corresponding numbers show an increase in the urban population from 417 million to 602 million (and a decline of the rural population from 126 to 109 million). For those who produce and use food policy research, these numbers raise several issues that we address in this chapter. First, while we can be sure that the number of people living in urban areas in the developing world will increase rapidly in the next 25–30 years, we do not know how many of them will be poor and undernourished. The absolute number of urban poor and undernourished will increase unless urban poverty incidence and undernutrition prevalence rates are reduced in direct proportion to the growth in urban populations. Second, will the absolute number of urban poor and undernourished increase more quickly than the rural number? In other words, will there be a shift of poverty and undernutrition from rural to urban areas? Third, for those living in urban areas, are the constraints to, and the opportunities for, the generation of income, food security, and improved nutrition status different from what
From: Nutrition and Health: Nutrition and Health in Developing Countries, Second Edition Edited by: R. D. Semba & M. W. Bloem © Humana Press, Totowa, NJ
639
640
Ruel, Garrett, and Haddad 100
% of the population
80
60
40
20
0 World
Developed
Less developed
Africa
1975
2000
1950
Asia
Latin America
2030
Fig. 22.1. Trends in percent of the population living in urban areas by region (1950–2030). Adapted with permission from ref. (1).
is faced in rural areas? Fourth, what do the answers to the first three questions imply for policy research and for policymaking? In this chapter, we review available information on trends in urban poverty and childhood undernutrition. We also discuss the unique characteristics of urban life, which present special challenges for the achievement of food and nutrition security. These include greater dependence on cash income and hence employment for food security and livelihood; weaker informal safety nets; greater labor force participation of women and its consequences for child care; lifestyle changes, particularly those related to changes in diet and exercise patterns; greater availability of public services such as water, electricity, sewage, and health, but questionable access by poor slum dwellers; greater exposure to environmental contamination (water, food, and air); and governance by a new, possibly nonexistent, set of property rights. The implications of these special features of urban life for programs and policies are highlighted, and research priorities are suggested.
22.2
INCREASING URBAN POVERTY AND UNDERNUTRITION
Reliable numbers on the growth of urban poverty and undernutrition and their share in national poverty and undernutrition are generally scarce. Specifically, there is a lack of readily available data to answer the questions: (1) Are the absolute numbers of poor people and underweight young children living in urban areas increasing? and (2) do they represent an increasing share of the total poor and underweight young children? The only information available is from a previous analysis that we conducted to examine these issues using data from the World Bank for poverty and from the World Health Organization (WHO) [2] for undernutrition [3]. A summary of the main findings is presented here.
Chapter 22 / Urbanization and Food and Nutrition Challenges
22.2.1
641
Poverty Data
The results of the poverty data showed that for seven of the eight countries included,1 the share of poor people in urban areas had increased over time, the exception being Indonesia. More important, the results showed that for five of eight countries (Bangladesh, China, Ghana, India, and Nigeria), both the absolute number of urban poor and the share of poor people living in urban areas had increased over time. Note that the eight countries selected account for approximately two thirds of the developing world’s people. The only country for which the share of poor people in urban areas had decreased was Indonesia, but this was the country for which the interval between the two points in time was the shortest (only 3 years). The analysis also showed that for four of the countries studied (Pakistan, Colombia, Nigeria, and Ghana), the share of poor people that lived in urban areas in the 1990s was between 25% and 37% of all poor households. These data strongly support the argument that urban poverty had increased between the 1980s and the 1990s in these large countries. Unfortunately, this type of trend analysis is not available for more recent years to our knowledge.
22.2.2
Nutrition Data
Similar results were found for the prevalence of underweight children2: The share of underweight children in urban areas increased between the late 1980s/early 1990s and the mid-1990s for 11 of 14 countries3 studied (the exceptions were Tanzania, Peru, and Zambia) [3]. Moreover, both the absolute number of underweight children in urban areas and the share of underweight children contributing to total undernutrition had increased for 9 of 14 countries. Again, this set of countries constitutes a large proportion of the developing world, given that it contains China, Bangladesh, Nigeria, Egypt, and the Philippines. Note that the share of undernourished children living in urban areas reached 30% and higher in four countries (Philippines, Peru, Mauritania, Zambia) and over 50% in Brazil. Only China, Bangladesh, and Nigeria overlapped from the poverty and underweight children data sets, and they showed the same pattern in urban poverty as they did in urban underweight. Hence, for the majority of the countries examined, we can say that between the late 1980s/early 1990s and the mid-1990s (1) the number of urban poor increased, (2) the share of the urban poor in overall poverty increased, (3) the number of underweight preschoolers in urban areas increased, and (4) the share of urban preschoolers in overall numbers of underweight preschoolers increased. Although more recent analysis 1
The countries and years of data included in the analysis were Bangladesh, 1983/1992; China 1988/1995; Colombia 1978/1992; Ghana 1987/1993; India 1977/1994; Indonesia 1990/1993; Nigeria 1985/1993; and Pakistan 1984/1991. 2 The prevalence of underweight, as opposed to stunted, children was examined because data on height-for-age were usually not available in the data sets used. We recognize, however, the limitations of underweight data, which do not allow to differentiate between stunting (low weight-for-age) and wasting (low weight-for-height). 3 The countries and years of data included in this analysis were the following: Bangladesh 1985/1996; Brazil 1989/1996; China 1992/1995; Egypt 1990/1995; Honduras 1987/1995; Madagascar 1992/1995; Malawi 1992/1995; Mauritania 1990/1996; Nigeria 1990/1993; Peru 1991/1996; Philippines 1987/1993; Uganda 1988/1995; Tanzania 1991/1996; Zambia 1992/1997.
642
Ruel, Garrett, and Haddad
of trends in poverty and undernutrition are not available, there are no reasons to believe that these trends would have been reversed since the mid-1990s.
22.3
CHALLENGES TO OBTAINING FOOD, NUTRITION, AND HEALTH SECURITY IN AN URBAN ENVIRONMENT
The premise of this section is that the causes of malnutrition and food insecurity in urban and rural areas are different due primarily to a number of phenomena that are unique to or are exacerbated by urban living and by the circumstances that brought the individual to the urban area in the first place. We briefly discuss the following phenomena (or “urban facts of life”) and the pressure they place on the attainment of household and individual food, nutrition, and health security: (1) a greater dependence on cash income for food and nonfood purchases; (2) weaker informal safety nets; (3) greater labor force participation of women and its consequences for child care; (4) lifestyle changes, particularly those related to changes in diet and exercise patterns; (5) greater availability of public services such as water, electricity, sewage, and health but questionable access by poor slum dwellers; (6) greater exposure to environmental contamination (water, food, and air); and (7) governance by a new, possibly nonexistent, set of property rights. The main focus of the discussion is on identifying what is different about urban areas, which should help frame the program and policy responses discussed in the final section.
22.3.1
The Importance of Cash, Employment, Food Prices, and Agriculture for Urban Livelihood and Food Security
22.3.1.1 Dependence on Cash for Food Compared to rural consumers, who can often produce their own food, urban consumers must depend largely on food purchases. This dependence on the market is further increased by the fact that, unlike their rural counterparts, they cannot rely on exploitation of natural resources to provide for housing, energy, and water. City dwellers in metropolitan areas of countries as diverse as Egypt, Ghana, Malawi, Mozambique, Nepal, and Peru buy more than 90% of their food [4]. Even in less-urbanized countries such as Mozambique or Nepal, residents of smaller and intermediary cities commonly buy 75% or more of their food, while rural residents purchase less than half of the food they consume. Food expenditures also usually comprise a larger percentage of total outlays for urban than rural households in the developing world. A survey of the 100 largest metropolitan areas of the world showed that food costs were greater than 50% of household expenditures in 23 cities [5]. Urban Marketing Systems, Supermarkets, and Food Price Policies Clearly, food prices and the ability to earn cash income are crucial to the achievement of food security in urban areas. The cost of food for urban consumers depends on a number of factors, including (1) the efficiency of the food production and marketing system, (2) the availability and access to food subsidies or other food programs, and (3) exchange rate policies. Urban marketing systems, especially those that serve the poor, are frequently inefficient in terms of providing adequate quantities, good quality, or competitive prices [6, 7]. 22.3.1.2
Chapter 22 / Urbanization and Food and Nutrition Challenges
643
Wholesale markets that connect producers and traders with retailers are often rundown and obsolete, with ineffective and often obstructive management. Urban retailers, particularly in poor areas, are small and scattered. In the absence of well-integrated markets, food prices are higher than what they could be and are particularly susceptible to seasonal fluctuations [8]. More and more, however, supermarket chains are displacing traditional retailers in many countries of Africa, Asia, and Latin America [9]. These may present a way to overcome the structural inefficiencies of traditional markets with new store placements and large purchasing and distribution networks. In Argentina, Brazil, Chile, Colombia, Costa Rica. and Mexico, for example, supermarkets now account for 45% to 75% of food retailing. In the remainder of Latin America, largely lower income and less urbanized, the share is 20% to 40% [10]. The supermarket sector in East and Southeast Asia is following a similar pattern as that of Latin America and is growing at an even faster pace [11]. In South Africa, supermarkets have about 50% to 60% of food retail sales and have a significant presence in Kenya. Multinational supermarket chains have expanded, at least nominally, into most other countries of southern and eastern Africa as well [12]. The impact of this rapid burgeoning of supermarkets on the consumption patterns of the urban poor in developing countries is unclear. It may take some time for supermarket chains to establish a significant presence in slums or ghettos; and poor urban dwellers may have to continue to purchase food in small amounts on a daily basis (because of lack of cash) at a small corner store that may also offer credit. Macroeconomic policies can also have a significant impact on the price of urban food. For many years, “cheap food” policies, including widespread subsidies, overvalued exchange rates, and trade restrictions, deliberately kept the price of urban food low, but structural adjustment programs have reversed many of these policies. As anticipated, the urban poor have not done well in the short run [13, 14]. Demery and Squire [13] reported that even in Ghana, a country that has shown substantial commitment to economic reform and where rural poverty has decreased, poverty in the capital city of Accra has increased. 22.3.1.3 Urban Employment The ability of the urban poor to obtain enough food for a healthy and active life depends primarily on their ability to earn income, yet most urban dwellers work in sectors such as petty trade or construction, for which wages are low and job tenure is insecure. In the 1990s, the informal sector represented 60% to 75% of urban employment in Guatemala, El Salvador, and Honduras but only one third in Costa Rica [15]. It generated 60% of female employment in many West Africa cities [16] and was one third of the urban labor force in Nigeria [17]. Once thought to be only a coping strategy or a dead end, numerous studies have now illustrated the dynamism and heterogeneity of the informal sector. Although workers tend to earn low wages, incomes of business owners in the informal sector can be 25% or more higher than those in the formal sector [18]. Formal sector jobs (government, private sector) are also important for the urban poor. Comparing data in metropolitan areas in four countries (Egypt, Ghana, Malawi, and Peru), Garrett in 2004 [19] showed that at least as many if not a larger percentage of paid urban dwellers work in the formal compared to the informal sector. In Egypt and Malawi, for example, more than 70% of jobs paid wages or salaries, and only approximately 20% were self-employed.
644
Ruel, Garrett, and Haddad
22.3.1.4 Urban Food Production Agriculture, forestry, and fishing are also important to the incomes of urban dwellers, especially outside large metropolitan areas [19]. Some households improve their access to food by growing food on their own plots inside or outside the city. Urban agriculture is practiced by as much as 40% of the population in African cities and up to 50% in Latin America [20, 21]. But, even where widely practiced it is rarely the primary source of food. For example, approximately 55% of poor urban households in periurban Dar es Salaam farm, but they only rely on production from their plots for 2 or 3 months each year [22]. Still, urban agriculture can be an important coping strategy for some households and may have an important impact on nutrition, especially among poorer households [23].
22.3.2
Stronger Formal Safety Nets and Weaker Informal Safety Nets?
An important question for this review is whether urban populations tend to have better access to formal safety nets than rural populations. Two factors that suggest that they do would be (1) the ease of reaching urban populations in contrast with the difficult logistics of reaching the rural poor and (2) the proximity and visibility of the urban poor to those in power. Our review of World Bank Poverty Assessments from sub-Saharan Africa, however, indicated only a very weak bias toward urban areas in terms of formal safety net coverage [24]. There were 88 programs in urban areas and 76 in rural areas. Removing the programs where we were not sure regarding location resulted in 36 programs in urban areas and 31 in rural areas.4 It would be useful to conduct this exercise for other regions to verify whether these findings hold elsewhere. The next question is whether urban areas have weaker informal safety nets. Again, there has been very little work on this issue. Informal safety nets take on a number of forms, such as food sharing, child fostering, loans, membership in groups, the receipt and provision of remittances, the sharing of housing, the lending of land and livestock, to name only a few. These links tend to be most extensive and strong within immediate and extended family because they rely heavily on social trust and reciprocity. Informal safety nets are mechanisms that evolve to minimize exposure to adverse shocks and to maximize the ability to cope, ex post, with shock. They are underpinned by social capital. Social capital refers to [25] “features of social organization such as networks, norms, and social trust that facilitate coordination and cooperation for mutual benefit” (p. 67). Are stocks of social capital lower in urban areas? This is an open question. Factors associated with urban life that might be expected to diminish social capital include (1) a looser definition of community and hence less identification with it; (2) a greater incidence of violence, which rapidly diminishes the trust necessary for nonfamily collective action; and (3) the nonproximity of family members from different generations, which reduces the ability to undertake activities that do not rely on immediate reciprocity. On the other hand, information flows are better, so opportunities for col-
4 Obviously, not all programs are the same size and have the same coverage. Unfortunately, expenditure figures were unavailable for most of the programs; in any case, it was not possible to verify the accuracy of these report figures.
Chapter 22 / Urbanization and Food and Nutrition Challenges
645
lective action for mutual benefit will be greater. Also, nongovernmental organizations (NGOs) and community-based organizations are often active in urban areas and can serve as important catalysts for improved social cooperation. It may also be the case that access to formal safety nets diminishes the demand for social capital formation and hence the use of informal safety nets. Haddad and Zeller [26] summarized several studies that indicated that formal safety nets have partially crowded out private informal safety nets.
22.3.3
The Increased Labor Force Participation of Women and Its Consequences for Child Care
Women’s Work Patterns and Child Care Use in Urban and Rural Areas It is thought that urban living generally implies greater female labor force participation and a more distinct separation of dwelling location and work location for both men and women. Other stylized facts suggest that the higher proportion of female-headed households and the smaller household sizes in urban areas reduce the household’s supply of alternate caregivers and result in harsher tradeoffs for women between time spent in income generation (their productive role) and time spent in their reproductive, maternal, and caring roles. Employment conditions are often not flexible enough to reduce the sharpness of these tradeoffs. We analyzed data from the Demographic Health Surveys (DHSs) from 11 countries5 (2 in Asia, 4 in Africa, and 5 in Latin America) to verify some of these facts [24]. We compared women’s patterns of employment and use of child care alternatives between rural and urban areas and looked at differences in the percentage of women-headed households. The hypothesis that urban areas host greater percentages of women-headed households was confirmed for Latin American and for two of four African countries but not for Asia. In Bangladesh and Pakistan, women-headed households represented only about 8% and 6% of households, respectively, and there are no urban/rural differences. Our second hypothesis that more women worked in urban areas, particularly away from home, was also confirmed only for Latin America (with the exception of Peru). In Asia and Africa, the percentage of women working was consistently greater in rural areas, and even the percentage of rural women working away from home was higher than that of urban women in most of the African and Asian countries studied. In terms of child care arrangements, a smaller percentage of urban mothers took their child to work with them, probably because they tend to work in the streets, in markets, or in factories rather than in agriculture like rural women do [24]. In Latin America, a greater percentage of urban mothers used relatives as alternative child caregivers compared to rural dwellers, but no consistent pattern was found in Asia and Africa. Hired help and institutional care were consistently higher in urban areas in all three regions, although institutional care use was almost nonexistent in Asia and very 22.3.3.1
5 The countries and year of survey included in this analysis were as follows: for Asia: Bangladesh 1993 and Pakistan 1991; for Africa: Ghana 1993, Tanzania 1991/1992, Senegal 1992/1993, Zambia 1992; and for Latin America: Brazil 1996, Dominical Republic 1991, Peru 1992, Colombia 1995, and Guatemala 1995.
646
Ruel, Garrett, and Haddad
uncommon in three of the four African countries studied. It is likely that such low reported use of institutional care is related to lack of availability of these services in the countries studied. In sum, the DHS data indicate that more than half of the women in both urban and rural areas of Africa and Latin America are involved in income-generating activities. The greater proportion of women working outside the home in urban areas is confirmed only for Latin American countries. In Africa, more rural women work outside the home than urban women in three of the four countries studied. The main difference between rural and urban areas is in the use of hired help and institutional care, both of which are consistently higher in urban areas. Urban mothers are also less likely than rural mothers to take their child along when they go to work. A comparative study of Accra (Ghana) and Guatemala City (Guatemala) indicated that, in both sites, women’s employment and child care choices are highly influenced by the age of their youngest child [27]. Mothers with children under 3 years of age are less likely to be working, and if they do work, they are less likely to use formal child care compared to mothers with older children. In Guatemala City, another important determinant of women’s decision to work is the presence of an adult woman (a potential alternative child caregiver) in the household. In Ghana, where most urban women work in the informal sector, those who have to resume work for economic reasons when their infant is still young usually take the infant along to their workplace [28]. Depending on the work environment, this may or may not be positive for the child, but at least it is likely to help preserve breast-feeding and caregiving, which should confer important nutritional and developmental benefits to the child. These findings confirm that women do adapt their working patterns to their specific family circumstances, and that the well-being of their children is the overriding force behind their decisions to work and to use child care alternatives. These “adaptive strategies” by which mothers stop working, work fewer hours, or even take their infant to work if they have to work may be successful in protecting their infant. They may, however, seriously jeopardize the mothers’ ability to generate income and to protect their household’s livelihood and food security, especially if they are the sole income earner. 22.3.3.2 Impact of Maternal Work on Child Care Practices The greatest threat of maternal employment to child caring is its potential negative impact on breast-feeding practices. It is generally believed that urban mothers are less likely to initiate breast-feeding and more likely to wean earlier if they do breast-feed. Our previous analysis of DHS data from 35 countries, however, did not indicate such clear patterns [29]. We found that, although the percentage of children ever breast-fed tends to be lower in urban areas, the pattern is not fully consistent, and differences are generally of small magnitude. Urban mothers were found to initiate breast-feeding at a surprisingly high rate (greater than 90%). The median duration of breast-feeding, on the other hand, was consistently shorter in urban areas, sometimes 4–6 months shorter. Exclusive and full breast-feeding duration was much shorter than the recommended 4–6 months everywhere, but there were no urban/rural differences. Earlier studies had also shown that maternal employment was not a main determinant of breast milk substitute use in developing countries [30] or systematically related to shorter breastfeeding duration [31].
Chapter 22 / Urbanization and Food and Nutrition Challenges
647
Globally, there is also little evidence that maternal employment has a negative impact on other child feeding and care practices such as complementary feeding, preventive and curative health-seeking behaviors, and psychosocial care or on children’s health and nutritional status [32–34]. Our study in Accra, Ghana, documented that child feeding, hygiene, or health-seeking behaviors were not affected by maternal employment [28]. In this context, the key factor consistently associated with better caring practices was maternal schooling, which was not related to employment status. Additional, indirect evidence that women’s employment in urban areas may not necessarily have a negative impact on child care practices again comes from global urban/rural comparisons. We showed, using a set of 36 recent DHS data sets, that complementary feeding practices (timing and frequency of feeding complementary foods) and health-seeking behaviors are substantially better in urban compared to rural areas [35]. This is true even in countries where a large proportion of women are engaged in income-generating activities, often away from home. Overall, mothers seem tremendously efficient at combining their income-generating activities and their child care responsibilities and at buffering the potentially negative impacts of their employment patterns on their children’s well-being. The question is, though, at what cost—for themselves and for their household food and livelihood security? This question remains largely unanswered because whether the food security situation of poor working women is alleviated or aggravated by their participation in the labor force largely depends on the set of resources and constraints they face.
22.3.4
Lifestyle Changes
22.3.4.1 Dietary Patterns The nutrition transition,6 which is characterized by changes from diets rich in complex carbohydrates and fiber (mainly from food staples) to more varied diets with higher proportions of saturated fat, refined sugars, and meat products as populations move from rural to urban areas, is well documented both globally and in a number of individual countries [37–41] (see also Chapter 20). The nutrition transition, however, is not simply an urban phenomenon; it is strongly associated with rapid economic growth and positive changes in household income [42, 43]. A classic study using data from 85 countries showed a positive linear relationship between gross national product (GNP) per capita and energy intake from refined sugars and from vegetable and animal fats [44]. Whereas the poorer nations derived approximately 5% of their energy from animal fat in 1962, richer countries reached 38%. A more recent similar analysis using data from 133 countries in 1990 gave an interesting twist to these findings. Drewnowski and Popkin [45] showed that the income–fat relationship has changed over time, and that total fat consumption is less strongly associated with GNP than before. Overall, richer countries have decreased their total fat intake, whereas poorer countries are now consuming diets much higher in fat than three decades ago. An independent effect of urbanization on changes in diet structure was also apparent in these data, as well as a significant interaction between GNP and urbanization, which 6
Popkin [36] defined the nutrition transition as the shifts in dietary patterns and lifestyle that have resulted from urbanization and rapid economic development.
648
Ruel, Garrett, and Haddad
indicated a greater effect of urbanization on refined sugars and total fat consumption among lower-income countries compared to richer nations. These results suggest that the accelerated rates of urbanization currently found in many developing countries are likely to generate rapid and most likely negative shifts in dietary patterns over the next few years. There are various reasons why urban diets tend to be different (and usually more diverse) than rural diets, namely, higher income, changing values and norms, and cultural diversity. Studies have also shown that the greater consumption of processed and prepared foods in urban areas is largely driven by the opportunity cost of women’s time [46–48]. Bouis and Huang [49], in an analysis of data from China and Taiwan, attributed about 20% of the increases in consumption of meat, fish, and dairy products to the nonincome or structural factors associated with moving from a rural to an urban residence. Traditional staples are also often more expensive in urban areas than in rural areas, while the opposite is true for processed foods [50], which means that it is relatively less expensive to shift away from traditional staples to processed foods in urban areas. 22.3.4.2 Activity Patterns Parallel to these changes in diet, shifts in activity patterns as populations migrate from rural to urban areas also occur. Urbanization is accompanied by trends toward less physically demanding occupations on a worldwide basis, particularly in lower-income countries [51]. This results from both an increase in the less physically demanding types of employment such as manufacturing and services and a decrease in the more labor-intensive agricultural employment as well as new technologies that have tended to reduce the physical effort involved. The increased use of public and private transportation, of technology and paid help for domestic activities, and the shift to more passive leisure activities such as television and computer games also contribute to reductions in activity levels and affect adults and children alike [52]. 22.3.4.3 Health Implications The health implications of the changes in dietary and activity patterns associated with urbanization are of much concern. Greater dietary diversity may have a positive impact on micronutrient status and malnutrition, but the higher fat and refined sugar content of diets, combined with the more sedentary lifestyle, increase the risks of obesity, cardiovascular diseases, certain forms of cancers, and other chronic diseases. Increased rates of smoking, stress, substance abuse, and the overall environmental contamination found in large cities further exacerbate these risks. Obesity, childhood obesity in particular, has increased so rapidly worldwide in the last few decades that it has been declared a public health problem in many countries and even an epidemic in some [51, 53, 54]. The coexistence of obesity and stunting in young children as well as the coexistence of obese parents and malnourished children is also surprisingly common in many large urban areas of the developing world [42, 55, 56]. Malnutrition during critical periods of gestation and early infancy, followed by the changes in dietary patterns related to urbanization is also thought to increase the risks of chronic diseases at adulthood [57, 58].
Chapter 22 / Urbanization and Food and Nutrition Challenges
649
The rapid increase in obesity worldwide and in urban areas in particular is rapidly becoming a serious public health concern even for low- and middle-income countries. Considering the unequivocal link between obesity and a large number of chronic disease risks, the obesity epidemic has to be taken seriously [54].
22.3.5
Increased Availability of Services, But Questionable Access by Poor Households
Health, education services, potable water, sanitation facilities, and garbage disposal are usually more available in urban rather than rural areas [59], but the rapid population growth experienced by a large number of cities in the developing world has caused a breakdown in the provision of urban services. Governments are unable to respond to these population pressures, and statistics show that one in six people in the world lack access to safe drinking water [60]. In many countries of the developing world, poor urban dwellers have to buy water at an extravagant cost [61, 62]. Poor urban dwellers are also much less likely to have access to adequate sanitation and garbage collection facilities, even in cities where wealthier households all have private bathrooms and regular garbage pickup. The availability and use of health services are also greater in urban areas. Our review of DHS data from 35 countries confirmed that, overall, urban dwellers are more likely to use health services both for curative purposes—when children have acute respiratory infections, fever, or diarrhea—and for preventive services such as immunization [29, 62]. Simple urban/rural comparisons have limitations, however, because they mask the enormous differentials found within an area. Pockets of undercovered population are known to exist in poor shanty towns, and these populations are also those that experience the greatest risks of infectious diseases [59]. Lower education levels and greater time constraints, combined with limited knowledge and awareness of the existence and potential benefits of these services, make the urban poor less likely to use the facilities even if they are available. In addition, the lack of supplies, the unfriendly attitude of some health workers, the unsanitary conditions, and the overcrowding of the facilities as well as their inconvenient open hours may discourage poor families from using them.
22.3.6
Environmental Contamination
The lack of access to basic water, sanitation, drainage, and solid waste disposal services makes it almost impossible for poor urban dwellers to prevent contamination of water and food, maintain adequate levels of hygiene, or control insect vectors of disease (such as malaria). In addition, they are exposed to excessive air pollution (both outdoor and indoor). This results in high rates of infectious diseases among both adults and young children in these areas. 22.3.6.1 Air Pollution Worldwide, more than 1.1 billion people live in cities with levels of air contamination in excess of the standards established by the WHO [59]. This affects both the poor and the rich alike. Poor urban dwellers, however, are likely to be more exposed to two additional sources of air pollution: indoor air pollution from poorly functioning cooking stoves and contaminants from industrial sites [59]. The latter is due to the fact that urban squatters are often established close to industries that create pollution, in sectors of the
650
Ruel, Garrett, and Haddad
city that wealthier groups tend to avoid, and poor urban dwellers are also more likely to work in these industries and to be exposed directly to toxic chemicals. Air pollution (both indoor and outdoor) is associated with increased acute respiratory infections, asthma, and mortality from pneumonia in children as well as chronic lung diseases and cancers in adults [63]. In Mexico City, air pollution is estimated to cause 12,500 extra deaths and 11.2 million lost workdays per year due to respiratory illnesses [64]. Exposure to lead is also thought to be responsible for the reduced intellectual performance of 140,000 children, and up to 29% of all children living in Mexico City had unhealthy blood lead levels [63]. 22.3.6.2 Water and Food Contamination Waterborne diarrheal diseases are known to be highly prevalent in urban areas, mainly as a result of contaminated water and food, crowding, limited access to water, and poor food and household hygiene [63]. Prevalence of diarrhea among young children in urban areas is often as high as in rural areas. Our review of DHS data from 35 countries (total of 42 data sets) showed higher prevalences of diarrhea in urban compared to rural areas in up to one third of the data sets reviewed [29]. Further analyses of 11 data sets also revealed that differences between low and high socioeconomic status (SES) quintiles within urban areas were consistently larger than differences between low and high SES groups in rural areas [64]. The prevalence of diarrhea among the urban low SES group was often greater than among the rural low SES group (in 7 of the 11 countries studied). Thus, overall diarrhea prevalence rates in urban areas rival those found in rural areas, and poor urban dwellers are often worse off than the rural poor in that regard. Contamination of water and food, particularly of street foods, is probably largely responsible for a significant proportion of gastrointestinal infections in urban areas.
22.3.7
Legal Rights
How do legal rights in the areas of employment, land, residence, and water use vary between rural and urban areas? While employment rights are likely to be well defined in the urban formal sector, the extent of their enforcement is unclear. In addition, the formality and strength of land and water user rights in rural areas will vary by region, by time, and by the gender of potential owner or user [68]. Newcomers to urban areas, if not linked to well-established urban families, may find themselves literally on the periphery of the city and relying on a shaky or nonexistent set of rights in the above domains. These underdeveloped rights will likely have costly effects. We provide three examples for which legal and regulatory changes may be needed to promote food and nutrition security in urban areas: urban agriculture, street foods, and land and housing tenure. 22.3.7.1 Urban Agriculture In many cities, agriculture is illegal. Frequently, urban farmers do not own the land but use public space or use vacant lots of private owners, with or without their permission. With low-tenure security and questionable legality, the farmer is not motivated either to be efficient or to care for the land. These constraints are often exacerbated by the fact that in many cities it is mostly women who are involved in urban agriculture. Legal and cultural biases against women owning or even leasing land make their attempts at urban farming even more difficult.
Chapter 22 / Urbanization and Food and Nutrition Challenges
651
The uncertain legal status of urban agriculture is such that official projects or programs aimed at improving urban agriculture have been rare. In combination with a weak legal framework, the lack of awareness and of government recognition means planners often do not think about how to provide water and drainage infrastructure to handle urban farming, and governments make little provision for research and extension of urban farming techniques [21]. Success with urban agriculture does exist, however. For decades, city authorities in Lusaka, Zambia, enforced laws against crop production in the city as a health hazard. Faced with economic decline in the 1970s, however, the Lusaka city council stopped enforcing the antiurban agriculture laws. Government stores even made subsidized seeds for fruits and vegetables available. In 1977, 43% of Chawama, one of the largest slums in Lusaka, had home gardens. A decade later, 40% of households still had home plots [68]. With more knowledge of successful experiences with urban agriculture, city administrators and planners can work to remove existing political, administrative, and legal hurdles for urban agriculture. 22.3.7.2 Informal Marketing Activities Such as Street Foods Street food vendors are ubiquitous in the developing world. Selling street foods represents an important informal sector activity. Despite wanting to stimulate microenterprises, the response of many governments is to sweep mobile sellers off the street into malls or back alleys, prohibit selling altogether, or subject selling to strict regulation. Vendors stay mobile because they cannot afford the start-up capital to establish themselves in a permanent market where they are subject to inspection and have to pay fees and taxes. Alternatively, the supply of rights or permits to permanent spaces may be severely restricted [48]. Strict regulation of mobile vendors may be detrimental. The Food and Agricultural Organization (FAO) and WHO warn that if vendors are banned only for the sake of traffic requirements or modernization plans, mobile street food vendors would simply go “underground.” It would become much more difficult to reach vendors through official channels to introduce safety measures or provide key environmental infrastructures and services to reduce health hazards [48]. 22.3.7.3 Insecurity of Tenure and Development Activity The NGO and research communities are becoming more aware of the need to understand the determinants of the placement of various development interventions and projects. An improved understanding can (1) improve estimates of project impact [65], (2) identify mismatches between community need and project location, and (c) provide some insight into the political and institutional factors that drive the development process. Work undertaken by the International Food Policy Research Institute (IFPRI) and CARE indicates that one of the key determinants of NGO intervention and civic engagement may be the security of tenure of individuals in the community [67].
22.4
IMPLICATIONS FOR POLICY AND RESEARCH
Policy makers need to address the above issues to promote the welfare of their urban citizens and the stability of government. They need to find policy and program instruments that can (1) reduce the cost of food to urban consumers and create
652
Ruel, Garrett, and Haddad
income-generating opportunities for them’ (2) provide low-cost, efficient safety nets for those who cannot help themselves and stimulate the generation of social capital; (3) ease the tradeoffs for mothers by providing acceptable and affordable child care substitutes and ensuring the safety of prepared and processed foods sold in the streets; (4) increase resources to primary health care and nutrition in an attempt to reduce tertiary health expenditures; (5) improve water and sanitation services, which are so important to households and to food vendors; (6) reduce the general level of contamination; and (7) redefine, respect, and enforce property rights that balance the needs of consumers and producers. Good information and analysis will shorten the process of trial and error in the design of effective policies and interventions. However, the relatively slow awakening of the policy research community to urban poverty, food insecurity, and malnutrition has left many questions unanswered. First and most basic, we need to answer the question: What is the state of urban poverty, food security, and undernutrition? What are the absolute numbers of the poor and malnourished in urban and rural areas for countries that do not have currently available data? What are the trends over time for other countries? Will the share of poverty and undernutrition that is urban continue to increase for those countries where this pattern is already seen? To answer these questions, we need to collect more data on urban areas, and we need to do a better job in addressing some of the difficulties faced in getting accurate numbers on urban poverty and undernutrition. Second, we need to explore the reasons for these levels and trends. Why, for example, does the share of poverty in urban areas appear to be decreasing in some countries? What are the main determinants of current levels and trends in urban poverty and undernutrition? What are the main constraints to urban income and nutrition generation, and how do they differ by country, city size,7 the competence of local governance, the length of residence, the strength of property rights, the maturity of the community, the number of income sources, education levels, health status, and land access? This chapter discusses some of the challenges to income generation, food security, and nutrition that are probably exacerbated in an urban area. Many questions are raised for which there are no ready answers, but as the problems of urban poverty and undernutrition increase, so will the clamor for answers. Third, where are the models of successful interventions in the policy and program arena? De Haan [68] noted that, compared to rural areas, there are fewer examples of successful public policies in urban environments. Whether there truly are fewer examples or whether they have simply not been recorded, best practices in local and national government need to be documented and analyzed. Examples of successful programs and policies that we can learn from are hard to find, and there have been few systematic attempts to draw out commonalities.8 Last but not least, a whole range of questions and problems remain unanswered and unsolved in relation to our current methods of inquiry in urban areas. First, urban populations
7
This is as suggested by Brockerhoff and Brennan [69]. For a selected set of examples of successful interventions, see Ruel, Haddad, and Garrett [24]. 8
Chapter 22 / Urbanization and Food and Nutrition Challenges
653
are much more spatially mobile than rural populations. This discourages local authorities from drawing up listings of households, and it makes it difficult to rely on existing listings for survey sampling. The larger number of homeless people in urban areas also makes them susceptible to underrepresentation in any survey. This mobility makes it difficult to track households and individuals over time, which is important if we want to understand the dynamics of poverty and undernutrition. The act of enumerating a questionnaire is much more complex in an environment where there is a dislocation of work and home. Mobility also makes it more difficult to control for community-level effects on household behavior and indeed even to define what we mean by a community. Mobility also affects the ease of defining a household unit. The presence of a large proportion of nonfamily household members such as tenants and seasonal residents may be more important for urban households and adds to the complexity of household definition. Second, time is scarcer in an urban setting, because households are more likely to engage in work far away from home which makes long interviews difficult to administer. Security is also often an issue for field-workers, and nighttime interviewing, which would be the only option for finding people at home, is often not possible. Finally, in the area of income generation, the relative anonymity of the urban center is likely to make illegal income generation more widespread, and this type of income-generating activity is notoriously difficult to capture in a questionnaire. Other censured information includes that on violence and substance abuse.
22.5
CONCLUSIONS
The economic reforms since the 1980’s have probably reduced urban bias and may have even removed it in some countries. The legacy of urban bias remains, however, and there is a greater need than ever to stimulate agricultural intensification, particularly in the poorer countries of sub-Saharan Africa and South Asia [70]. Nevertheless, as we have shown, the best available data indicate that urban poverty and undernutrition are increasing and are doing so at a faster rate than rural poverty and undernutrition. We view this closing of the rural–urban gap as a sufficient basis to call for more research on urban poverty, food, and nutrition issues; in this chapter, we indicated the areas in which we think more work is needed. It is important to remember that there is still a poverty and undernutrition gap, and in the least-urbanized countries it is wide. Hence, it would be premature to argue for even a small reallocation of government and NGO development resources from rural to urban areas. Can those who influence development policy and programs avoid the temptation to spend more money on urban problems and instead revisit how the existing envelope of urban resources is allocated? Given political realities, this temptation will be difficult to resist, and that is why the documentation of success stories of urban governance will be so important. But, is it even reasonable to ask policy makers to respond to increased data and analysis on urban problems without drawing development resources away from rural areas? This is a question that is impossible to answer at this stage. It is our strong opinion that much more can be done with existing resources, but this, like all the other questions posed in this chapter, is a researchable issue and one that should challenge policy researchers and policy makers over the next generation.
654
Ruel, Garrett, and Haddad
Acknowledgments Many of the ideas in this chapter were developed in the context of a wider IFPRI multicountry research program on Urban Challenges to Food and Nutrition Security. In particular, we would like to thank Daniel Maxwell, Saul Morris, Carol Levin, Patrice Engle, Arne Oshaug, and Bonnie McClafferty for their insights on the issues we present and Alison Slack of IFPRI and Purnima Menon of Cornell University for their invaluable research assistance.
REFERENCES 1. United Nations. World urbanization prospects: the 2003 revision. New York: Department of Economic and Social Affairs, Population Division, United Nations, 2004. 2. World Health Organization, Department of Nutrition for Health Development. WHO data base on child growth and malnutrition. Available at: http://www.who.int/nutgrowthdb/. 3. Haddad L, Ruel MT, Garrett JL. Are urban poverty and undernutrition growing? World Dev 1999;27:1891–1904. 4. Ruel MT, Garrett JL. Features of urban food and nutrition security and considerations for successful urban programming. eJADE 2004;1:242–271. 5. Population Crisis Committee. Cities: life in the world’s 100 largest metropolitan areas. Washington, DC: Population Crisis Committee, 1990. 6. Aragrande M, Argenti O. Studying food supply and distribution systems to cities in developing countries and countries in transition. Methodological and operational guide. Rome: Food and Agriculture Organization of the United Nations, 2001. 7. Argenti O. Feeding the cities: food supply and distribution. Brief 5. In: Achieving urban food and nutrition security in the developing world, 2020 Vision Focus 3 briefs. Garrett J, Ruel M, eds. Washington, DC: International Food Policy Research Institute, 2000. 8. Food and Agriculture Organization of the United Nations. Food supply and distribution to cities. Rome: Food and Agricultural Organization, 1997. 9. Reardon T, Timmer P, Barrett C, Berdegué J. The rise of supermarkets in Africa, Asia, and Latin America. Am J Agr Econ 2003;85:1140–1146. 10. Reardon T, Berdegué J. The rapid rise of supermarkets in Latin America: challenges and opportunities for development. Dev Policy Rev 2002;20:371–388. 11. Reardon T, Timmer P, Berdegué J. The rapid rise of supermarkets in developing countries: induced organizational, institutional, and technological change in Agrifood systems. eJADE 2004;1:168–183. 12. Weatherspoon D, Reardon T. The rise of supermarkets in Africa: implications for agrifood systems and the rural poor. Dev Policy Rev 2003;21:333–355. 13. Demery L, Squire L. Macroeconomic adjustment and poverty in Africa: an emerging picture. World Bank Res Obser 1996;11(1):39–59. 14. Sahn D, Dorosh P, Younger S. Structural adjustment reconsidered. Cambridge, UK: Cambridge University Press, 1997. 15. Funkhouser E. The urban informal sector in Central America: household survey evidence. World Dev 1996;24:1737–1751. 16. Meagher K. Crisis, informalization and the urban informal sector in sub-Saharan Africa. Dev Change 1995;26:259–284. 17. Simon PB. Informal responses to crises of urban employment: an investigation into the structure and relevance of small-scale informal retailing in Kaduna, Nigeria. Reg Stud 1998;32:547–557. 18. Portes A, Blitzer S, Curtis J. The urban informal sector in Uruguay: its internal structure, characteristics and effects. World Dev 1986;14:727–741. 19. Garrett J. Living life: overlooked aspects of urban employment. Washington, DC: International Food Policy Research Institute, 2004. Food Consumption and Nutrition Division Discussion Paper 171. 20. Mougeot L. Overview—urban food self-reliance: significance and prospects. IDRC Rep 1993;21(3):2–5. 21. United Nations Development Programme. Urban agriculture: food, jobs and sustainable cities. New York: United Nations Development Programme, 1996. 22. CARE/Tanzania. Dar es Salaam urban livelihood security assessment. Summary report. June 1998. Dar es Salaam, Tanzania: CARE/Tanzania, 1998.
Chapter 22 / Urbanization and Food and Nutrition Challenges
655
23. Maxwell D, Levin C, Csete J. Does urban agriculture help prevent malnutrition? Evidence from Kampala. Washington, DC: International Food Policy Research Institute, 1998. Food Consumption and Nutrition Division Discussion Paper 45. 24. Ruel MT, Haddad L, Garrett J. Some urban facts of life: implications for research and policy. World Dev 1999;11:1917–1938. 25. Putnam R. Bowling alone: America’s declining social capital. J Democr 1995;6(1):65–78. 26. Haddad L, Zeller M. How can safety nets do more with less? General issues with some evidence from southern Africa. Dev Southern Africa 1997;14(2):125–153. 27. Quisumbing AR, Hallman K, Ruel MT. Maquiladoras and market mamas: Women’s work and childcare in Guatemala City and Accra. Washington, DC: International Food Policy Research Institute, 2003. Food Consumption and Nutrition Division Discussion Paper 153. 28. Armar-Klemesu M, Ruel M, Maxwell D, Levin C, Morris S. Poor maternal schooling is the main constraint to good child care practices in Accra. J Nutr 2000;130:1597–1607. 29. Ruel MT, Garrett JL, Morris SS, Maxwell D, Oshaug A, Engle P, Menon P, Slack A, Haddad L. Urban challenges to nutrition security: a review of food security, health and care in the cities. Washington, DC: International Food Policy Research Institute, 1998. Food Consumption and Nutrition Division Discussion Paper 51. 30. Hight-Laukaran V, Rutstein SO, Peterson AE, Labbok MH. The use of breast milk substitutes in developing countries: the impact of women’s employment. Am J Public Health 1996;86:1235–1240. 31. Winikoff B, Castle MA, Hight-Laukaran V. Feeding infants in four societies. Contributions in family studies no. 14. New York: Greenwood Press, 1988. 32. Engle PL, Menon P, Garrett J, Slack A. Urbanization and caregiving: a framework for analysis and examples from Southern and Eastern Africa. Environ Urban 1997;9(2):253–270. 33. Blau DM, Guilkey DK, Popkin BM. Infant health and the labor supply of mothers. J Human Resour 1997;31:90–139. 34. Glick P, Sahn DE. Maternal labour supply and child nutrition in West Africa. Oxford B Econ Stat 1998;60(3):325–355. 35. Smith LS, Ruel MT, Ndiaye A. Why is child malnutrition lower in urban than in rural areas? Evidence from 36 developing countries. World Dev 2005;33(8):1285–1305. 36. Popkin BM. The nutrition transition in low-income countries: an emerging crisis. Nutr Rev (1994);52(9):285–298. 37. Bertazzi Levy-Costa R, Sichieri R, dos Santos Pontes N, Monteiro CA. Household food availability in Brazil: distribution and trends (1974–2003). Rev Saúde Publica 2005;39:1–10. 38. Mendez MA, Popkin BM. Globalization, urbanization and nutritional change in the developing world. eJADE 2004;1:220–241. 39. Mendez MA, Monteiro CA, Popkin BM. Overweight exceeds underweight among women in most developing countries. J Nutr 2005;81:714–721. 40. Du S, Mroz TA, Zhai F, Popkin BM. Rapid income growth adversely affects diet quality in China— particularly for the poor! Soc Sci Med 2004;59:1505–1515. 41. Gross R. Beyond food and nutrition: how can cities be made healthy? Asia Pacific J Clin Nutr 2002;11(suppl):S763–S766. 42. Garrett J, Ruel MT. Stunted child-overweight mother pairs: an emerging policy concern. Food Nutr Bull 2005;26(2):209–221. 43. Monteiro CA, Moura EC, Conde WL, Popkin BM. Socioeconomic status and obesity in adult populations of developing countries: a review. WHO Bull 2004;82:940–946. 44. Périssé J, Sizaret F, François P. The effect of income and the structure of the diet. FAO Nutr Newsl 1969;7:1–9. 45. Drewnowski A, Popkin BM. Dietary fats and the nutrition transition: new trends in the global diet. Nutr Rev 1997;55(2):31–43. 46. Senauer B, Sahn D, Alderman H. The effect of the value of time on food consumption patterns in developing countries: from Sri Lanka. Am J Agr Econ 1986;68(4):920–927. 47. Atkinson SJ. Food for the cities: urban nutrition policy in developing countries. Urban Health Program, Health Policy Unit. London: Department of Public Health and Policy, School of Hygiene and Tropical Medicine, 1992.
656
Ruel, Garrett, and Haddad
48. Tinker I. Street foods: urban food and employment in developing countries. New York: Oxford University Press, 1997. 49. Bouis H, Huang J. Structural changes in the demand for food in Asia. Washington, DC: International Food Policy Research Institute, 1996. Food, Agriculture, and the Environment Discussion Paper 11. 2020 Vision. 50. Musgrove P. Basic food consumption in north-east Brazil: effects of income, price, and family size in metropolitan and rural areas. Food Nutr Bull 1988;10(1):29–37. 51. Popkin BM, Doak CM. The obesity epidemic is a worldwide phenomenon. Nutr Rev 1998;56(4): 106–114. 52. Caballero B, Rubinstein S. Environmental factors affecting nutritional status in urban areas of developing countries. Arch Latinoam Nutr 1997;47(2 suppl):3–8. 53. World Health Organization. Obesity. Preventing and managing the global epidemic. Geneva: World Health Organization, 1998. 54. Caballero B. Symposia: obesity in developing countries: biological and ecological factors. J Nutr 2001;131(3):866s–899s. 55. Popkin BM, Richards MK, Monteiro CA. Stunting is associated with overweight in children in four nations that are undergoing the nutrition transition. J Nutr 1996;126(12):3009–3016. 56. Doak CM, Adair LS, Bentley M, Monteiro C, Popkin BM. The dual burden household and the nutrition transition paradox. Int J Obes 2005;29:129–136. 57. Barker DJ. Fetal and infant origins of adult disease. Br Med J 1889;301:1111. 58. Barker DJ. Mothers, babies, and disease in later life. London: British Medical Journal Publishing Group, 1994. 59. World Resources Institute, United Nations Environmental Programme, United Nations Development Programme, World Bank. World resources 1996–97. A guide to the global environment. The urban environment. New York: Oxford University Press, 1996. 60. Third World Academy of Sciences. Safe drinking water. The need, the problem, solutions and action plan. Trieste, Italy: Third World Academy of Sciences, 2002. 61. Briscoe J. When the cup is half full: improving water and sanitation services in the developing world. Environment (1993);35(4):7–37. 62. Atkinson SJ, Cheyne J. Immunization in urban areas: issues and strategies. WHO Bull 1994;72:183– 194. 63. Smith KR, Liu Y. Indoor air pollution in developing countries. In: Epidemiology of lung cancer. Samet JM, ed. New York: Dekker, 1994:154–163. 64. Bartone C, Bernstein J, Leitmann J, Eigen J. Toward environmental strategies for cities: policy considerations for urban environmental management in developing countries. Washington, DC: World Bank, 1994. Urban Management Programme Policy Paper No. 18. 65. Bradley D, Stephens C, Harpham T, Cairncross S. A review of environmental health impacts in developing country cities. Washington, DC: World Bank, 1992. 66. Menon P, Ruel MT, Morris SS. Socio-economic differentials in child stunting are consistently larger in urban than in rural areas. Food Nutr Bull 2000;21:282–289. 67. Meinzen-Dick R, Brown LR, Feldstein HS, Quisumbing AR. Gender, property rights, and natural resources. Washington, DC: International Food Policy Research Institute, 1997. Food Consumption and Nutrition Division Discussion Paper 29. 68. Pitt M, Rosenzweig M, Gibbons D. The determinants and consequences of the placement of government programs in Indonesia. In: Public spending and the poor: theory and evidence. De Walle D., Nead K, eds. Baltimore, MD: Johns Hopkins University Press for the World Bank, 1995. 69. CARE/Bangladesh. Report—urban livelihood security assessment in Bangladesh. February 1998. Dhaka, Bangladesh: CARE/Bangladesh, 1998. 70. de Haan A. Urban poverty and its alleviation. IDS Bull 1997;28(2):1–8. 71. Brockerhoff M, Brennan E. The poverty of cities in the developing world. New York: Policy Research Division, the Population Council, 1997. Working Paper 96. 72. Pinstrup-Andersen P, Pandya-Lorch R, Rosegrant M. The world food situation: recent developments, emerging issues and long term prospects. Food policy report. Washington, DC: International Food Policy Research Institute, 1997.
23
Impact of Parental Tobacco Use on Child Malnutrition and Survival Cora M. Best and Richard D. Semba
23.1
INTRODUCTION
Cigarette smoking causes 5 million deaths per year worldwide, and it is estimated that the annual death toll from smoking will climb to 10 million deaths by 2030, with 7 million deaths in developing countries [1, 2]. Cigarette smoke damages the lowerrespiratory tract [3], increases oxidative stress, and increases the risk of bronchitis, chronic obstructive lung disease, cancer, and death [1–3]. Tobacco companies have gradually shifted their market from high-income to low-income countries, where many people are poorly informed about the health risks of tobacco use and antismoking policy is relatively weak [2]. Although much research has been focused on the relationship between smoking and adverse outcomes such as cancer, respiratory illnesses, and cardiovascular disease, the problem of smoking and its relation to malnutrition, child survival, and poverty have not been well characterized [2]. Tobacco use may have adverse consequences for nutrition, health, and household budgets, especially among families living in poverty in developing countries. Tobacco control has been relatively neglected as an issue related to child malnutrition. New evidence is emerging that tobacco use contributes to impoverishment and child malnutrition. Tobacco control should be considered a mainstream issue that is integrated with other child health strategies in developing countries. The World Health Organization (WHO) Framework Convention on Tobacco Control (FCTC) is a major public health effort to control tobacco globally and consists of specific provisions to reduce the use of tobacco in countries that become party to the FCTC. Worldwide, some countries in Southeast Asia are showing the greatest impact of parental tobacco use on the exacerbation of child malnutrition. Given the historical trends in developing countries of poor tobacco control combined with strong tobacco marketing, unless public health efforts are implemented now, much of sub-Saharan Africa will likely follow the pattern of increasing tobacco use, impoverishment, malnutrition, and increased child mortality.
From: Nutrition and Health: Nutrition and Health in Developing Countries, Second Edition Edited by: R. D. Semba & M. W. Bloem © Humana Press, Totowa, NJ
657
658
23.2
Best and Semba
HISTORICAL BACKGROUND
In 1981, the physician and epidemiologist Nicholas Cohen postulated in The Lancet that an important health risk of smoking was the exacerbation of malnutrition and decrease in survival among young children in poor households in Bangladesh [4]. He decried the rise of cigarette consumption in Bangladesh and acknowledged that although respiratory disease and cancer were the best-recognized direct health consequences of smoking, these effects probably extended to child malnutrition and child survival. Cohen suggested that smoking only five cigarettes per day in a poor household in Bangladesh would lead to a monthly dietary deficit of 8,000 calories [4]. He also noted: Food shortages are unequally distributed everywhere—within families as well as over a country. Within the Bangladeshi family, the dominance of the adult male in terms of controlling income, decision making, and therefore priority for food allocation, means that the burden of decreased food intake will be borne, as far as possible, by others. … The existence of young children is already marginal. Quantitative reductions in food intake of the order estimated could thus tip the balance if their impact was, as seems most probable, largely on children under 5 years. … should these estimations be anywhere near correct, the nutrition-mediated effects of smoking, in terms of chronic undernutrition as well as survival, are likely to be far more important than the direct consequences of smoking on health.
Cohen’s seminal article was largely overlooked at the time, and much research on paternal tobacco use and its impact on child malnutrition and survival has come from the last several years.
23.3
EPIDEMIOLOGY OF TOBACCO USE
Worldwide, approximately 1.3 billion people (almost 1 billion men and 250 million women) currently smoke cigarettes or other products [5]. As noted, the use of tobacco products is declining in many industrialized countries, and there has been a shift of smoking from developed countries to developing countries. By 1995, there were more smokers in low- and middle-income countries (933 million) than in high-income countries (209 million) [6]. In developed countries, about 35% of men smoke, compared with 50% of men in developing countries and almost two thirds of men in China [6].
23.3.1
World Health Organization Conceptual Framework for the Tobacco Epidemic
Alan Lopez and colleagues proposed a model that has been adopted as the WHO conceptual framework for the evolving tobacco epidemic [7]. The model considers the tobacco epidemic to be a continuum that involves four stages (Fig. 23.1). The first stage defines the beginning of the smoking epidemic in a population and is characterized by a low prevalence (less than 15–20%) of cigarette smoking, with smoking mostly limited to males [7]. Death and disease due to smoking are not yet evident, and lung cancer is relatively rare [7]. The priorities of countries in this stage are generally to reduce malnutrition and the burden of infectious diseases, and tobacco control strategies are undeveloped. Efforts are made by tobacco companies to make smoking socially acceptable. Countries in sub-Saharan Africa are generally in the first stage [6].
Chapter 23 / Impact of Parental Tobacco Use
659
Fig. 23.1. World Health Organization conceptual framework for the tobacco epidemic.
The second stage is characterized by increases in the prevalence of smoking to more than 50% of men, with increases of smoking among women. Smoking is initiated at younger ages. The proportion of ex-smokers is low. Tobacco control activities are not well developed, and information about the hazards of tobacco is not organized. By the end of this phase, tobacco use is causing about 10% of male deaths, with a comparatively lower rate among women [7]. Tobacco control efforts have not been successfully implemented in part because the risks of tobacco use are not widely understood and, public and political support is not sufficiently strong [7]. China, Japan, and many countries in Southeast Asia, Latin America, and North Africa are in stage 2. In stage 3, the prevalence of smoking among males begins to decline after having reached peaks exceeding 60% in some countries. This stage may last for about three decades, by the end of which male smoking prevalence drops to around 40%. The prevalence of smoking among females may rise, plateau, and slowly decline, and the maximum prevalence of smoking among females is about 35–45% [7]. Despite the decline in the prevalence of smoking, the burden of smoking-attributable disease and mortality continues to increase because of the lag time between smoking and chronic disease. Among males, smoking-attributable mortality rises from 10% to 25–30% of all deaths. Among females, smoking-attributable mortality rises from 5% to about 10%. Smoking accounts for 10–30% of all deaths during this stage. Many countries in eastern and southern Europe and some countries in Latin America are in this stage [6]. Stage 4 of the epidemic is characterized by a large decline in the prevalence of smoking among males and females to about 35% and 30%, respectively [7]. Again, due to the lag between exposure and disease, smoking-attributable mortality continues to rise among males to 30–35% of all deaths, as high as 40–45% of deaths in middle age [7]. Smoking-attributable mortality among females rises rapidly, with an expected peak of 20–25% of all female deaths. During this stage, there is an increased demand for smoke-free workplaces, and legislation is passed for smoke-free personal environments. Industrialized countries in northern and western Europe, the United States, United Kingdom,
660
Best and Semba
Canada, and Australia are generally in this stage [6]. It should be emphasized that while the WHO model is a useful framework, not all countries fit this model for the tobacco epidemic. For example, the prevalence of smoking among females in China has remained low, and in some countries, cigarette consumption has decreased due to strict national policies that ban cigarette marketing and discourage smoking, such as in Thailand [6]. The prevalence of tobacco use is discussed in the following section, using the WHO definitions for specific regions.
23.3.2
The African Region
Much of the African region, which includes most of sub-Saharan Africa, is considered to be in stage 1 of the tobacco epidemic, and the prevalence of smoking, if data are available, appears to be increasing rapidly, especially among youths (Fig. 23.2) [8]. Some countries in the African region do not have any data available on the prevalence of smoking, which is consistent with the stage 1 classification. A systematic review of tobacco use in sub-Saharan Africa showed that males are more likely to smoke, but that no clear pattern regarding urban/rural or socioeconomic status was apparent [9]. Among youths aged 14–18 years in Uganda, 58.1% reported smoking cigarettes. Tobacco use in Africa commonly extends beyond cigarette smoking as pipes, snuff, and rolled tobacco leaves are also consumed [8]. The prevalence of smoking among adults in the African region varies substantially, with the prevalence higher among men than women (Fig. 23.3). In Malawi and Zambia, analyses from the Demographic Health Surveys showed that male tobacco users tend to be less educated and more likely to be from urban areas and have occupations as household or manual workers [10] Tobacco cultivation is expanding rapidly in some countries in Africa, notably Malawi, Zimbabwe, Nigeria, and Kenya. The WHO FCTC was adopted during the 56th World Health Assembly. In the African region, as of mid-2006, countries that were not signatories to the FCTC included Eritrea, Guinea Bissau, Malawi, Sierra Leone, Zambia, and Zimbabwe, while Angola, Congo, Cote d’Ivoire, Ethiopia, Gabon, Gambia, Guinea, Liberia, Mozambique, Uganda, and the United Republic of Tanzania were signatories but had not yet become parties to the FCTC. 70 60 50
%
40 30 20 10 0 UGANDA
BURKINA FASO
SOUTH AFRICA
ZIMBABWE
NIGERIA
MALAWI
GHANA
Fig. 23.2. Prevalence of smoking among youths in selected countries from the African region.
Chapter 23 / Impact of Parental Tobacco Use
661
70 60 50
%
40 30 20 10 0 KENYA
UGANDA
SOUTH AFRICA
ZIMBABWE
MALAWI
NIGERIA
GHANA
Fig. 23.3. Prevalence of smoking among men (solid) and women (gray) in selected countries from the African region. 70 60 50
%
40 30 20 10
A A
D
SA
C
A
N
U
L R B
U EZ VE
N
A
EL
ZI
A
A B U C
IC EX M
PE
R
O
U
0
Fig. 23.4. Prevalence of smoking among men (solid) and women (gray) in selected countries from the region of the Americas.
23.3.3
The Region of the Americas
The region of the Americas consists of the countries in North and South America and the Caribbean. The prevalence of smoking among adults varies widely, from countries with a prevalence of smoking among men of 40–60% (Mexico, Peru, Cuba, Venezuela), to 30–40% (Brazil), and less than about 25% (United States, Canada) [11] (Fig. 23.4). The overall per capita consumption of tobacco appears to be declining throughout this region. By mid-2006 in the region of the Americas, Colombia and the Dominican Republic had not become signatories to the FCTC, and Argentina, Bahamas, Cost Rica, Cuba,
662
Best and Semba
El Salvador, Grenada, Haiti, Nicaragua, Paraguay, Saint Kitts and Nevis, Saint Vincent and the Grenadines, Suriname, and the United States of America had not become party to the FCTC.
23.3.4
The Eastern Mediterranean Region
The eastern Mediterranean region includes Morocco, Egypt, Sudan, and Somalia and extends through the Middle East to Afghanistan. The prevalence of smoking reaches up to 50% of men and 10% of women [12] (Fig. 23.5). Among youths in Lebanon, the prevalence of smoking is 45.5% in males and 39.6% in females. Tobacco control laws were adopted by Pakistan, Egypt, and Qatar in 2002 [12]. As of mid-2006, countries that were not signatories to the FCTC were Bahrain and Somalia, and Afghanistan, Iraq, Morocco, Tunisia, and Yemen had not become party to the FCTC.
23.3.5
The European Region
The European region extends from Greenland, Iceland, and through Europe and Russia. The prevalence of smoking has generally declined in the European region over the last 30 years [13], but the prevalence of smoking varies widely, from over 60% of men in the Russian Federation to about 17% of men in Sweden (Fig. 23.6). Approximately 30% of adults are regular smokers. The death rate among women from tobacco-related causes is increasing, mostly because women were exposed to tobacco later than men. Many countries have placed bans or restrictions on smoking in public and in workplaces. As of mid-2006, Andorra, Bosnia and Herzegovina, Monaco, the Russian Federation, Tajikistan, Turkmenistan, and Uzbekistan had not become signatories to the FCTC, and Croatia, Czech Republic, Italy, Kazakhstan, Moldova, Poland, and Switzerland had not become party to the FCTC.
70 60 50
%
40 30 20 10 0 JORDAN
LEBANON
EGYPT
PAKISTAN
SUDAN
IRAN
SAUDI ARABIA
Fig. 23.5. Prevalence of smoking among men (solid) and women (gray) in selected countries from the eastern Mediterranean region.
Chapter 23 / Impact of Parental Tobacco Use
663
70 60 50
%
40 30 20 10
EN SW ED
E C N FR A
IT A LY
Y N A ER M G
SP A IN
C R EE G
R
U
SS
IA
N
FE
D
ER
A
TI O
N
E
0
Fig. 23.6. Prevalence of smoking among men (solid) and women (gray) in selected countries from the European region.
23.3.6
The Southeast Asia Region
The Southeast Asia region includes 11 countries: Bangladesh, Bhutan, Democratic People’s Republic of Korea, India, Indonesia, Maldives, Myanmar, Nepal, Sri Lanka, Thailand, and Timor Leste [14]. The prevalence of smoking varies across the region, with the highest prevalence of smoking found among men in Indonesia (Fig. 23.7). In this region, tobacco is widely used in both smoke and smokeless forms. Regular cigarettes, kreteks (cigarettes containing tobacco and cloves), klobots, cheroots, bidis, and cigars are smoked, as well as hand-rolled tobacco and tobacco smoked in a clay pipe or in hukkas. Chewing tobacco is consumed in India, Nepal, Bangladesh, Sri Lanka, Maldives, and Bhutan [14]. India, Indonesia, Bangladesh, and Thailand are among the top producers of tobacco worldwide. As of mid-2006, Indonesia was the only country from the Southeast Asia region that did not become signatory to the FCTC, and Nepal had not become party to the FCTC.
23.3.7
The Western Pacific Region
The western Pacific region includes 37 countries, from China and Mongolia to Australia and New Zealand and French Polynesia. In this region, the global death toll from tobacco has risen 14-fold, from 0.3 million deaths in 1950 to 4.2 million deaths in 2000 [15]. Overall, 60% of men and 6% of women smoke in this region. Being born male is the single greatest risk factor for tobacco use in this region [16–18]. The region has countries with some of the highest rates of smoking, with over 70% of men and women in Papua New Guinea and over 70% of men in Viet Nam reporting current smoking (Fig. 23.8). In the Philippines, smoking among adolescent boys declined from 32.6% in 2000 to 21.8% in 2003 and among adolescent girls from 12.9% in 2000 to 8.8% in 2003 [16]. By mid-2006, only the Lao People’s Democratic Republic had not become a signatory to the FCTC.
664
Best and Semba 70 60 50
%
40 30 20 10
A K
IA
D A N
SR
IL A N
IN D
N
TH A IL
EP A
L
R M A N YA M
B
IN
A N G
D
O
N
ES
IA
LA D ES H
0
Fig. 23.7. Prevalence of smoking among men (solid) and women (gray) in selected countries from the Southeast Asia region.
80 70 60
%
50 40 30 20 10
A LI
R ST U A
LA
O
R
A
PD
N PA
N PI PH
IL
IP
C
JA
ES
A IN H
A N ET VI
PA
PU
A
N
EW
G
U
IN
EA
M
0
Fig. 23.8. Prevalence of smoking among men (solid) and women (gray) in selected countries from the western Pacific region.
23.4
TOBACCO USE AND CHILD MALNUTRITION
Smoking exacerbates the effects of poverty as expenditures for tobacco may divert household income from food, clothing, housing, health, and education [19, 20]. Among low-income families in the United States, children of smokers had a poorer quality diet than children of nonsmokers [21]. The amount of money spent on tobacco is especially problematic in low-income countries [19, 20]. For example, in Vietnam in 1996, smokers spent an average of US $49.05 on cigarettes per year, which was 1.5 times that spent
Chapter 23 / Impact of Parental Tobacco Use
665
on education, 5 times that spent on health care, and about one third that spent on food per capita in the household each year [19]. In the poorest households in Indonesia, more money was spent on tobacco than education and health care combined [22]. Child growth is internationally recognized as the best global indicator of physical well-being in children as children with wasting, underweight, or stunting are at higher risk of deficient or delayed mental development and increased infectious disease morbidity and mortality [23]. Long-term consequences of child malnutrition include poor school performance, diminished intellectual achievement, reduced adult size, and reduced work capacity [23]. Parental smoking has an adverse impact on child growth, as shown in studies conducted in Indonesia, Bangladesh, and India.
23.4.1
Indonesia
Indonesia is the fifth largest market for tobacco in the world, with 182 billion sticks consumed per year [24]. The absolute domestic consumption of tobacco increased by 159% between 1970 and 1980, coincident with the mechanization of the cigarette industry in Indonesia in the early 1970s [25]. In the 1990s, an estimated 50% of men and 2.6% of women smoked cigarettes in Indonesia, usually kretek, which contain about two thirds tobacco, one third cloves, and various additives and flavors [25]; at present, over 62% of Indonesian adult males smoke regularly [25]. The prevalence of smoking is also increasing among adolescents in Indonesia [26]. An analysis of 175,859 households in urban slum areas in the Indonesia Nutritional Surveillance System (1999–2003) showed that the prevalence of paternal smoking was 73.8% [27]. After adjusting for child gender and age, maternal age and education, and weekly per capita household expenditures, paternal smoking was associated with child stunting (odds ratio [OR] 1.11, 95% confidence interval [CI] 1.08–1.14; p < .0001), severe wasting (OR 1.17, 95% CI 1.03–1.33; p = .018), and severe stunting (OR 1.09, 95% CI 1.04–1.15; p < .001). In households in which the father was a smoker, tobacco accounted for 22% of weekly per capita household expenditures, with less money spent on food compared with households in which the father was a nonsmoker. In households with a smoker, there was a smaller per capita expenditure on animal foods, vegetables and fruits, rice and other staples, snacks and baby food, sugar and oil, and instant noodles than in households in which the father was not a smoker [27] (Figs. 23.9 and 23.10). These findings suggest that the adverse effects of tobacco use include increasing the risk of malnutrition among young children of the household as a large proportion of household income is diverted toward cigarettes with a lesser proportion spent on food. In Indonesia, the per capita expenditure on tobacco in the lowest-income households may be increasing, from 9% of total expenditures in 1981 to 15% of total expenditures in 1996 [28]. Kretek cigarettes account for nearly 90% of the cigarettes consumed in Indonesia [29] and are available for purchase individually or in small, less-expensive packs, by which they are particularly accessible to the poor [30]. Indonesian and multinational tobacco companies advertise heavily on billboards, on television, in the cinema, and at sporting events, with tobacco ranked among the largest advertising spending categories in the country [30]. There are few restrictions on the tobacco industry conduct, advertising, and promotion in Indonesia [24], and as noted, Indonesia is the only country in Southeast Asia that has not signed the FCTC, which would require implementation of advertising limitations and the banning of tobacco sales to youths [31]. In addition,
666
Best and Semba
Fig. 23.9. Weekly per capita expenditures for households with a smoking father. Proportion of expenditures spent on major food types and other commodities. Other foods were defined as ready-to-eat foods and foods not produced in the household. Snacks were defined as commercially packaged products made in a factory. The category other consisted of electricity, gasoline, telephone, soap, seasonings, and the like. (From [27]. Reproduced from Public Health Nutrition with permission from Cambridge University Press.)
Weekly per capita expenditures for households with smoking father Water 1%
Fruits 1% Eggs 3%
Cigarettes 22%
Fish 4%
Rice 19%
Vegetables and other plant foods 16%
Fig. 23.10. Weekly per capita expenditures for households with a nonsmoking father. Proportion of expenditures spent on major food types and other commodities. Other foods were defined as ready-to-eat foods and foods not produced in the household. Snacks were defined as commercially packaged products made in a factory. The category other consisted of electricity, gasoline, telephone, soap, seasonings, and the like. (From [27]. Reproduced from Public Health Nutrition with permission from Cambridge University Press.)
Instant noodles 3% Oil 3% Sugar 3% Pocket money 4% Snacks 4%
Other foods 6% Other 11%
Weekly per capita expenditures for households with non-smoking father
Rice 22%
Vegetables and other plant foods 21%
Water Fruits Eggs Instant 2% 4% noodles 2% 4% Oil 4% Sugar 4% Pocket money 5% Snacks 5% Fish Other 5% Other foods 15% 7%
relatively weak tobacco control legislation that passed in 1999 was further weakened with an amendment in 2003 to drop sanctions against the tobacco industry for violation of tobacco control regulations, such as not including health warnings [24]. The heavy advertising and marketing of cigarettes in Indonesia may be a contributing factor to the high prevalence of smoking among Indonesian men.
23.4.2
Bangladesh
Bangladesh is one of the poorest countries of the world, and many poor households are unable to provide for the basic essentials. In spite of this, a large proportion of men in poor families smoke, and the prevalence of smoking is highest among the poorest
Chapter 23 / Impact of Parental Tobacco Use
667
families [20]. Average male cigarette smokers in Bangladesh spend more than twice as much on cigarettes than the per capita expenditure on clothing, housing, health, and education combined [20]. Debra Efroymson and colleagues estimated that the typical poor smoker in Bangladesh could add over 500 calories to the diet of one or two children in the household if he spent the money on food rather than cigarettes. Overall, it was estimated that if money were spent on food rather than cigarettes, it would save the lives of 350 children in Bangladesh per day [20].
23.4.3
India
An analysis of data from the National Family Health Survey II, a nationally representative survey of 92,486 households in India, showed that children who came from households where at least one family member used tobacco were more likely to have severe stunting or severe underweight [32]. Regular tobacco use was associated with poverty, rural setting, and low education [33]. In Mumbai, tobacco use was common among street children and pavement dwellers, and their expenditures on tobacco were high relative to that for nutritious foods [34, 35]. In addition to cigarettes, tobacco is consumed in many different forms in India, as shown in Table 23.1.
23.4.4
“Going Up in Smoke”: Tobacco Versus Food
Among poor families in Indonesia, Bangladesh, and India, children may be needlessly going hungry because money that could be spent on necessities like food is being diverted to cigarettes. Smoking is potentiating malnutrition among children in the
Table 23.1 Tobacco products consumed in India Name bidi khaini
masheri, mishri, misheri mava naswar
paan
Description Popular form of smoked tobacco, 5–8 cm; composed of 0.25–0.5 g locally grown tobacco Mixture of tobacco and lime prepared in the palm, formed into a ball, and placed in the mouth; placed in the groove between the cheek and the gum Roasted or half-burnt tobacco; prepared by baking on a hot plate; made into powder and used mostly for cleaning teeth; sometimes used as alternative for chewing tobacco Mixture of raw areca nut, tobacco, and lime water; wrapped in cellophane and rubbed against the palm Mixture of sun- and heat-dried tobacco leaves, slaked lime, tree bark ash, some flavorings, and sometimes coloring agents; water is added, and material is rolled into balls and placed in the labial groove behind the lower lip; material is expectorated after being chewed for 10–15 minutes Betel quid with tobacco; prepared by applying slaked lime and catechu to a betel leaf, to which small pieces of areca nut are added; other flavorings may be added; tobacco is the most important ingredient of paan for regular users; ingredients are folded into the betel leaf and chewed
Source: Adapted from [36].
668
Best and Semba
family, exacerbating poverty, and may have long-term implications for the health of future generations of children in Indonesia and other countries with poverty and widespread tobacco use.
23.5
OTHER ADVERSE EFFECTS OF PARENTAL SMOKING ON CHILD HEALTH
Parental smoking has an adverse effect on respiratory health of children. In addition, passive smoking lowers the levels of circulating plasma antioxidants. In poor households, the morbidity in children from passive smoking may potentiate the malnutrition that results from the diversion of household income from food to tobacco. Pregnant women who are exposed to environmental tobacco smoke have worse pregnancy outcomes, including lower birth weight among their infants.
23.5.1
Respiratory Health
Parental smoking is associated with an increased risk of lower respiratory illness in infants and young children [37]. A systematic review of 38 studies showed that smoking by either parent (OR 1.57, 95% CI 1.42–1.74) or maternal smoking (OR 1.72, 95% CI 1.55–1.91) increased the risk of lower-respiratory illness in infants and children [37]. Parental smoking increases the risk of respiratory symptoms and asthma in school-aged children. In a systematic review of 60 studies, smoking by either parent increased the risk for asthma (OR 1.21, 95% CI 1.10–1.34), wheezing (OR 1.24, 95% CI 1.17–1.31), coughing (OR 1.40, 95% CI 1.27–1.53), and breathlessness (OR 1.31, 95% CI 1.08–1.59) [38]. The risk of middle ear disease and adenotonsillectomy is also significantly increased in children whose parents are smokers. A systematic review of 45 studies showed that if either parent smoked, the risk of recurrent otitis media (OR 1.48, 95% CI 1.08–2.04) and middle ear effusion (OR 1.38, 95% CI 1.23–1.55) were increased [39]. Parental smoking also exacerbates the severity of disease among children with established asthma [40]. The risk of sudden infant death syndrome is doubled among infants whose mothers are smokers [41].
23.5.2
Low Birth Weight
Women who are exposed to environmental tobacco smoke during pregnancy have infants with significantly lower birth weight than women who are not exposed [42–44]. Environmental tobacco smoke also increases the risk of fetal mortality, preterm delivery, and retarded fetal growth [45]. A meta-analysis conducted in 1999 showed that environmental tobacco smoke exposure was associated with lower birth weight [46]. These findings suggest that parental tobacco use may have an impact on child nutritional status beginning in utero, with lower birth weight among infants born to mothers who were exposed to environmental tobacco smoke. The detrimental effects of paternal tobacco use then continue, with a large proportion of household income diverted away from food and toward tobacco, as noted in Indonesia, Bangladesh, and India. Most of studies of the relationship between environmental tobacco smoke and low birth weight have been conducted in industrialized countries. A study from India showed that nonsmoking mothers who were exposed to environmental tobacco smoke during pregnancy had a higher incidence of preterm birth, small-for-gestational-age babies, and infants with lower birth weight [47].
Chapter 23 / Impact of Parental Tobacco Use
23.5.3
669
Circulating Antioxidants
Exposure to environmental tobacco smoke has been associated with decreased levels of circulating antioxidant nutrients in children. These effects are presumably due to the pro-oxidant load that is associated with passive smoking as antioxidants are used to quench reactive oxygen species. Children exposed to environmental tobacco smoke had significantly lower plasma ascorbate concentrations than unexposed children who consumed equivalent amounts of vitamin A [48]. In the Third National Health and Nutrition Examination Survey, a dose-response relationship was noted between levels of tobacco exposure and serum ascorbate levels in children [49]. The relationship between passive smoking and serum/plasma antioxidant levels has been more thoroughly investigated among adults, and these studies showed that exposure to environmental tobacco smoke decreases circulating levels of carotenoids and ascorbate [50, 51]. The long-term health consequences of chronic low levels of antioxidant nutrients in children exposed to environmental tobacco smoke are unclear.
23.5.4
Increased Health Care Utilization
As shown, exposure to environmental tobacco smoke is associated with increased respiratory disease in children. In a study of 8,327 parent–infant pairs in Hong Kong, women who were exposed to environmental tobacco smoke during pregnancy had increased clinical consultations (OR 1.26, 95% CI 1.4–1.39) and hospitalizations (OR 1.18, 95% CI 1.05–1.31) for their infants in the first 18 months of life [52]. In this birth cohort (from 1997) alone, the additional 1,581 hospitalizations attributable to environmental tobacco exposure were at a cost of over US $2.1 million [53]. If environmental tobacco smoke is causally associated with health services utilization, about 9% of the total direct medical costs in the first year of life can be attributed to passive smoking [53].
23.6
PARENTAL TOBACCO USE AND CHILD MORTALITY
We showed, in a study of over 300,000 families from urban slums and rural areas of Indonesia, that paternal smoking increased the risk of infant and under-5 child mortality by about 10–15% in urban slums and 30% in rural areas [54]. The prevalence of maternal 14
12
P