Object-Oriented Design Pattern for DSL Program Monitoring Zo´e Drey
Ciprian Teodorov
Lab-STICC, ENSTA Bretagne Brest, France
[email protected]
Lab-STICC, ENSTA Bretagne Brest, France
[email protected]
Abstract
DSLs bridge the gap between the conceptual models manipulated by the domain-experts – the problem domain – and the computation-oriented view provided by general purpose languages (GPL) – the solution domain. While DSL development is hard, principally due to the knowledge-duality required (domain-specific and language engineering competencies) [22], during the last decades a large number of tools have been created to simplify the DSL implementation process. These developments are principally based on the identification of language implementation patterns, which are generalized and integrated in fully-fledged DSL design toolkits, known as language workbenches [7]. Most of the existing language workbenches provide language design facilities (syntax and semantics) and the generation of dedicated programming infrastructures consisting of editors, validators and testing facilities [7]. However, in spite of these impressive developments, there is a perceived lack of tool support for DSL program validation and maintenance [18]. The lack of tool support for these two development phases induces a high cost after DSL deployment. In GPLs, tools like interactive debuggers [21] and profilers [10] ease these tasks by providing a view on the dynamic program execution. Recent developments partially address these issues by proposing domain-specific tools [3, 27] and by ad-hoc integration of debugging support in language workbenches [1, 7]. The development of domain-specific debuggers [3] or profilers [27] greatly improves DSL programming environments, and offers reusable solutions to two of the most important tools for program diagnosis. However powerful and reusable, it is not always clear how these tools can be meaningfully integrated with the runtime of arbritrary DSL implementations. As a result, the integration of debugging tools in language workbenches lacks modularity and is not compositional with other monitoring tools. The core underlying mechanism enabling both debuggers and profilers is the possibility to observe the continuous evolution of a program during its execution, which is known in the literature as program monitoring [23]. For the purpose of this study we define DSL monitoring as the process of observing the execution of a program expressed in a DSL. This definition implies that an external party (external to the execution runtime of a particular DSL) can gain access to the
To ease domain-specific language (DSL) development, a range of language workbenches have been created, which provide language design facilities and programming tools, like editors and validators. In spite of these developments, there is a perceived lack of tool support for execution monitoring, which is the basic block for program validation and maintenance. To partially address this issue some language workbenches offer ad-hoc solutions for DSL debugging, but lack support for other monitoring features. In the literature, a number of domain-specific monitoring tools have been proposed. However, there is no clear way for integrating these developments in existing language workbenches. This paper presents ten requirements needed for creating a modular and composable DSL monitoring infrastructure and proposes an object-oriented design pattern for DSL program monitoring. This pattern provides a practical answer to the problem of interfacing the runtime of a DSL with concrete domain-specific monitoring tools. To show the practicability of our approach, we add monitoring support to a simple lambda calculus, without changing the standard interpreter. The ease of integrating monitoring tools is shown through the development of a tracer and the integration of an off-the-shelf domain-specific profiler. Categories and Subject Descriptors neering]: Testing and Debugging
D.2.5 [Software Engi-
Keywords domain-specific language, language workbench, execution monitoring
1.
Introduction
To reduce the accidental complexity in the development of software-intensive systems, the sofware engineering community promotes the use of domain-specific languages (DSL). Permission to make digital or hard copies of all or part of this work for personal or classroom use is granted without fee provided that copies are not made or distributed for profit or commercial advantage and that copies bear this notice and the full citation on the first page. Copyrights for components of this work owned by others than ACM must be honored. Abstracting with credit is permitted. To copy otherwise, or republish, to post on servers or to redistribute to lists, requires prior specific permission and/or a fee. Request permissions from
[email protected].
SLE’16, October 31 – November 1, 2016, Amsterdam, Netherlands c 2016 ACM. 978-1-4503-4447-0/16/10...$15.00
http://dx.doi.org/10.1145/2997364.2997373
70
Req 3: Genericity. It is impossible to foresee all properties (or program information) to check [14] and all monitoring tools needed for monitoring arbitrary DSL programs: a monitoring approach should be evolvable according to new properties or monitoring requirements. Therefore, monitoring systems must provide genericity in the sense that a monitoring infrastructure should be evolvable as needed, enabling new tools to be created independently of a specific language. Req 4: Composability. The composability requirement can be seen as a consequence of the genericity requirement that fosters a high-level of reuse. To provide composability, the monitoring infrastructure should enable to compose monitor information, to execute multiple monitors without interference, and to create dependencies between monitors (e.g., monitor the monitor). Req 5: Unanticipated monitoring. For a DSL targeting long-running systems and live programming environments, the monitoring infrastructure should be pluggable at runtime. Through such a functionality the monitoring support could be added and removed at runtime without stopping the application. To do so, the DSL designer should further provide the means for interpreting on-the-fly the runtime state of the program from its source code viewpoint (e.g., with support for monitoring meta-data, like debugging symbols). Req 6: Portability. In the context of DSL design, the monitoring infrastructure should be easily portable to different implementation languages or language workbenches. Moreover, the monitoring infrastructure should limit the usage of reflection facilities available in the host language. This would enable the portability to object-oriented languages having limited reflection capabilities. Req 7: DSL runtime integration. It should be easy to integrate the monitoring infrastructure with existing DSL runtimes. Ideally the integration of monitoring support should not impose changing the DSL runtime. Req 8: Tool Integration. The monitoring infrastructure should facilitate the integration of existing domains-specific monitoring tools, like dsprofile [27], MetaSpy [25], or Moldable Debugger [3]. By satisfying this requirement, a monitoring infrastructure enables a maximum level of reuse while letting the DSL designer focus on the creation of the DSL. Req 9: Minimize the Gap The monitoring tools should use a monitoring language similar to the source language. Since the runtime data structures manipulated by the monitor are those of the source language, making the two languages similar has a double advantage: it renders the monitoring language easier to comprehend, and facilitates the implementation through reuse. To facilitate the development of such monitoring tools, the monitoring infrastructure could provide generic means for querying the runtime state of a DSL program. Req 10: Break the Rules At development time, the monitoring tools could provide the possibility to implement facilities not available in the source language. For instance, a
runtime data-structures and inspect in a meaningful way the state of the program at discrete moments coherent with the DSL semantics. From a theoretical point of view, the integration of generic monitoring facilities in language runtimes was studied by Kishon et al. [17]. In this approach, overviewed in Sec. 3, the authors propose to capture the language semantics in a continuation-passing-style which is extended with a monitoring operator. Through this operator the language semantics is parameterized with the denotational semantics of a monitor, for instance a profiler, a tracer, etc. The main contribution of this paper, presented in Sec. 4, is an object-oriented DSL monitoring pattern, inspired by the formal framework of Kishon et al. [17]. This pattern provides a practical answer to the problem of interfacing the runtime of a DSL with concrete domain-specific monitoring tools. Such interfacing is a key enabler for effectively capitalizing on the progress made on the tool creation side, by fostering a maximum level of reuse. To achieve this, in Sec. 2 we define ten high-level requirements that should be satisfied by such an interface. These requirements range from monitoring completeness, non-interference, and composability to ease of integration, and portability. The practicability of our approach is shown, in Sec. 5, by applying the monitoring pattern to a simple lambda calculus runtime. The monitoring infrastructure built by applying the design pattern can be easily integrated with existing tools, which is shown through the integration of DSProfile, an external profiler tool.
2.
Requirements for DSL Monitoring
Program monitoring was largely studied and popularized, in the context of GPLs, through tools like interactive debuggers [21] and profilers [10]. To better characterize the monitoring problem, in this section we introduce ten requirements that should be satisfied by a DSL monitoring infrastructure. Req 1: Completeness. The completeness requirement implies that all aspects that have an interpretation on the source language can be stated and their occurrence detected. To be complete a monitoring infrastructure should provide the means for fine grained observation of the interpretation of each language construct. To ensure the correctness of such observations the language runtime should provide a consistent view of the execution state before and after the execution of atomic language constructs. Req 2: Non-interference. The monitoring infrastructure should not interfere with the DSL semantics: guaranteeing that monitoring does not change the original DSL semantics is primordial for establishing correct causal relations between the source of an error and its effect on the program runtime. To ease the validation of diagnosis hypotheses, the monitoring tools might break this requirement at early development stages (e.g., the modification of the value of a variable during a debug session), as motivated in Req 10.
71
monitor may require access to variables that are not accessible by the scope rules of a language (i.e., encapsulated or private variables), it may require access to the invocation chain, or it may require the possibility to change the shape of the running program (e.g., modify the AST). The monitoring infrastructure might provide the means for achieving these functionalities. However, it should be possible to disable these features to guarantee non-interference and security when monitoring critical applications. This set of requirements is by no means exhaustive, however, it already poses a range of challenges that should be addressed when creating a DSL monitoring infrastructure. A large number of research efforts have been dedicated to the problem of language monitoring, however, to the best of our knowledge none of the solutions proposed in the literature satisfies all the requirements presented. Amongst the existing approaches, the monitoring semantics of Kishon et al. [17] directly addresses some of these requirements. However, this approach requires the DSL semantics to be specified in a continuation-passing style which makes the integration with existing language runtimes difficult (Req 7), it is not easily portable to an object-oriented programming environment (Req 6), does not have support for unanticipated monitoring (Req 5), and while it formally guarantees non-interference it does not enable to break the rules (Req 10). Moreover, while the approach enables the composition of monitors, the monitoring annotations should be disjoint, which hinders the independent development and the integration of existing monitoring tools (Req 8). The object-oriented DSL monitoring pattern presented in this study is inspired by the Kishon monitoring semantics [17] and strives to address all the requirements introduced in this section. However, we focus principally on the first eight requirements, which have the biggest impact on the design of a monitoring infrastructure. The last two requirements impact more the user interface of monitoring tools than the monitoring infrastructure, and are thus left for future work.
3.
program, typically including a representation of the memory), and the valuation functions. These functions map syntactic terms to elements of the language’s semantic domains that represent the meaning of the program. Fig. 1 sketches the relationships of the entities involved in Kishon’s monitoring framework: given a standard interpreter written in continuation-passing style, and a monitor specification specifying how monitoring information (called monitoring state) is computed, the monitoring semantics define a composition operator that weaves the two semantics to yield a monitoring interpreter. Monitor specification
Program and input
Composition operator Monitoring interpreter Evaluator family
input
+ = Monitoring answer
Monitoring state
output includes the specification of monitoring state
Figure 1. Entities of the monitoring semantics In the remainder of the section, we overview these three parts. The reader is referred to the original article [17] for a thorough description of the framework. 3.2
The Standard Interpreter
The standard interpreter is assumed to be written with valuation functionals and in continuation-passing style. Valuations functions as fixpoints One of the key points of the framework is that the mapping of syntactic terms to their meaning is defined as fixpoints of valuation functionals. A functional takes a function f as its parameter, and returns a function. The valuation functions that perform the evaluation of a syntactic term are the fixpoints of these functionals. The “inheritance” of the behavior of the valuation function is then done on the valuation functional and propagated over the recursive calls of its f parameter function. Continuation-passing style To capture the control flow of the evaluation, the language to be monitored is defined using continuation-passing style semantics [8]. Through this approach, besides capturing the computation itself, the evaluation order is made explicit as a parameter of the valuation function (i.e., a function expressing the “rest of the computation”). The continuation parameter guides the ordering of monitor activity. Specifically, a continuation type has the form Kont = IVal → Answer, where Answer is a final answer corresponding to the program meaning. The parameters of a valuation function are: (a) the syntactic term (typed as SynTerm); (b) the semantic arguments, which are elements of the language’s semantic domains (typed as SemDom); and (c) a continuation of type Kont. The corresponding valuation functional has the signature Gi = Ti → Ti where Ti = SynTerm → SemDom → Kont → Answer. The initial value of the continuation parameter is a function that may perform some final processing on the result corresponding to the term’s meaning to produce a final
Background: Monitoring Semantics
Our proposal stems from the original work of Kishon, Hudak and Consel [17]. They defined a formal methodology for specifying and implementing execution monitors for a given language. Specifically, they proposed a “monitoring semantics” as a generic semantic model for defining program execution monitors. The approach consists of defining the semantics of a given execution monitor, which is then used as a parameter of the standard semantics of a programming language. 3.1
Standard answer
Standard interpreter
Overview of the Framework
The specification of the semantics classically consists of three parts: the abstract syntax (e.g., BNF rules), the semantic algebras (the semantic domains and their operations, that can be seen as a representation of the internal structure of the
72
answer. The meaning of a syntactic term synTerm using its functional Gi would be given by a call of the shape “(fix Gi ) synTerm initSemArgs (λ v → finalProc v)” where initSemArgs corresponds to the initial state of the program, and finalProc a final processing function on the term’s meaning (i.e., on the final result). 3.3
(monKont); the behavior of Gi is outlined as follows: Gi valFun synTerma semArgs monKont = Given a pair of monitoring functions pre and post, partially applied, and a new continuation: preProcessing : MS → MS = pre a synTerm semArgs kont postProcessing v : MS → MS = post a synTerm semArgs v (where v ∈ IVal) newKont value = postProcessing (monKont value). The behavior of Gi consists of:
The Monitor Specification
The semantics of a monitor is defined in the same three-fold methodology as the target language: abstract syntax, semantic algebras, and valuation functions. The abstract syntax of the monitor specifies an annotation on a syntactic term. This annotation specifies the shape of the monitoring information to be provided. The semantic algebras define the domain of monitoring states (or MS) and its operations. Monitoring states capture information on intermediate program states. The valuation functions correspond to a pair of monitoring functions (for pre- and post- monitoring), one pair for each valuation function defined for a kind of syntactic term. The pre (resp. post) function gathers information before (resp. after) evaluation and updates the current monitoring state. The post function additionally takes the produced intermediate value as its argument. Their signatures are: pre : Ann → SynTerm → SemDom → MS → MS post : Ann → SynTerm → SemDom → IVal → MS → MS, where Ann refers to (the type of) an annotation, SynTerm to an annotated syntactic term, SemDom to the arguments from the domains of the standard semantics, and IVal to the intermediate value computed by a valuation function. 3.4
1. First, applying preProcessing to the current monitoring state (its initial value is given in the initial monitoring continuation), returning an updated monitoring state. 2. Second, applying the valuation function valFun to the new continuation newKont; this amounts to evaluating the syntactic term. Each intermediate value produced by the evaluation of a syntactic term is applied the postProcessing function encapsulated in newKont, returning an updated monitoring state. If the syntactic term is not annotated, then the standard Gi is applied to the parameters. The result of applying Gi on a program is the original answer together with a final monitoring state. 3.5
Limitations of the Monitoring Semantics
Kishon et al. formal framework, also referred in the following as Kishon’s monitoring semantics, thoroughly leverages the mechanisms provided by the functional paradigm. In particular, the semantics are in continuation-passing style, and the fixpoints of functionals serve as an inheritance mechanism. Furthermore, because it is close to the notation of a formal semantics, a functional implementation of it is direct. However, a fortiori in a non-functional setting (i.e., objectoriented), expressing an operation in continuation-passing style (CPS) is not always adapted or easy to grasp: given an existing, direct semantics (or a definitional interpreter), transforming it into CPS can be a difficult task (though advantageous in some situations) [15]. Moreover, in objectoriented practice, the implementation of a language semantics is based either on the interpreter pattern (capturing the direct semantics along the AST) or on a double-dispatch generalization, known as the visitor pattern, which decouples the semantics from the syntax definition. Nevertheless, we consider the concepts introduced by Kishon et al. [17] foundational for the definition of monitoring infrastructures. As a result, the object-oriented design pattern for monitoring, presented in Section 4, embodies the aforementioned functional concepts in a classical objectoriented style. As a preliminary, we first overview how the three key functional concepts can be comprehended from an object-oriented viewpoint.
The Composition: Monitoring Interpreter
The standard semantics is then enhanced to yield a parameterized monitoring semantics, which can be instantiated with a monitor specification to produce a concrete monitoring semantics. Firstly, the domain of monitoring answers (MonitoringAns) is defined, extending the answer domain in the language standard semantics as MonitoringAns = MS → (Answer × MS). Secondly, the valuation functionals of the standard semantics are slightly adapted to integrate the domain of monitoring states: the final answer becomes a monitoring answer, and the continuation domain is adapted accordingly. A valuation functional of the monitoring semantics has the signature Gi = T i → T i where T i = (Annotated) SynTerm → SemDom → MonKont → MonitoringAns and where MonKont refers to a continuation now returning a monitoring answer, and the syntactic term is provided with an optional annotation. These type changes specialize the corresponding original generic types. Thirdly, the monitoring valuation functional wraps the standard valuation functional, using the pre and post monitoring functions. Consider a valuation function (valFun), a syntactic term optionally annotated with a (synTerma ), semantic arguments (semArgs) and a monitoring continuation
73
3.6
Object-Oriented Viewpoint of Functional Concepts
This section introduces an object-oriented viewpoint on three functional concepts needed by Kishon’s framework. Fixpoints and inheritance. The technique of fixpoints has been used to define inheritance in object-oriented languages [5, 24]. Specifically, a class is modeled as a functional (also called a generator), and inheritance is modeled as the application of a wrapper application on functionals, yielding a new functional. A wrapper application consists of combining a wrapper operation that defines methods to be modified or replaced, and the original functional (modeling the original class), yielding a new functional, modeling the inherited class.
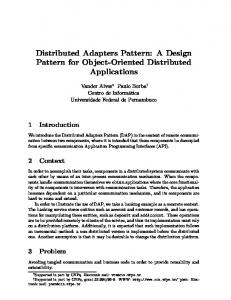
Figure 2. Two traversals of “3*(5+4)” in depth-first order results are passed on to be used during the evaluation of future elements. Fig.2(a) shows such a traversal over an AST representing the 3*(5+4) expression. When the traversal encounters the + node, it proceeds to evaluating the associated valuation function, which computes the addition on the results of evaluating the 5 and 4 literals and returns the result. To weave the monitoring aspect into the program execution, the monitoring semantics, presented in Section 3, wraps the valuation function associated to the monitored element in a pre-processing function before the actual valuation and a post-processing function after the actual valuation. Doing so enables the monitor to capture and interpret the dynamic state of the program before and after the evaluation of the monitored syntactic construct.
Instrumentation of the control flow. In a program written in continuation-passing style, the continuation argument is used to capture the order of evaluation and its initial value can be set to do some processing on the final result, yielding a final answer. In Kishon’s monitoring semantics, the continuation is modified to add pre- and post- processing treatment around the evaluation of a term. Furthermore, the final answer is enhanced to hold a monitor state, to produce a monitoring interpreter (or semantics). In an object-oriented language, a traditional way to define interpreters is to use dedicated patterns, such as the visitor pattern, which traverse the syntactic terms (i.e., the abstract syntax tree or AST) of a program. In such a setting, the order of evaluation is made explicit by the (sequential) order of the accept calls on each subpart of a syntactic term. The final result can be further processed in the main calling program.
4.1
To capture the AST traversal strategy, Kishon’s framework assumes a continuation-passing style semantics, which constrains the language designer to redefine the language semantics in this style. Our approach relies on the fact that the traversal strategy is captured by the explicit invocations of the evaluation methods of each AST node. Based on this observation, the approach we propose uses an AST decorator to annotate nodes to be monitored with the monitoring construct. Fig. 2(b) shows the impact of our strategy on the program AST and on its traversal strategy. The + node is decorated with a monitor that associates to the #add monitoring syntax the m.pre(...) and the m.post methods (corresponding to the pre and post functions of the monitoring semantics). This decoration leads to the evaluation of the pre and post monitoring functions at the right moment by simply extending the original language semantics with a new valuation function associated to the decorator. To achieve this functionality, we introduce the monitoring pattern presented in Fig. 3. The main advantage of this pattern over the monitoring semantics [17], is that the language designer does not need to modify the standard interpreter of the monitored DSL. It instead achieves the same functionality, without requiring continuation-passing style semantics nor reflection facilities, only by inheriting the standard semantics from an existing interpreter and extending it with a new valuation function associated to the Decorator (Req 6). This valuation function 1) delegates the evaluation of the monitored node to the standard interpreter, and 2) dispatches the calls to the pre and post functions to the associated concrete monitor. The monitoring infrastructure shown in Fig. 3 is connected to the standard interpreter by inheritance, which enables the addition of monitoring without needing access to the source
Function parameters and instance variables. The representation of function parameters, in an object-oriented context, depends on the nature of these parameters: they can either be parameters of the methods or instance variables of the classes that contain these methods. To distinguish local from global variables, the analysis proposed by Schmidt [26] can be applied. Proof of correctness is though out of this paper’s scope.
4.
Contribution Overview
DSL Program Monitoring: The Pattern
In this section, we present our main contribution: an objectoriented design pattern for DSL program monitoring. This pattern offers a principled approach for the integration of monitoring tools with DSL runtimes. The presentation of the pattern relies on a visitor-based implementation of an interpreter encoding the standard semantics of the DSL. Nevertheless, this pattern can be easily adapted to integrate with other techniques for implementing interpreters, such as the interpreter pattern, or switch-based dispatch. From a high-level point of view, executing a computer program translates to traversing, in a predefined order, an abstract syntax tree (AST) representing the program source code. The valuation function of the language semantics associated to each AST element is executed and the collected
74
code of the standard interpreter (e.g., for adding monitoring to a closed-source proprietary DSL), thus satisfying Req 7. Furthermore, compared to Kishon’s monitoring semantics, in which the monitor syntax is disconnected from the monitor semantics, the monitoring pattern connects the two through the MonitorLink concepts, thus treating the monitor as a proper language construct. Moreover, this association has the desirable property of contextualizing the syntax used by a monitoring tool, relieving the syntax disjointness constraint imposed in [17]. This is essential to enable the integration of independent monitoring tools like DSprofile [27] or Moldable Debugger [3]. Lastly, as opposed to other approaches that integrate monitoring into the language runtime [4, 28], the DSL monitoring pattern ensures the isolation of the interpreter state from the monitor state, thus offering the premises for creating a pluggable and composable monitoring infrastructure. The horizontal layers in Fig. 3 highlight the separation of the syntax (top layer) and the semantics (bottom layer), with an intermediate layer. This intermediate layer is an objectoriented artefact through which the syntax is linked to a concrete semantics in a modular way. The IVisitor interface provides a contract rooted on the syntax definition through which a semantics can be defined. The IDecoratorVisitor provides a similar contract for the monitoring valuation function that is linked to the decorated AST. The decorator pattern is used to decorate the AST. Each decoration node (instances of Decorator) holds an instance of the MonitorLink, which associates to each monitoring annotation its semantics, implemented by the concrete instances of the Monitor class. The three vertical layers in Fig. 3 emphasize the correspondence with the elements of Kishon’s formal framework: the standard interpreter (left), the monitor specification (right), and the composition layer that connects the language to the monitors. The following sections present each layer in detail. Sec. 4.2 presents the visitor-based standard interpreter assumed in this paper. Sec. 4.3 presents the monitor specification layer offering the support for creating domain-specific monitoring tools and enabling the integration of existing monitoring tools. Sec. 4.4 discusses the generic composition layer through which the monitoring tools are combined with the standard semantics. Sec. 4.5 and Sec. 4.6 discuss two simple extensions of the DSL monitoring pattern needed to achieve monitor composition and support for unanticipated monitoring. 4.2
a set (the Element class). The different categories of syntactic terms are identified through subclassing. Each syntactic term implements an accept method, which, accepting a visitor as parameter, provides an extension point through which an arbitrary valuation function can be attached. Semantic domains and arguments Evaluating a language term modifies the state of the interpreter, i.e., the context of its evaluation (environment, store, etc.). This state is specified in the EvaluatorState class, which gathers the semantic arguments (from the language semantic domains). These are accessed and updated through operations defined in the Evaluator class. Interpreter The interpreter is specified by implementing the IVisitor contract in the Evaluator class while binding the template parameter of IVisitor to the semantic domain of values (T- >Value), which corresponds to the intermediate evaluation results (of the IntermediateValue domain) in the formal framework. The valuation function of each syntactic term is then specified by implementing the corresponding visit method. During the AST traversal these valuation functions are invoked through a double-dispatch on the syntactic terms via the accept method. 4.3
Monitor Specification
To satisfy the genericity requirement (Req 3) and to facilitate tool integration (Req 8) the monitor specification should be treated as a proper language construct, which enables the specification of monitoring programs. These programs would be associated to the syntactic terms of the monitored program and would be evaluated during AST traversal by a monitoring evaluator that weaves the monitor semantics into the standard semantics. To achieve this, the monitor specification is split into two distinct parts: the syntax and the semantics that are linked together. In Fig. 3, the monitor syntax is represented by the abstract Annotation class, which will be specialized in a concrete monitor implementation to capture the monitorspecific language. As in the monitored language, the monitor semantic domains (i.e., its execution data) are accessed and updated by dedicated operations. In Fig. 3, these semantics domains are captured by the abstract MonitorState class. The valuation functions of the monitor are captured by the pre and post methods of the abstract Monitor class, which constains a reference to a monitor state. During the evaluation of the monitored program by the monitoring interpreter when an annotation is reached, calls to the pre and post methods wrap the evaluation of the annotated syntactic term. During these calls the pre and post methods evaluate the monitor syntax in the context composed of the monitor state, which can be accessed and updated, and the standard interpreter state, which can be queried. At this stage, the access to the standard interpreter state can be controlled by various policies. Implemented through a facade pattern, these policies enable different degrees of access to the interpreter
Visitor-Based Standard Interpreter
Traditional object-oriented implementations of a language interpreter leverage the Visitor design pattern. The following paragraphs overview the conceptual link between a language specification and its representation via the visitor pattern. Abstract syntax tree The abstract syntax of a language is described as a set of classes (a.k.a a meta-model). To simplify the pattern description, Fig. 3 shows only one element of such
75
Figure 3. DSL Monitoring Pattern. The classes added to realize the pattern are represented with white background. state needed either to guarantee the non-interference of the monitor with the standard interpreter (a read-only access policy – Req 2) or to control the state modification (Req 10). The instances of the MonitorLink class connects the monitor syntax to its semantics. Practically, the monitor link holds references to the annotation and to the concrete monitor valuation functions. When the monitoring evaluator calls the pre and post methods, the instance of the monitor link delegates these calls to the associated Monitor instance passing the linked syntactic element as an argument. Compared to Kishon’s monitoring semantics, in this approach the monitored syntactic term is annotated not only with the monitor’s syntax, but also with the monitor link that represents the monitoring program along with its interpretation methods. 4.4
and b) defines a special accept method, presented in Listing 1, which either transparently forwards to the evaluation of the original AST element when the execution is performed with the standard interpreter, or dispatches the evaluation of the Decorator to a dedicated valuation function when the program is interpreted with the monitoring interpreter. Listing 1. Accept method of the Decorator public T accept ( IVisitor v ) { if ( v instanceof I D e c o r a t o r V i s i t o r ) return (( I D e c o r a t o r V i s i t o r ) v ) . visit ( this ) ; else return getOriginal () . accept ( v ) ; }
Monitoring evaluator The meaning of inheritance in a functional setting gives a correspondance between our approach and Kishon’s monitoring semantics: the Gi functional is transliterated into the Evaluator class, and its extension Gi with monitoring functions becomes a specialization of the evaluator class, namely of the MonitoringEvaluator class. The monitors are weaved into the evaluator indirectly through the decorated elements, which are interpreted by the MonitoringEvaluator class. Similarly to Kishon’s monitoring semantics, the valuation function associated with the Decorator wraps the valuation function of the decorated node (accessed through double-dispatch on the syntactic term) with the calls to the pre and post methods of the monitor (which in our case are accessed through a MonitorLink instance). This valuation function is implemented in the visit method of the MonitoringEvaluator as shown in Listing 2.
Composition Layer
Adding monitoring support to a DSL language runtime relies on two operations: the annotation of the syntactic terms of the DSL program with monitoring information, and the interpretation of the added monitoring information during the program execution. The monitoring pattern achieves these two operations by extending the syntax of the language with a decorator and by extending the language semantics with a valuation function associated to the decorator. Element annotation To inject annotation on the syntactic terms, two strategies are possible: either the abstract syntax terms are extended, as suggested in [17], to mark the presence of monitoring information (i.e., adding an annotation attribute to the Element class), or a new class of syntactic terms are added to the language to decorate the existing terms. To keep the monitoring infrastructure independent of the syntax specification, we have employed the second strategy, which does not require the modification of the language abstract syntax. We achieve this by using the well known Decorator pattern that enables adding new behavior to an existing object without affecting the behavior of other objects of the same class. To achieve completeness (Req 1), for each syntactic term that needs to be monitored, we defined a Decorator element which a) holds a reference to a MonitorLink instance, which holds the monitoring program (See Fig. 3),
Listing 2. Visit method on the MonitorEvaluation class public Value visit ( Decorator dNode ) { MonitorLink link = dNode . getLink () ; link . pre ( dNode . getElement () , this ) ; Value result = dNode . getElement () . accept ( this ) ; link . post ( dNode . getElement () , result , this ) ; return result ; }
If no annotation is present, the behavior of the monitoring interpreter defaults to the inherited standard interpreter via its visit methods. The decorator visit method returns the result of the original term evaluation (without the monitoring information). The
76
with the standard evaluator at the root wrapped by an arbitrary number of monitors. In Fig. 4, we present a simple extension to the DSL monitoring pattern in Fig. 3 that provides this functionality. The key idea of this feature is the creation of a composite monitor, which integrates the monitoring results of primitive monitors organized in a hierachical manner. Fig. 4 shows how the extension of the DSL monitoring pattern can be achieved through the usage of the composite design pattern [9] applied to the MonitorLink class. The MonitorLink class becomes an abstract class with two subclasses, the LeafLink, which connects the syntax of a monitor to its semantics; and the CompositeLink, which aggregates link instances (either primitive or composite). The behavior of the pre and post methods of MonitorLink, in Fig. 3, is moved to the LeafLink classes, and in the CompositeLink class these methods delegate their behavior to the aggregated LeafMonitor instances. The application of the composite pattern to the MonitorLink entity guarantees the integrity of the monitors as proper language constructs (composed of the syntax-semantics tuple), which, as already mentioned, improves the modularity of the monitors. The support for inter-monitor dependencies is achieved through the owner field in the abstract MonitorLink class, which offers access to the surrounding scope of a monitor. By accessing its surrounding scope (the composite of which it is a part) a monitor can gain access to the state of the monitors that dominate it in the hierarchy (much like the lexical scope in programming languages). Through this simple extension, the DSL monitoring pattern offers a practical support for satisfying the composability requirement (Req 4). To facilitate composition, the monitoring infrastructure should provide an API for achieving common tasks, such as the surrounding scope lookup. Moreover, the monitoring tool designers should collaborate by exposing an API for accessing the MonitorState of their tools. However, these issues are outside the scope of this paper, which focuses on providing the premises for future work in these directions.
Figure 4. Composable monitors by applying the composite pattern to the MonitorLink class. The grayed classes are added to show the relation between the composite link and the monitoring pattern presented in Fig. 3. resulting final monitoring state is accessed by querying the concrete Monitor instances to which the MonitorLink instances are associated. In doing so, the monitoring evaluator is generic and independent of both the monitored language and the monitoring tools (Req 3). However, in a statically typed DSL implementation language (such as Java), a specific Decorator class needs to be defined for each class of syntactic term it decorates. Through the creation of multiple decorators, visitor interfaces and visit methods may seem tedious, these can easily be generated from a language meta-model definition. The signature of such a generator function would be: void genMonit(List terms, Class iV, Class eval), where terms are the metaclasses corresponding to the syntactic terms to be annotated, iV is the corresponding IVisitor interface, and the eval is the Evaluator class. Such a generation function will simply generate the DSL specialized subclasses and the needed methods required for interfacing the existing language semantics with the monitoring tools (the composition layer in Fig. 3). 4.5
Composable Monitors
During diagnosis sessions it can be useful to analyze the program execution with multiple monitoring tools to obtain aggregated monitoring results or to drive the execution of a monitor using the results from another monitor (dependencies between monitors). The first case is needed, for instance, by a coverage tool that integrates statement coverage (through a profiler-like tool) and data coverage (through a collector). A practical instance needing support for dependencies between monitors is a conditional breakpoint (in a debugger) enabled by a profiling result, such as a condition over the number of activations of a method. Neither of these scenarios is easily supported by the existing monitoring infrastructures. Moreover, in an instrumentation-based monitoring infrastructure, it may be difficult to distinguish the original code from the instrumented code rendering monitoring composition very challenging. Kishon’s monitoring semantics provides a solution to this problem by viewing the monitoring evaluator as a standard evaluator that can be further composed with other monitors. The result can be seen as a composite evaluator
4.6
Unanticipated Monitoring via Pluggable Monitors
The pattern presented in this paper enables the DSL developers to perform unanticipated monitoring activities (Req 5) by offering the possibility to create custom program monitors. The monitors are picked up and evaluated by the MonitoringEvaluator, which interprets the newly added monitoring decoration by dispatching the associated pre and post methods. This already is an improvement over Kishon’s monitoring semantics that requires updating the monitoring evaluator with the new monitoring pre and post functions. However, this functionality requires the program to be executed with the MonitoringEvaluator from the beginning. Listing 3. Accept method for pluggable monitoring public Value accept ( IVisitor v ) {
77
lue). The FunctionValue instances represent closures: an expression along with its declaration environment and formal parameters. The environment has a parent attribute, which represents the lexical scope of the current environment and a lookup method for hierarchical variable access.
MonitorLink link = this . getLink () ; link . pre ( this . getElement () , this ) ; Value result = this . getElement () . accept ( this ) ; link . post ( this . getElement () , result , this ) ; return result ; }
This problem can be addressed with a simple modification of the monitoring pattern, which enables monitor evaluation directly using the standard evaluator. This variation, presented in Listing 3, achieves this by integrating the pre/post methods dispatch in the accept method of the Decorator, thus relieving the need for a special MonitoringEvaluator class. This can be seen as an incarnation of the AST interpreter pattern [9] applied on the program monitoring infrastructure. In this case, when the standard interpreter reaches a node decorated with a monitor, the control flow of the interpreter is wrapped in the accept method by the monitoring pre and post methods. This variation of the pattern would be natural to implement if the standard interpreter itself is implemented using the AST intepreter pattern. However, in a visitor-based interpreter, it affects the homogeneity of the language runtime implementation. Nevertheless, we believe that this loss of source-code homogeneity is worthwhile to offer support for unanticipated monitoring in long-running systems (Req 5).
5.
Visitor-based evaluator implementation. The context of execution is an instance of the EvaluatorState class encapsulating the environment in the form of a stack of Environment instances. Variables are accessed in the context through a lookup method on EvaluatorState, and constants are directly mapped to values. An abstraction is evaluated to a FunctionValue instance. The evaluation of the expression inside a function value is delayed to application evaluation. In a conditional, the guard is evaluated first, conditioning the evaluation of the true or false branches. The application of an expression e1 to an argument e2 is evaluated by evaluating first e2 then e1 , and applying the value of e1 to the one of e2 . In our case study, the value of e1 is a FunctionValue instance. A letrec clause binding a variable x with an abstraction a and a body expression e is evaluated as follows: a new binding environment containing x mapped to the evaluation of its abstraction is pushed, reflecting the recursive definition of the environment as would be found in a typical functional-based definition; e is then evaluated within this environment scope.
An Application for Lambda-Calculus
To show the practicability of our approach, we applied the DSL monitoring pattern to a simple functional language runtime implemented in Java (outlined in Sec. 5.1). Through this experience, we show that a) the monitoring infrastructure is amenable to code generation, which eases the application of the pattern on DSLs with a large number of syntactic terms (Sec. 5.2); b) the monitoring pattern enables the development of custom monitors (Sec. 5.3.1); and c) it facilitates the integration of existing monitoring tools (Sec. 5.3.2). The Java code of the experiments discussed here can be found at https://github.com/monitorpattern/ sle2016. Following the specification of Kishon and Hudak [16] this code equally contains a collector, and an interactive debugger. Moreover, the interested readers can check our Smalltalk instantiation of this pattern at http: //smalltalkhub.com/#!/~CipT/MonLambda. 5.1
5.2
Composition Layer
Based on the language and its standard evaluation runtime presented in the previous section, in this section we describe the instantiation of the composition layer (Fig. 5, middle vertical layer), which creates the bridge towards monitoring tools. To identify the decorators needed for monitoring all the syntactic terms of a DSL we need to analyze its AST for identifying the language constructs and their usage. Of particular interest is the usage of specialized language constructs by the AST nodes. All AST nodes in our case study specialize the abstract class Expression (Fig. 5, top-left). The Expression instances that are contained in the AST nodes Abstraction, Application, Conditional and LetRec, can be decorated using a unique expression decorator class (ExpressionDec in the figure). However, instances of specialized classes, i.e., which are not direct Expression instances, require specific decorator classes. For example, the letrec construct that binds a variable to an abstraction is defined by the LetRec class, which is composed of a Variable and an Abstraction. As a result, to support monitoring during the evaluation of these instances, two new decorator classes are added (VariableDec and AbstractionDec). While multiple decorator classes may be needed, the accept method of these classes can be seen as parameterized instantiations of the accept method presented in Listing 1, which downcasts the IVisitor argument to the dedicated IDecoratorVisitor instance when accepting a MonitoringEvaluator instance. In our case, the accept methods downcast the LambdaVisitor instance to the IExpressionDecVisitor for an Ex-
A Visitor-Based Interpreter for Lambda-Calculus
To illustrate our approach, we consider an (eager and call-byvalue) evaluator for a simple lambda-calculus. The abstract syntax and domains are illustrated in the vertical standard interpreter layer of Fig. 5. All nodes inherit the Expression class and define traditional constructs of a lambda-calculus language including application, abstraction, and letrec (for conciseness the associations between the syntactic terms are not shown in the figure). Two semantic domains are defined: denotable values (Value) and environments (Environment), that are maps of entries (identifiers, values). Denotable values are either primitive values (e.g., Integer) or function values (FunctionVa-
78
Figure 5. Abstract syntax and semantic domains of a lambda-calculus pressionDec instance, IVariableDecVisitor for a VariableDec instance, and IAbstractionDecVisitor for and AbstractionDec instance. Thus, when the monitoring evaluator evaluates a decorator, according to its type, the correct visit is invoked. The decorator visitor interfaces specialize the IVisitor interface, LambdaVisitor in our case, adding a dedicated visit method which offers the extension points for attaching the monitoring pre/post methods. The monitoring evaluator LambdaMonitoringEvaluator extends the standard evaluator LambdaEvaluator with three methods required by the decorator visiting contracts. These methods can be seen as instantiations of the visit method in Listing 2 parameterized by the specific decorator type. 5.3
void post ( Expression e , TracerSyntax a , Denot ableVal ue v , La m bd aV al u at io n eval ) { state . outdent () ; state . addReturn ( a . getName () ,v . toString () ) ;}}
The simple tracer presented in this section supports trace collection and a tree-like visualization. Listing 4 shows its implementation as a monitor using our approach 1 . It is composed of three classes: TracerSyntax, representing the monitor syntax, which associates a named tracepoint to a list of traced arguments; TracerState, representing the semantic domain, which defines the trace structure (a String in our case); and Tracer, representing the semantics, which encodes the tracer valuation functions. The tracer leverages the monitored language lookup mechanism to retrieve the state of the function arguments. A typical usage scenario is presented in Listing 5, which traces the execution of a factorial function. A tracer instance is created and assigned to a variable named tracer (line 1). Two tracepoints are linked to the tracer instance (lines 2-3 – note that the tracer annotation is given as a string, which supposes the existence of a specific parser): the first one traces the execution of the multiplication expression along with its arguments and the second one traces the execution of the body of the factorial function, storing the x argument in the trace. The program AST is obtained by parsing the source-code (lines 5-8). The AST is decorated, wrapping the traced expression with ExpressionDec instances referencing the MonitorLink instances. In Listing 5, the decoration step is not explicitly shown, but the [linki ]exp instructions (lines 6-7) indicate the start of the subtree decorated with an ExpressionDec instance 2 ). The decorated AST can now be evaluated using the LambdaMonitoringEvaluator evaluator (line 9). The program evaluation returns the standard evalua-
Monitors for a Lambda-Calculus
The previous section illustrated the addition of the monitoring pattern composition layer to a simple language runtime. In this section we illustrate the usage of the monitor specification layer (Fig. 5, right vertical layer) to create custom monitors, and to integrate existing monitoring tools. 5.3.1
A Custom Tracer
A tracer records information, known as a trace, during program execution. The traces are typically visualized and manipulated by postprocessing tools during program diagnosis. Listing 4. A Tracer implementation public class TracerSyntax extends Annotation { String name ; String [] args ; } public class TracerState extends MonitorState { String trace ; } public class Tracer extends Monitor { TracerState state ; void pre ( Expression e , TracerSyntax a , L am bd aV a lu at i on eval ) { String astr = " " ; for ( String arg : a . getArgs () ) astr += arg + " : " + eval . getEnv () . lookup ( arg ) ; state . addReceive ( a . getName () , argstr ) ; state . indent () ; state . add ( " \ n " ) ; }
1 Some
methods are omitted for concision, please refer to the associated source-code for a complete reference 2 Note that the [link ] i exp annotations are not part of the monitored language syntax and in a practical setting they will be added through a specialized IDE operation
79
14 ms total time; 14 ms profiled time (95.9%) 1003 profile records Total Total Self Self Desc Desc Count Count ms % ms % ms % % 14 99.6 0 0.6 13 98.9 1 0.1 [1] 13 98.9 3 26.8 10 72.1 201 20.0 [2] 13 98.4 2 17.5 11 80.9 200 19.9 [3] 13 98.3 4 33.0 9 65.3 200 19.9 [4] 1 12.1 1 12.1 0 0.0 200 19.9 (- x 1) 1 10.0 1 10.0 0 0.0 201 20.0 (= x 0)
tor result, 24 in our case (4! =24). The tracer can be queried for the stored results, which in our example are in a tree-like representation to show the depth of the recursive calls (lines 12-25). Listing 5. Tracer usage and evaluation results 1 2 3
tracer = new Tracer () ; link1 = new MonitorLink ( " mult ( x y ) " , tracer ) ; link2 = new MonitorLink ( " fac ( x ) " , tracer ) ;
[1] letrec fact=\x.if (= x 0) then 1 else (* x (fact (+ x -1))) in (fact 200) [2] if (= x 0) then 1 else (* x (fact (+ x -1))) [3] (* x (fact (+ x -1))) [4] (fact (+ x -1))
4 5 6 7 8
9 10 11 12 13 14 15 16 17 18 19 20 21 22 23 24 25
ast = new LambdaParser ( " letrec mult =\ x .\ y . [link1 ]exp (* x y ) in letrec fact =\ x . [link2 ]exp if (= x 1) then 1 else ( mult x ) ( fact ( - x 1) ) in fact 4"); ast . accept ( new L a m b d a M o n i t o r i n g E v a l u a t o r () ) ; tracer . printTrace () ; - - - - - - - - - T RACING R ESULTS - - - - - - - - [# fac receives ( x :4 ) ] | [# fac receives ( x :3 ) ] | | [# fac receives ( x :2 ) ] | | | [# fac receives ( x :1 ) ] | | | [# fac returns 1] | | | [# mult receives ( x :2 y :1 ) ] | | | [# mult returns 2] | | [# fac returns 2] | | [# mult receives ( x :3 y :2 ) ] | | [# mult returns 6] | [# fac returns 6] | [# mult receives ( x :4 y :6 ) ] | [# mult returns 24] [# fac returns 24]
5.3.2
Figure 6. Profiling result with DSProfile lus. Listing 6 shows the profiler specification. In this case, the monitor specification does not have an annotation attached, because the profiler activation by the monitoring evaluator can be seen as a syntactic indication (approach similar to unconditional breakpoints in a debugger). For brevity, we have decided to embed the state of this profiler, represented by a Stack, as an instance variable in the DSProfiler class (subclass of Monitor). The pre method of this profiler creates a new profiling record, which associates the corresponding AST node, and pushes the identifier of the record on the stack. The post method closes the profiling record on top of the stack and pops it. Fig. 6 shows the results of profiling the execution of a factorial function applied to the integer constant 200. The first column shows the total time taken by the evaluation of a profiled element, the second column shows the percentage of the total time spent during the same evaluation. The third and forth columns show the time (total and percentage) taken for the evaluation of the profiled element (without sub-elements), the fifth and sixth columns show the time spent evaluating descendents (sub-elements of the current AST node). The last two columns count the times each element was evaluated. From the results we observe that the evaluation time was 14 milliseconds; the conditional was evaluated (Count column) 201 times (200 times for the recursive factorial call and once for the default case x = 0), and the recursive call to the fact function took 65% of the execution time.
Integrating an Off-the-Shelf Profiler
Profiling tools for GPLs, such as gprof [10], monitor the execution of a program to capture control-flow information and execution time characteristics of different syntactic terms (e.g., function calls). Though usable for monitoring DSL programs, the GPL profilers suffer from an abstraction problem presenting the programmer with a low-level view (execution platform) of the execution of the DSL high-level concepts. To bridge this gap, Sloane et al. proposed DSProfile [27], a profiling library that is independent of the problem domain and that, through an event-based observation mechanism, captures domain-specific profiling information in a hierarchical model. Listing 6. A monitor using DSProfile
6.
public class DSProfiler extends Monitor { Stack < Long > state = new Stack < >() ; public void pre ( Expression node , Annotation ann , L am b da Va lu a ti on eval ) { long sID = JavaProfiler . start ( JavaProfiler . tuple ( " time " , node ) ) ; state . push ( sID ) ; } public void post ( Expression node , Annotation ann , Denotab leValue val , L am bd aV a lu at i on eval ) { JavaProfiler . finish ( state . pop () , JavaProfiler . tuple ( " time " , aNode ) ) ; }}
Related Work
The need for easy development of DSL monitoring tools is widely acknowledged by the programming language [11, 12, 14] and software engineering [13, 20] communities. Frameworks, patterns [4] or generative approaches [1, 13] facilitate the development and the integration of monitoring tools for DSLs. For example, Bousse et al. propose a generative approach to produce specialized debuggers based on a generic debug and trace meta-model specific to the language domains. This approach is built on top of the GEMOC Studio language workbench. In contrast to our approach, the relationship between the debugger and the language operational semantics is not made explicit. Our approach could serve
In this section, we discuss the integration of DSProfile as a profiling tool for our external DSL, the simple lambda calcu-
80
as a layer on top of such generative approaches, to ease the construction and the integration of other monitoring tools. A range of approaches for defining special purpose monitors for DSLs have been proposed, like debuggers [3, 28] or profilers [25, 27]. For example, Vrany et al. [28] define a debuggable interpreter design pattern that extends a language interpreter with debugging operations (i.e., breakpoint, step into, step over). The implementation of this pattern consists of adding debugging hooks on an interpreter based on the Visitor or the Interpreter patterns. The monitoring pattern presented in this study can be seen as a generalization of the debuggable design pattern where the debugger, activated through pre/post statements, would be a particular instance of a monitor. Frameworks like the Moldable Debugger Model [3] for interactive debugging or MetaSpy for profiling [25] enable the debugging and profiling of domain-specific applications or embedded DSLs. For example, the Moldable Debugger Framework is aimed at monitoring at the application-level in the sense that the runtime of the application is observed to perform debugging actions. Moreover, both the Moldable Debugger Model and MetaSpy rely at least partially on meta-programming facilities (i.e., reflection mechanism), as opposed to the monitoring pattern approach presented in this study. Nevertheless, it will be interesting to study the complementarity between the monitoring pattern and these frameworks to ease the task of building interactive debuggers for DSLs. Jahier et al. propose a high-level monitoring primitive based on event-oriented tracer for the target DSL [14]. In doing so, monitors can be built separately of compilers for the target languages. The states of a program execution can be captured by an event list composing an execution trace, which can be then processed through the monitoring primitive. However, its implementation is not integrated into a methodology. In contrast, providing a pattern offers a guidance that can ease the definition of execution monitors. In this sense, we believe that such an approach would integrates better in a software engineering process. Wang et. al propose an approach to generate infrastructure tools, based on denotational definitions using Horn clauses [29]. However, it is not clear how development tools (e.g., profilers or debuggers) can be generated using a common methodology, as fostered by the use of a design pattern. Lindeman et. al propose a generic debugger generation framework, integrated in the Spoofax language workbench [19]. In constrast to our approach, reflection mechanisms need to be provided to extract debug information. Brant defines method wrappers for implementing monitoring tools [2]. This solution proposes the use of reflective facilities of the host language to extend the behavior of existing methods with before and after statements. However, in contrast to our approach, this technique is applicable only to languages that support behavioral reflection, which could
further be undesirable in some cases involving security constraints. General purpose Application Programming Interfaces also exist for supporting the development of monitors [30], such as the Eclipse Debugging Framework [6]. Such libraries can be used with our approach to provide a graphical interface for the monitors.
7.
Conclusion
DSL program monitoring is the core infrastructure needed for supporting the program validation and maintenance tasks. After defining ten requirements needed for creating a DSL monitoring infrastructure, this paper presented an object-oriented design pattern for DSL program monitoring. This pattern provides a practical answer to the problem of interfacing monitoring tools with existing DSL runtimes. Inspired by the monitoring semantics introduced by Kishon et al. [17], this pattern provides an object-oriented monitoring infrastructure. To achieve this, the language syntax and its evaluator are simply extended through inheritance, which facilitates the portability (Req 6) and eases the integration with arbitrary DSL runtimes (Req 7). To achieve completeness (Req 1) our approach proposes the use of the Decorator pattern offering the possibility to annotate all syntactic terms. This infrastructure mediates the connection between the DSL runtime and the different monitoring tools, thus providing a controllable trade-off between the conflicting non-interference requirement (Req 2) and the potential need of breaking the language barriers to facilitate diagnosis (Req 10) . Moreover, the monitoring tools are treated as proper language constructs, providing a modular and reusable conceptual framework for specifying domain-specific monitors, which answer the genericity (Req 3) and the external tool integration (Req 8) requirements. Furthermore, two extensions of the pattern were presented to address the composable (Req 4) and unanticipated monitoring (Req 5) requirements. The practicability of our approach was shown by adding monitoring support to a simple lambda calculus. We developed a tracer illustrating the creation and usage of a custom monitor coupled with the language runtime. The integration of an off-the-shelf domain-specific profiler, showed that the DSL monitoring pattern facilitates the integration of existing tools. The DSL monitoring pattern maximizes the level of knowledge transfer by providing a generic solution to the monitoring infrastructure problem. This pattern can be instantiated by DSL designers and supported by the developers of domain-specific monitoring tools. In the future, the generalization of this pattern to a monitoring framework will facilitate its integration in language workbenches, such as Spoofax [19]. Moreover, it will be interesting to evaluate the adequacy of this pattern for monitoring concurrent and/or parallel DSLs, which, amongst others, poses the problem of distributed checkpoints.
81
References
TN, USA, OOPSLA Companion ’08, pages 791–794. ACM, 2008.
[1] E. Bousse, J. Corley, B. Combemale, J. Gray, and B. Baudry. Supporting efficient and advanced omniscient debugging for xdsmls. In Proceedings of the 2015 ACM SIGPLAN International Conference on Software Language Engineering, Pittsburgh, PA, USA, SLE 2015, pages 137–148. ACM, 2015.
[12] G. Gupta. Language-based software engineering. Science of Computer Programming, 97, Part 1:37 – 40, 2015. Special Issue on New Ideas and Emerging Results in Understanding Software.
[2] J. Brant, B. Foote, R. E. Johnson, and D. Roberts. Wrappers to the rescue. In Proceedings of the 12th European Conference on Object-Oriented Programming, Brussels, Belgium, ECOOP ’98, pages 396–417. Springer-Verlag, 1998.
[13] P. R. Henriques, M. J. V. Pereira, M. Mernik, M. Lenic, J. Gray, and H. Wu. Automatic generation of language-based tools using the lisa system. IEE Proceedings - Software, 152(2): 54–69, April 2005.
[3] A. Chis¸, M. Denker, T. Gˆırba, and O. Nierstrasz. Practical domain-specific debuggers using the moldable debugger framework. Computer Languages, Systems & Structures, 44, Part A: 89 – 113, 2015. Special issue on the 6th and 7th International Conference on Software Language Engineering (SLE 2013 and SLE 2014).
[14] E. Jahier and M. Ducass´e. Generic and efficient program monitoring by trace analysis. CoRR, cs.PL/0311016, 2003.
[4] B. Combemale, X. Cregut, and M. Pantel. A design pattern to build executable dsmls and associated v&v tools. In Proceedings of the 2012 19th Asia-Pacific Software Engineering Conference - Volume 01, Hong Kong, China, APSEC ’12, pages 282–287. IEEE Computer Society, 2012.
[16] A. Kishon and P. Hudak. Semantics directed program execution monitoring. J. Funct. Program., 5(4):501–547, 1995.
[15] A. Kennedy. Compiling with continuations, continued. In Proceedings of the 12th ACM SIGPLAN International Conference on Functional Programming, Freiburg, Germany, ICFP ’07, pages 177–190. ACM, 2007. doi: 10.1145/1291151.1291179.
[17] A. Kishon, P. Hudak, and C. Consel. Monitoring semantics: A formal framework for specifying, implementing, and reasoning about execution monitors. In Proceedings of the ACM SIGPLAN 1991 Conference on Programming Language Design and Implementation, Toronto, Ontario, Canada, PLDI ’91, pages 338–352. ACM, 1991.
[5] W. Cook and J. Palsberg. A denotational semantics of inheritance and its correctness. In Conference Proceedings on Object-oriented Programming Systems, Languages and Applications, New Orleans, Louisiana, USA, OOPSLA ’89, pages 433–443. ACM, 1989. doi: 10.1145/74877.74922.
[18] T. Kosar, S. Bohra, and M. Mernik. Domain-specific languages: A systematic mapping study. Information and Software Technology, 71:77 – 91, 2016.
[6] Eclipse. Eclise debugging framework. http: //citeseerx.ist.psu.edu/viewdoc/download?doi= 10.1.1.526.7320&rep=rep1&type=pdf, 2010.
[19] R. T. Lindeman, L. C. Kats, and E. Visser. Declaratively defining domain-specific language debuggers. In Proceedings of the 10th ACM International Conference on Generative Programming and Component Engineering, Portland, Oregon, USA, GPCE ’11, pages 127–136. ACM, 2011.
[7] S. Erdweg, T. van der Storm, M. V¨olter, M. Boersma, R. Bosman, W. R. Cook, A. Gerritsen, A. Hulshout, S. Kelly, A. Loh, G. D. P. Konat, P. J. Molina, M. Palatnik, R. Pohjonen, E. Schindler, K. Schindler, R. Solmi, V. A. Vergu, E. Visser, K. van der Vlist, G. H. Wachsmuth, and J. van der Woning. Software Language Engineering: 6th International Conference, SLE 2013, Indianapolis, IN, USA, October 26-28, 2013. Proceedings, chapter The State of the Art in Language Workbenches, pages 197–217. Springer International Publishing, 2013.
[20] R. Mannadiar and H. Vangheluwe. Debugging in domainspecific modelling. In Proceedings of the Third International Conference on Software Language Engineering, Eindhoven, The Netherlands, SLE’10, pages 276–285. Springer-Verlag, 2011. [21] N. Matloff and P. J. Salzman. The Art of Debugging with GDB, DDD, and Eclipse. No Starch Press, 2008.
[8] M. Felleisen, M. Wand, D. Friedman, and B. Duba. Abstract continuations: A mathematical semantics for handling full jumps. In Proceedings of the 1988 ACM Conference on LISP and Functional Programming, LFP ’88, pages 52–62, New York, NY, USA, 1988. ACM. doi: 10.1145/62678.62684. URL http://doi.acm.org/10.1145/62678.62684.
[22] M. Mernik, J. Heering, and A. M. Sloane. When and how to develop domain-specific languages. ACM Computing Surveys, 37(4):316–344, Dec. 2005. doi: 10.1145/1118890.1118892. [23] B. Plattner and J. Nievergelt. Special feature: Monitoring program execution: A survey. Computer, 14(11):76–93, Nov. 1981. doi: 10.1109/C-M.1981.220255.
[9] E. Gamma, R. Helm, R. Johnson, and J. Vlissides. Design Patterns: Elements of Reusable Object-oriented Software. Addison-Wesley Longman Publishing Co., Inc., 1995.
[24] U. Reddy. Objects as closures: Abstract semantics of objectoriented languages. In Proceedings of the 1988 ACM Conference on LISP and Functional Programming, Snowbird, Utah, USA, LFP ’88, pages 289–297. ACM, 1988. doi: 10.1145/62678.62721.
[10] S. L. Graham, P. B. Kessler, and M. K. Mckusick. Gprof: A call graph execution profiler. In Proceedings of the 1982 SIGPLAN Symposium on Compiler Construction, Boston, Massachusetts, USA, SIGPLAN ’82, pages 120–126. ACM, 1982.
[25] J. Ressia, A. Bergel, O. Nierstrasz, and L. Renggli. Modeling domain-specific profilers. Journal of Object Technology, 11 (1):1–21, 2012.
[11] J. Gray, K. Fisher, C. Consel, G. Karsai, M. Mernik, and J.-P. Tolvanen. Dsls: The good, the bad, and the ugly. In Companion to the 23rd ACM SIGPLAN Conference on Object-oriented Programming Systems Languages and Applications, Nashville,
[26] D. A. Schmidt. Detecting global variables in denotational specifications. ACM Transactions in Programming Languages
82
and Systems, 7(2):299–310, Apr. 1985. doi: 10.1145/3318. 3323.
chapter A Debugger for the Interpreter Design Pattern, pages 73–85. Springer Berlin Heidelberg, 2009.
[27] A. M. Sloane and M. Roberts. Domain-specific program profiling and its application to attribute grammars and term rewriting. Science of Computer Programming, 96, Part 4: 488 – 510, 2014. Selected Papers from the Fifth International Conference on Software Language Engineering (SLE 2012).
[29] Q. Wang and G. Gupta. Rapidly prototyping implementation infrastructure of domain specific languages: A semantics-based approach. In Proceedings of the 2005 ACM Symposium on Applied Computing, Santa Fe, New Mexico, SAC ’05, pages 1419–1426. ACM, 2005.
[28] J. Vran´y and A. Bergel. Software and Data Technologies: Second International Conference, ICSOFT/ENASE 2007, Barcelona, Spain, July 22-25, 2007, Revised Selected Papers,
[30] H. Wu, J. Gray, and M. Mernik. Grammar-driven generation of domain-specific language debuggers. Software: Practice and Experience, 38(10):1073–1103, 2008.
83


![[PDF Online] Pattern Languages of Program Design 3 ... - Google Sites](https://m.moam.info/img/260x300/pdf-online-pattern-languages-of-program-design-3-g_64770a00097c474d228b82c4.jpg)
![[PDF] Download Pattern Languages of Program Design ... - Google Sites](https://m.moam.info/img/260x300/pdf-download-pattern-languages-of-program-design-g_6477134f097c4796708b4589.jpg)