Object Recognition in 3D Point Cloud of Urban Street Scene Pouria Babahajiani1 , Lixin Fan2 , Moncef Gabbouj3 1,2
3
Nokia Research Center, Tampere, Finland Tampere University of Technology, Tampere, Finland 1
[email protected] 2
[email protected] 3
[email protected]
Abstract. In this paper we present a novel street scene semantic recognition framework, which takes advantage of 3D point clouds captured by a high-definition LiDAR laser scanner. An important problem in object recognition is the need for sufficient labeled training data to learn robust classifiers. In this paper we show how to significantly reduce the need for manually labeled training data by reduction of scene complexity using non-supervised ground and building segmentation. Our system first automatically segments grounds point cloud, this is because the ground connects almost all other objects and we will use a connect component based algorithm to oversegment the point clouds. Then, using binary range image processing building facades will be detected. Remained point cloud will grouped into voxels which are then transformed to super voxels. Local 3D features extracted from super voxels are classified by trained boosted decision trees and labeled with semantic classes e.g. tree, pedestrian, car, etc. The proposed method is evaluated both quantitatively and qualitatively on a challenging fixed-position Terrestrial Laser Scanning (TLS) Velodyne data set and two Mobile Laser Scanning (MLS), Paris-rue-Madam and NAVTEQ True databases. Robust scene parsing results are reported.
1
Introduction
Automatic urban scene objects recognition refers to the process of segmentation and classifying of objects of interest into predefined semantic labels such as building, tree or car etc. This task is often done with a fixed number of object categories, each of which requires a training model for classifying scene components. While many techniques for 2D object recognition have been proposed, the accuracy of these systems is to some extent unsatisfactory because 2D image cues are sensitive to varying imaging conditions such as lighting, shadow etc. In this work, we propose a novel automatic scene parsing approach which takes advantage of 3D geometrical features extracted from Light Detection And Ranging (LiDAR) point clouds. Since such 3D information is invariant to lighting and shadow, as a result, significantly more accurate parsing results are achieved.
2
Pouria Babahajiani, Lixin Fan, Moncef Gabbouj
While a laser scanning or LiDAR system provides a readily available solution for capturing spatial data in a fast, efficient and highly accurate way, the enormous volume of captured data often come with no semantic meanings. We, therefore, develop techniques that significantly reduce the need for manual labelling of training data and apply the technique to the all data sets. Laser scanning can be divided into three categories, namely, Airborne Laser Scanning (ALS), Terrestrial Laser Scanning (TLS) and Mobile Laser Scanning (MLS). The proposed method is evaluated both quantitatively and qualitatively on a challenging TLS Velodyne data set and two MLS, Paris-rue-Madam and NAVTEQ True databases. 1.1
literature review
Automatic scene parsing is a traditional computer vision problem. Many successful techniques have used single 2D image appearance information such as color, texture and shape [1, 2]. By using just spatial cues such as surface orientation and vanishing points extracted from single images considerably more robust results are achieved [3]. In order to alleviate sensitiveness to different image capturing conditions, , many efforts have been made to employ 3D scene features derived from single 2D images and thus achieving more accurate object recognition [4]. For instance, when the input data is a video sequence, 3D cues can be extracted using Structure From Motion (SFM) techniques [5]. With the advancement of LiDAR sensors and Global Positioning Systems (GPS), large-scale, accurate and dense point cloud are created and used for 3D scene parsing purpose. In the past, research related to 3D urban scene analysis had been often performed using 3D point cloud collected by airborne LiDAR for extracting vegetation and building structures [6]. Hernndez and Marcotegui use range images from 3D point clouds in order to extract k-flat zones on the ground and use them as markers for a constrained watershed [7].Recently, classification of urban street objects using data obtained from mobile terrestrial systems has gained much interest because of the increasing demand of realistic 3D models for different objects common in urban era. A crucial processing step is the conversion of the laser scanner point cloud to a voxel data structure, which dramatically reduces the amount of data to process. Yu Zhou and Yao Yu (2012) present a voxel-based approach for object classification from TLS data [8]. Classification using local features and descriptors such as Spin Image [9], Spherical Harmonic Descriptors [10], Heat Kernel Signatures [11], Shape Distributions [12], and 3D SURF feature [13] have also demonstrated successful results to various extent. 1.2
Overview of the Proposed Framework
In this work, the ground is first segmented and building facades are subsequently detected based on range image morphological operations. We use voxel segmentation that relies on local features and descriptors, to successfully classify different segmented objects in the urban scene.
Object Recognition in 3D Point Cloud of Urban Street Scene
3
Fig. 1. Overview of the proposed framework
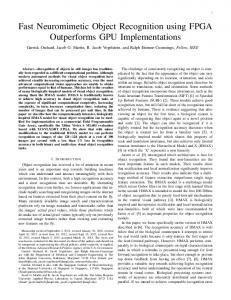
Figure 1 shows the overview of the proposed street scene object recognition pipeline, in which LiDAR Point Cloud (PC) is the input of the processing pipeline and result is PC segments assigned with different class labels. At the outset, the proposed parsing pipeline finds ground points by fitting a ground plane to the given 3D point cloud of urban street scene. Then, non-ground point cloud are projected to range images because they are convenient structure for visualization. Remaining data are processed subsequently to segment building facades. When this process is completed, range images are projected to the 3D point cloud in order to make segmentation on other remained vertical objects. We use a connect component based algorithm to voxilisation of data. The voxel based classification method consists of three steps, namely, a) voxilisation of point cloud, b) merging of voxels into super-voxels and c) the supervised scene classification based on discriminative features extracted from super-voxels. Using a trained boosted decision tree classifier, each 3D feature vector is then designated with a semantic label such as tree, car, pedestrian etc. The offline training of the classifier is based on a set of 3D features, which are associated with manually labeled super-voxels in training point cloud. Main contributions of this work are the following: • Develop a novel street object recognition method which is robust to different types of LiDAR point clouds acquisition methods. • Proposed two-stage (supervised and non-supervised) classification pipeline which requires only small amount of time for training. • Propose to use novel geometric features leads to more robust classification results (see section 3).
4
2
Pouria Babahajiani, Lixin Fan, Moncef Gabbouj
Methodology
It is a challenging task to directly extract objects from mobile LiDAR point cloud because of the noise in the data, huge data volume and movement of objects. We therefore take a hybrid two-stage approach to address the above mentioned challenges. Firstly, we adopt an unsupervised segmentation method to detect and remove dominant ground and buildings from other LiDAR data points, where these two dominant classes often correspond to the majority of point clouds. Secondly, after removing these two classes, we use a pre-trained boosted decision tree classifier to label local feature descriptors extracted from remaining vertical objects in the scene. This work shows that the combination of unsupervised segmentation and supervised classifiers provides a good trade-off between efficiency and accuracy. In this section we elaborate our point cloud classification approach. 2.1
Ground Segmentation
The aim of the first step is to remove points belonging to the scene ground including road and sidewalks, and as a result, the original point cloud are divided into ground and vertical object point clouds(Figure 2). The scene point cloud is first divided into sets of 10m×10m regular, non-overlapping tiles along the horizontal x–y plane. Then the following ground plane fitting method is repeatedly applied to each tile. We assume that ground points are of relatively small z values as compared to points belonging to other objects such as buildings or trees (see Fig. 2). The ground is not necessarily horizontal, yet we assume that there is a constant slope of the ground within each tile. Therefore, we first find the minimal-z-value (MZV) points within a multitude of 25cm×25cm grid cells at different locations. For each cell, neighboring points that are within a z-distance threshold from the MZV point are retained as candidate ground points. Subsequently, a RANSAC method is adopted to fit a plane to candidate ground points that are collected from all cells. Finally, 3D points that are within certain distance (d2 in Fig. 2) from the fitted plane are considered as ground points of each tile. The constant slope assumption made in this approach is valid for our data sets as demonstrated by experimental results in Section 3. The approach is fully automatic and the change of two thresholds parameters do not lead to dramatic change in the results. On the other hand, the setting of grid cell size as 25cm×25cm maintains a good balance between accuracy and computational complexity. 2.2
Building Segmentation
After segmenting out the ground points from the scene, we present an approach for automatic building surface detection. High volume of 3D data impose serious challenge to the extraction of building facades. Our method automatically extract building point cloud (e.g. doors, walls, faades, noisy scanned inner environment of building ) based on two assumptions: a) building facades are the
Object Recognition in 3D Point Cloud of Urban Street Scene
5
Fig. 2. Ground Segmentation. Left image: Segmented ground and remained vertical objects point cloud are illustrated by red and black color respectively. Right figure: sketch map of fitting plane to one tile.
highest vertical structures in the street; and b) other non-building objects are located on the ground between two sides of street. As can be seen in figure 3, our method projects 3D point clouds to range images because they are convenient structures to process data. Range images are generated by projecting 3D points to horizontal x–y plane. In this way, several points are projected on the same range image pixel. We count the number of points that falls into each pixel and assign this number as a pixel intensity value. In addition, we select and store the maximal height among all projected points on the same pixel as height value. We define range images by making threshold and binarization of I, where I pixel value is defined as Equation (1) Ii =
Pintensity Pheight + M ax Pintensity M ax Pheight
(1)
Where Ii is grayscale range image pixel value, Pintensity and Pheight are intensity and height pixel value and M ax Pintensity and M ax Pheight represent the maximum intensity and height value over the grayscale image. In the next step we use morphological operation (e.g. close and erode) to merge neighboring point and filling holes in the binary range images (see middle image in Fig. 3). Then we extract contours to find boundaries of objects. In order to trace contours, Pavlidis contour-tracing algorithm [14] is proposed to identify each contour as a sequence of edge points. The resulting segments are checked on aspects such as size and diameters (height and width) to distinguish building from other objects. More specifically, equation (2) defines the geodesic elongation E(X), introduced by Lantuejoul and Maisonneuve (1984), of an object X, where S(X) is the area and L(X) is the geodesic diameter. E(π) =
πL2 (X) 4S(X)
(2)
The compactness of the polygon shape based on equation (2) can be applied to distinguish buildings from other objects such as trees. Considering the sizes
6
Pouria Babahajiani, Lixin Fan, Moncef Gabbouj
Fig. 3. Building Segmentation
and shape of buildings, the extracted boundary will be eliminated if its size is less than a threshold. The proposed method takes advantage of priori knowledge about urban scene environment and assumes that there are not any important objects laid on the building facades. While this assumption appears to be oversimplified, the method actually performs quite well with urban scenes as demonstrated in the experimental results (see section 3). The resolution of range image is the only projection parameter during this point cloud alignment that should be chosen carefully. If each pixel in the range image cover large area in 3D space too many points would be projected as one pixel and fine details would not be preserved. On the other hand, selecting large pixel size compared to real world resolution leads to connectivity problems which would no longer justify the use of range images. In our experiment, a pixel corresponds to a square of size .05 m2 . 2.3
Voxel based segmentation
After quick segmenting out the ground and building points from the scene, we use an inner street view based algorithm to cluster point clouds. Although top view range image analysis generates a very fast segmentation result, there are a number of limitation to utilize it for the small vertical object such as pedestrian and cars. These limitations are overcome by using inner view (lateral) or ground based system in which, unlike top view the 3D data processing is done more precisely and the point view processing is closer to objects which provides a more detailed sampling of the objects. However, this leads to both advantages and disadvantages when processing the data. The disadvantage of this method s includes the demand for more processing power required to handle the increased volume of 3D data. The 3D
Object Recognition in 3D Point Cloud of Urban Street Scene
7
point clouds by themselves contain a limited amount of positional information and they do not illustrate color and texture properties of object. According to voxel based segmentation, points which are merely a consequence of a discrete sampling of 3D objects are merged into clusters voxels to represent enough discriminative features to label objects. 3D features such as intensity, area and normal angle are extracted based on these clustersvoxels. The voxel based classification method consists of three steps, voxilisation of point cloud, merging of voxels into super-voxels and the supervised classification based on discriminative features extracted from super-voxels. 2.3.1 Voxelisation of Point Cloude In the voxelisation step, an unorganized point cloud p is partitioned into small parts, called voxel v. The middle image in figure 4 illustrates an example of voxelisation results, in which small vertical objects point cloud such as cars are broken into smaller partition. Different voxels are labelled with different colors. The aim of using voxelisation is to reduce computation complexity by and to form a higher level representation of point cloud scene. Following [8], a number of points is grouped together to form a variable size voxels. The criteria of including a new point pin into an existing voxel i is essentially determined by the crucial minimal distance threshold dth which is defined as Equation (3): min(kpim − pin k2 ) ≤ dth , 0 ≤ m, n ≤ N, m 6= n
(3)
where pim is an existing 3D point in voxel, pin is a candidate point to merge to the voxel, i is the cluster index, dth is the maximum distance between two point, and N is the maximum point number of a cluster. If the condition is met, the new point is added and the process repeats until no more point that satisfies the condition is found (see Algorithm 1). Equation (3) ensures that the distance between one point and its nearest neighbors belonging to the same cluster is less than dth . Although the maximum voxel size is predefined, the actual voxel sizes depend on the maximum number of points in the voxel (N) and minimum distance between the neighboring points. repeat Select a 3D point for Voxelisation; Find all neighboring points to be included in the voxel, with this condition that: a point pin directly merge to voxel if its distance to any point pin the voxel will not be farther away than a given distance (dth ); until all 3D points are used in a voxel or the size of cluster is less than (N); Algorithm 1: Voxelisation 2.3.2 Super Voxelisation For transformation of a voxel to super voxel we propose an algorithm to merge voxels via region growing with respect to the following properties of clusters:
8
Pouria Babahajiani, Lixin Fan, Moncef Gabbouj
Fig. 4. Voxelisation of Point Cloud. from left to right: top view row point cloud, voxelisation result of objects point cloud after removing ground and building, s-voxelisation approach of point cloud
• If the minimal geometrical distance, Dij , between two voxels is smaller than a given threshold, where Dij is defined as Equation (4): Dij = min(kpik − pjl k2 ), k ∈ (1, m), l ∈ (1, n)
(4)
Where voxels vi and vj have m and n points respectively, and pik and pjl are the 3D point belong to voxel vi and vj . • If the angle between Normal vectors of two voxels is smaller than a threshold: In this work, normal vector is calculated using PCA (Principal Component Analysis)[15]. The angle between two s-voxels is defined as angle between their normal vectors (equation 5): Θij = arccos(< ni , nj >)
(5)
Where ni and nj are normal vectors at vi and vj respectively. The proposed grouping algorithm merges the voxels by considering the geometrical distance (M < dth ) and normal features of clusters (Θij < Θth1 ). All these Voxelisation steps then would be used in grouping these super-voxels (from now onwards referred to as s-voxels) into labeled objects. The advantage of this approach is that we can now use the reduced number of super voxels instead of using thousands of points in the data set, to obtain similar results for classification. The right image in figure 4 illustrates an example of s-voxelisation results, in which different s-voxels are labelled with different colors. 2.3.3 Feature Extraction For each s-voxel, seven main features are extracted to train the classifier. The seven features are geometrical shape, height above ground, horizontal distance to center line of street, density, intensity, normal angle and planarity. In order to classify these s-voxels, we assume that the ground points have been segmented well. The object types are so distinctly different however these features as mentioned are sufficient to make a classification. Along with the above mentioned features, geometrical shape descriptors plays an important role in classifying objects. These shape-related features are computed based on the projected bounding box to x - y plane (ground).
Object Recognition in 3D Point Cloud of Urban Street Scene
9
Geometrical shape: Projected bounding box has effective features due to the invariant dimension of objects. We extract four feature based on the projected bonding box to represent the geometry shape of objects. – Area : the area of the bounding box is used for distinguishing large-scale objects and small ones. – Edge ratio : the ratio of the long edge and short edge. – Maximum edge : the maximum edge of bounding box. – Covariance : is used to find relationships between point spreading along two largest edges. • Height above ground : Given a collection of 3D points with known geographic coordinates, the median height of all points is considered as the height feature of the s-voxel. The height information is independent of camera pose and is calculated by measuring the distance between points and the road ground. • Horizontal distance to center line of street : Following [16], we compute the horizontal distance of the each s-voxel to the center line of street as second geographical feature. The street line is estimated by fitting a quadratic curve to the segmented ground. • Density : Some objects with porous structure such as fence and car with windows, have lower density of point cloud as compared to others such as trees and vegetation. Therefore, the number of 3D points in a s-voxel is used as a strong cue to distinguish different classes. • Intensity : following [17], LiDAR systems provide not only positioning information but also reflectance property, referred to as intensity, of laser scanned objects. This intensity feature is used in our system, in combination with other features, to classify 3D points. More specifically, the median intensity of points in each s-voxel is used to train the classifier. • Normal angle : Following [18], we adopt a more accurate method to compute the surface normal by fitting a plane to the 3D points in each s-voxel. • Planarity : Patch planarity is defined as the average square distance of all 3D points from the best fitted plane computed by RANSAC algorithm. This feature is useful for distinguishing planar objects with smooth surface like cars form non planar ones such as trees. 2.3.4 Classifier The Boosted decision tree [19] has demonstrated superior classification accuracy and robustness in many multi-class classification tasks. Acting as weaker learners, decision trees automatically select features that are relevant to the given classification problem. Given different weights of training samples, multiple trees are trained to minimize average classification errors. Subsequently, boosting is done by logistic regression version of Adaboost to achieve higher accuracy with multiple trees combined together. In our experiments, we boost 20 decision trees each of which has 6 leaf nodes. This parameter setting is similar to those in [3], but with slightly more leaf nodes since we have more classes to label. The number of training samples depends on different experimental settings, which are elaborated in Section 3.
10
3
Pouria Babahajiani, Lixin Fan, Moncef Gabbouj
Experimental Result
The LiDAR technology has been used in the remote sensing urban scene understanding by two main technology: Terrestrial Laser Scanning (TLS), useful for large scale buildings survey, roads and vegetation, more detailed but slow in urban surveys in outdoor environments; Mobile Laser Scanning (MLS), less precise than TLS but much more productive since the sensors are mounted on a vehicle; In order to test our algorithm both type of data sets were used: 1. 3D Velodyne LiDAR as TLS data set [20] 2. Paris-rue-Madame [21] and NAVTAQ True as MLS datasets [17] We train boosted decision tree classifiers with sample 3D features extracted from training s-voxels. Subsequently we test the performance of the trained classifier using separated test samples. The accuracy of each test is evaluated by comparing the ground truth with the scene parsing results. We report global accuracy as the percentage of s-voxel correctly classified, per-class accuracy as the normalized diagonal of the confusion matrix and class average which represents the average value of per class accuracies. 3.1
Evaluation Using the Velodyne LiDAR Database
The database includes ten high accurate 3D point cloud scenes collected by a Velodyne LiDAR mounted on a vehicle navigating through the Boston area. Each scene is a single rotation of the LIDAR, yielding a point cloud of nearly 70,000 points. Scenes may contain objects including cars, bicycles, buildings, pedestrians and street signs. Finding ground and building points is discussed in Section 2.1 and 2.2, and the recognition accuracy is approximately 98, 4% and 95, 7% respectively. We train our classifier using seven scene datasets, selected randomly, and test on the remaining three scenes. Table 1 presents the confusion matrices between the six classes over all 10 scenes. Our algorithm performs well on most per class accuracies with the heights accuracy 98% for Ground and the lowest 72% for sign-symbol. The global accuracy and per-class accuracy are about 94% and 87% respectively. Tree Car Sign Person Fence Ground Building Tree 0.89 0.00 0.07 0.00 0.04 0.00 0.00 Car 0.03 0.95 0.00 0.00 0.02 0.00 0.00 Sign 0.17 0.00 0.72 0.11 0.00 0.00 0.00 Person 0.03 0.00 0.27 0.78 0.00 0.00 0.00 Fence 0.03 0.00 0.00 0.00 0.85 0.00 0.12 Ground 0.00 0.00 0.00 0.00 0.00 0.98 0.02 Building 0.00 0.00 0.00 0.00 0.04 0.00 0.96 Table 1. Confusion matrix Velodyne LiDAR Database
Object Recognition in 3D Point Cloud of Urban Street Scene
11
Fig. 5. Left image shows scene object recognition qualitative results, right image represent misclassified points. Results Tree Car Sign Person Lai s 0.83 0.91 0.80 0.41 Our 0.89 0.95 0.72 0.88 Table 2. Comparison of the class accuracy
Fence Ground Building 0.61 0.94 0.86 0.85 0.98 0.95 of our approach and Lais approach
We also compare our approach to the method described by Lai in [20]. Table 1 shows its quantitative testing result. In terms of per class accuracy, we achieve 87% in comparison to 76%. Figure 7 shows some of the qualitative results of the test scene, achieved by our approach. 3.2
Evaluation Using Paris-rue-Madame and NAVTAQ True datasets
Paris-rue-Madame and NAVTAQ True datasets contains 3D MLS data. The Paris-rue-Madame point cloud is collected from rue Madame Street with 160 m long. The dataset contains 20 million points, 642 objects categorized in 26 classes. Its noteworthy that several objects such as wall sign and wall light are considered as building facades. The second MLS dataset is collected by NAVTAQ True system consisting of point cloud form New York streets. This LiDAR data was collected using terrestrial scanners and contains approximately 710 million points covering 1.2 km. These point clouds hold additional information such as RGB color, time step and etc. which is ignored here as our focus remained on using the pure geometry and intensity for the classification of objects. Same as TLS evaluating test we use 11 dominant categories: Building, Tree, Bike, Car, SignSymbol, Ground, Building. The Paris-rue-Madame and NAVTAQ True data sets are divided into two portions: the training set, and the testing set. The 70% long of each data set are randomly selected and mixed for training of classifier and 30% remained long of point cloud is used for testing. Table 3 shows the quantities results achieved by our approach. Comparing to Terrestrial Laser Scanning, our results are not as good as in shown in Table 1. Since mixing two data sets captured from different cities poses
12
Pouria Babahajiani, Lixin Fan, Moncef Gabbouj
Fig. 6. Scene object recognition qualitative results in different view
serious challenges to the parsing pipeline. Furthermore, 3D street object detection is a much harder task than reconstructing walls or road surface. Because street objects can have virtually any shape and due to small resolution and the fact that the LiDAR only scans one side of the object, the detection is sometimes impossible. Moving objects are even harder to reconstruct based solely on LiDAR data. As these objects (typically vehicles, people) are moving through the scene, which make them appear like a long-drawn shadow in the registered point cloud. The long shadow artifact is not appear in TLS system because in which we face to one point as exposure point to scan the street objects. Figure 8 shows some of the qualitative results of the test scene.
Tree Car Sign Person Bike Ground Building Tree 0.75 0.07 0.10 0.00 0.00 0.00 0.08 Car 0.11 0.73 0.00 0.00 0.05 0.00 0.11 Sign 0.09 0.00 0.78 0.13 0.00 0.00 0.00 Person 0.07 0.00 0.21 0.58 0.14 0.00 0.00 Bike 0.03 0.00 0.00 0.04 0.81 0.00 0.12 Ground 0.00 0.00 0.00 0.00 0.00 0.97 0.03 Building 0.05 0.00 0.00 0.00 0.04 0.00 0.95 Table 3. Confusion matrix of Paris-rue-Madame and NAVTAQ True Database
Object Recognition in 3D Point Cloud of Urban Street Scene
4
13
Conclusion
We have proposed a novel and comprehensive framework for semantic parsing of street view 3D MLS and TLS point cloud based on geometrical features. First, ground are segmented using a heuristic approach based on the assumption of constant slope group plane. Second, building points are then extracted by tracing contours of projections of 3D points onto the x - y plane. Using this segmentation huge amount of data (more than 75% of points) are labeled, and only small amount of point cloud which have complex shape remained to be segmented. During the offline training phase 3D features are extracted at s-voxel level and are used to train boosted decision trees classifier. For new scene, the same unsupervised ground and building detection are applied and geometrical features are extracted and semantic labels are assigned to corresponding point cloud area. The proposed two-stage method requires only small amount of time for training while the classification accuracy is robust to different types of LiDAR point clouds acquisition methods. To our best knowledge, no existing methods have demonstrated the robustness with respect to variety in LiDAR point data.
References 1. Liu, C., Yuen, J., Torralba, A.: Nonparametric scene parsing: Label transfer via dense scene alignment. In: Computer Vision and Pattern Recognition, 2009. CVPR 2009. IEEE Conference on, IEEE (2009) 1972–1979 2. Csurka, G., Perronnin, F.: A simple high performance approach to semantic segmentation. In: BMVC. (2008) 1–10 3. Hoiem, D., Efros, A.A., Hebert, M.: Recovering surface layout from an image. International Journal of Computer Vision 75 (2007) 151–172 4. Floros, G., Leibe, B.: Joint 2d-3d temporally consistent semantic segmentation of street scenes. In: Computer Vision and Pattern Recognition (CVPR), 2012 IEEE Conference on, IEEE (2012) 2823–2830 5. Zhang, G., Jia, J., Wong, T.T., Bao, H.: Consistent depth maps recovery from a video sequence. Pattern Analysis and Machine Intelligence, IEEE Transactions on 31 (2009) 974–988 6. Lu, W.L., Murphy, K.P., Little, J.J., Sheffer, A., Fu, H.: A hybrid conditional random field for estimating the underlying ground surface from airborne lidar data. Geoscience and Remote Sensing, IEEE Transactions on 47 (2009) 2913–2922 7. Hern´ andez, J., Marcotegui, B., et al.: Filtering of artifacts and pavement segmentation from mobile lidar data. In: ISPRS Workshop Laserscanning 2009. (2009) 8. Zhou, Y., Yu, Y., Lu, G., Du, S.: Super-segments based classification of 3d urban street scenes. Int J Adv Robotic Sy 9 (2012) 9. Johnson, A.: Spin-Images: A Representation for 3-D Surface Matching. PhD thesis, Robotics Institute, Carnegie Mellon University, Pittsburgh, PA (1997) 10. Kazhdan, M., Funkhouser, T., Rusinkiewicz, S.: Rotation invariant spherical harmonic representation of 3 d shape descriptors. In: Symposium on geometry processing. Volume 6. (2003) 11. Sun, J., Ovsjanikov, M., Guibas, L.: A concise and provably informative multiscale signature based on heat diffusion. In: Computer Graphics Forum. Volume 28., Wiley Online Library (2009) 1383–1392
14
Pouria Babahajiani, Lixin Fan, Moncef Gabbouj
12. Osada, R., Funkhouser, T., Chazelle, B., Dobkin, D.: Shape distributions. ACM Transactions on Graphics (TOG) 21 (2002) 807–832 13. Knopp, J., Prasad, M., Van Gool, L.: Orientation invariant 3d object classification using hough transform based methods. In: Proceedings of the ACM workshop on 3D object retrieval, ACM (2010) 15–20 14. Pavlidis, T.: Algorithms for graphics and image processing. Computer science press (1982) 15. Klasing, K., Althoff, D., Wollherr, D., Buss, M.: Comparison of surface normal estimation methods for range sensing applications. In: Robotics and Automation, 2009. ICRA’09. IEEE International Conference on, IEEE (2009) 3206–3211 16. Zhang, C., Wang, L., Yang, R.: Semantic segmentation of urban scenes using dense depth maps. In: Computer Vision–ECCV 2010. Springer (2010) 708–721 17. Babahajiani, P., Fan, L., Gabbouj, M.: Semantic parsing of street scene images using 3d lidar point cloud. Proceedings of the 2013 IEEE International Conference on Computer Vision Workshops 13 (2013) 714 – 721 18. Xiao, J., Quan, L.: Multiple view semantic segmentation for street view images. In: Computer Vision, 2009 IEEE 12th International Conference on, IEEE (2009) 686–693 19. Collins, M., Schapire, R.E., Singer, Y.: Logistic regression, adaboost and bregman distances. Machine Learning 48 (2002) 253–285 20. Lai, K., Fox, D.: Object recognition in 3d point clouds using web data and domain adaptation. The International Journal of Robotics Research 29 (2010) 1019–1037 21. Serna, A., Marcotegui, B.: Attribute controlled reconstruction and adaptive mathematical morphology. In: Mathematical Morphology and Its Applications to Signal and Image Processing. Springer (2013) 207–218