Jul 25, 2001 - H. D. Robinson* and B. B. Goldberg. Department of Physics ..... 20 L. Landin, M.S. Miller, M.-E. Pistol, C.E. Pryor, and L. Samuel- son, Science 280, 262 1998. ... 29 C.R. Kagan, C.B. Murray, and M.G. Bawendi, Phys. Rev. B 54,.
PHYSICAL REVIEW B, VOLUME 64, 075308
Observation of excitation transfer among neighboring quantum dots H. D. Robinson* and B. B. Goldberg Department of Physics, Boston University, Boston, Massachusetts 02215
J. L. Merz Department of Electrical Engineering, Notre Dame University, South Bend, Indiana 46556 共Received 18 January 2000; revised manuscript received 21 March 2001; published 25 July 2001兲 Coupling between spatially separated zero-dimensional states has been observed in a system of selfassembled In0.55Al0.45As quantum dots. Photoluminescence excitation spectra, taken at 4.2 K with a near-field scanning optical microscope, reveals narrow resonances in the emission lines of individual dots when the excitation energy is tuned below the barrier band edge. A fraction of these resonances occur simultaneously in emission corresponding to different dots, evincing lateral interdot excitation transfer. Experiments show that the wetting layer in the sample consists solely of localized states which are then invoked to explain the excitation transfer over the relatively large interdot spacing. DOI: 10.1103/PhysRevB.64.075308
PACS number共s兲: 73.21.⫺b, 78.66.Fd, 78.55.Cr
I. INTRODUCTION
Over the last few years self-assembled quantum dots 共SADs兲 共Refs. 1– 4兲 have emerged as a model system for optical studies of the physics of zero dimensions 共0D兲, mainly due to the high quality of the material and the relative ease with which it can be fabricated. So far, most work in the area has treated the dots as near-ideal 0D systems, isolated from the surrounding semiconductor matrix. In this paper, we present results demonstrating lateral excitation transfer between self-assembled quantum dots. The lateral coupling appears to be mediated by potential fluctuations in the quantum well connecting the dots—also known as the wetting layer 共WL兲. This is an example of the strong influence the surrounding can have on SAD physics, showing the near-0D assumption to be invalid in at least some cases. SADs form when an epitaxial layer of a semiconductor is grown on a substrate with which it has a large lattice mismatch 共Stranski-Krastanov growth mode兲.5,6 When grown beyond a critical thickness, the epitaxial layer spontaneously relieves the strain by forming 3D islands of relatively uniform size. The result is a layer of homogeneous, randomly distributed, high quality quantum dots connected by a thinner wetting layer. The growth method allows no control of dot positions, and the dot density is typically very high, ⬃1010 cm⫺2 . Therefore, previous optical experiments have been largely limited to study low dot density samples in order to overcome the inevitable inhomogeneous broadening caused by studying a large ensemble of dots. In such systems, coupling between widely separated individual dots does not occur. Using a near-field scanning optical microscope 共NSOM兲 共Refs. 7,8兲 operating at 4.2 K, we can study a small ensemble 共10–25兲 of dots in samples where the dot density is sufficiently high for interdot excitation transfer to occur. The sample used consists of a In0.55Al0.45As quantum well, containing the dots, embedded in Al0.35Ga0.65As grown on a GaAs substrate, and has been studied extensively.9–12 The dot density is 2⫻1010 cm⫺2 , the average lateral dot radius 共R兲 is 9 nm, and the ground state to first excited state 0163-1829/2001/64共7兲/075308共7兲/$20.00
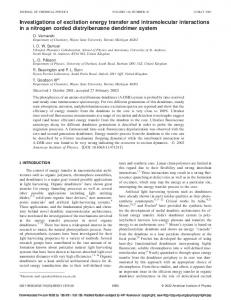
separation (ប 01) is approximately 40 meV. Photoluminescence excitation 共PLE兲 measurements were carried out in the near-field, illuminating the sample through the NSOM tip, and collecting the emission with conventional optics in the far-field. While this illumination mode NSOM produces the largest signal, it has a limited spatial resolution due to diffusion of excitons away from the tip (0.7 ⫺1.0 m). In our experiments however, the data has been gathered with the excitation energy tuned below the AlGaAs barrier band edge, where the diffusion length is very small, measured to be 140–230 nm. The PLE excitation and detection energy regions are shown schematically in Fig. 1 on a photoluminescence spectrum of both the dots and the barrier exciton.
FIG. 1. A typical photoluminescence spectrum in the near field, where emission lines from individual quantum dots are resolved. Detection and excitation regions for collecting PLE data are schematically indicated. The feature around 1995 meV is the barrier exciton.
64 075308-1
©2001 The American Physical Society
H. D. ROBINSON, B. B. GOLDBERG, AND J. L. MERZ
PHYSICAL REVIEW B 64 075308
FIG. 2. A comparison of the PLE of two quantum dot emission lines 共taken from the region between 1840 and 1940 meV in Fig. 1兲 along with the PL of the barrier exciton. There are no vertical offsets of the graphs. The long tails are due to the broad, nonresonant absorption into the wetting layer. II. EXPERIMENTAL RESULTS AND DISCUSSION
In the following we demonstrate that the wetting layer in this sample is disordered and its states energetically and spatially localized. This manifests itself in several manners: 共1兲 The experiments show an absence of an extended wetting layer state in PLE; 共2兲 occasional weak, very sharp PL lines at energies in the wetting layer; and 共3兲 well defined states on the low energy side of the barrier exciton. A. Evidence of a disordered WL
Figure 2 shows the PLE spectra for two of the individual QD emission lines as the laser is tuned through the barrier exciton energy. The spectra show two broad peaks due to absorption into the heavy-hole and light-hole barrier excitons respectively. At lower energies, tails due to a broad absorption into the WL are visible in the PLE. The intensity of these tails decreases slowly with decreasing excitation energy, typically by 10 to 25 % every 10 meV. One would have expected the tails to end at a 2D WL exciton resonance at ⬃1960 meV as seen in other samples. Instead, we observe the tails smoothly tapering off at least down to 1890 meV, which is well into the QD emission region in our sample. This observation of a broad absorption indicates that the WL states in this sample are localized on a length scale short enough that no true 2D continuum is formed. The presence of localized states in the WL can also be directly inferred from a close examination of PL spectra at energies immediately below the barrier exciton peak. There, the PL displays a multitude of very weak, narrow lines, the brightest of which show strong saturation versus excitation power 共see Fig. 3兲. These lines are visible in the 1930–1990 meV energy range, and are a clear indication of the presence of localized states in the WL. This is true whether the lines are due directly to the WL states, or to the QD excited states, as the latter could not emit light if the WL states formed a continuum. The fact that the lines saturate quickly, and do
FIG. 3. PL with exc⫽514.5 nm. The spectra have been scaled inversely to power and offset slightly to enable comparison. The heights of the barrier exciton peaks at 1995 meV are about eight times the full vertical scale.
not exhibit the characteristics of state filling, which is absent in this sample, does however favor the WL states as a source of the PL lines. In addition, the barrier exciton is itself unusually wide and has, in the near-field, significant structure on the low-energy side, as shown in Fig. 1. The numerous low-energy features are due to the WL localized states extending into or interacting with the barrier excitons. We can for these reasons conclude that the WL in this sample is strongly disordered. One possible source of the disorder are the large number 共several 1000/ m2 ) of small clusters that are known13,14 to form with the quantum dots in the WL during S-K growth. In addition, since our sample is a ternary alloy, local fluctuations in alloy composition likely also contribute. Raymond et al.15 argue that the peak seen at 1965 meV, present in Fig. 1, can be attributed to the WL exciton and hence would indicate a 2D WL state. However, the peak is not always present in the near field, as is evident in Fig. 3, which was collected during a different run than Fig. 1. We therefore believe that the 1965 meV peak, as well as the similar peak at 1982 meV, are due to local variations in the WL density of states, rather than any extended states. B. Excitation transfer—spectral evidence
When the laser is tuned more than 20 meV below the barrier band edge, another striking feature appears in the PLE spectra in the form of sharp resonances on top of the broad WL absorption background. Figure 4共a兲 plots emission intensity as a function of both excitation 共ordinate兲 and detection 共abscissa兲 showing the QD emission lines 共vertical dark lines兲 with a number of resonances 共darker spots on the
075308-2
OBSERVATION OF EXCITATION TRANSFER AMONG . . .
PHYSICAL REVIEW B 64 075308
This effect aside, the PL linewidth is resolution limited (⬍0.1 meV), due to its much longer (⬃1 ns) 共Ref. 15兲 lifetime. When comparing several of the PLE resonances to each other, one notices that resonances often occur in one or more PL lines at the exact same excitation energy. This is illustrated in Fig. 4共b兲 by spectral line cuts at energies indicated by arrows in Fig. 4共a兲. We propose that this is the signature of interdot excitation transfer, i.e., the transfer of excitons or excitation from one QD to another. In this scenario, each set of simultaneously enhanced, individual QD ground-state emission lines is caused by the laser being resonant with the second excited state of a QD in the set, increasing the brightness of that dot as well as neighboring dots coupled to it. In order to arrive at this conclusion, we must first exclude several other possible explanations. C. Excluded possibilities
FIG. 4. 共a兲 Typical plot of intensity vs laser and detection energy. Numerous resonances are visible. The arrows mark vertical line cuts shown in 共b兲. The dot-dashed line marks the nominal ground-state-second-exited state splitting. 共b兲 Line cuts 1–6 from 共a兲, offset vertically for clarity.
lines兲. A distance of 60– 80 meV between detection and excitation energies is consistent with resonances corresponding to the second excited state of the dots. It should be noted that even though the excited QD states are surrounded by a pseudocontinuum of WL states, they are orthogonal to any WL state at that energy, and are well defined. The narrow linewidth of the resonances support this, as significant mixing of QD and WL states should cause measurable line broadening. In fact, this linewidth typically has a FWHM of 0.1–0.3 meV, which corresponds to a relatively short 共2–10 ps兲 excited state lifetime, consistent with prior results.16,17 As for the PL linewidth, we can see from Fig. 1 that some lines have a broad base, or ‘‘Prussian helmet’’ shape. This could be due to spectral diffusion due to charge trapping near the dots, which we have previously observed in this sample.18
Our interpretation of the data is based upon interdot excitation transfer, but a number of additional possibilities exist which must be excluded. First, it is conceivable that the observed resonances are due simply to spectral variations in the absorption into the WL. If this were the case, however, one would expect all QD PL lines to show the same resonance, rather than just a small subset. In a variation of this scenario, the shared resonances are due to WL localized states, coupled to a small number of quantum dots. Only the resonances unique to one PL line are then attributable to the dots. While we cannot completely rule out this possibility, it is unlikely due to the fact that the PLE resonances, including the shared ones, tend to cluster around energies consistent with the first two excited states of the dots. This is illustrated in Fig. 4共a兲, where most resonances are relatively close to the ⌬E⫽70 meV line, which is the expected average splitting between the ground and second excited states. Similarly, in Fig. 5, which extends the range of excitation plotted in Fig. 4 to higher 关5共a兲兴 and lower 关5共b兲兴 energies, resonances are only observed near the ⌬E⫽35 meV 共ground-first-excitedstate splitting兲 line. We thus conclude that the PLE resonances are due to the QDs only. Secondly, consider the possibility that all lines in a multidot resonance come from a single dot within the spatial resolution of the NSOM (⬃200 nm), as was the case in a similar experiment by Hessman et al.19 The most direct argument excluding this is that the individual PLE spectra of the quantum dots within a coupled QD set are generally uncorrelated off resonance. This is clear from Fig. 4共b兲, and proves an origin of the resonance in several QDs. Also, as detailed below, the data is inconsistent with any possible source of multiple lines generated by a single dot. In several recent papers, emission from multiexciton states has been observed at high pump intensities.20–22 These states manifest themselves in the PL spectrum as extra lines a few meV above and below the single exciton line. In NSOM experiments, the optical power density impacting on the very small area immediately underneath the tip can locally reach the 103 –104 W/cm2 range, making it quite reasonable to consider nonlinear effects.
075308-3
H. D. ROBINSON, B. B. GOLDBERG, AND J. L. MERZ
PHYSICAL REVIEW B 64 075308
FIG. 5. 共a兲 Intensity vs laser and detection energy. Laser tuned from 1969 to 1990 meV. The arrow indicates the position where two different data sets, separated in time by several hours, have been spliced. 共b兲 Intensity vs laser and detection energy. Laser tuned from 1921.5 to 1936.2 meV. The dot-dashed line marks the nominal ground-state-first-excited state splitting.
PL spectra were taken as a function of optical power in order to identify possible nonlinearities. Two series of spectra varying power over two orders of magnitude are shown in Figs. 6共b兲 and 6共c兲. The 共b兲 panel shows data taken with the excitation energy tuned off a multidot PLE resonance, while the 共c兲 panel displays the dependence when the excitation is tuned to a multidot resonance. Note that intensities have been divided by incident power, so that linear power dependence appears as a constant shade of gray. Plainly, almost all observed emission lines scale linearly with power, both on and off resonance, except for a slight tendency to saturation at higher powers. When exciting above the barrier band edge, nonlinearities similar to what has been reported elsewhere22 are observed in some emission lines. These lines disappear when tuning the excitation below the band edge. We can therefore safely conclude that the various lines observed to resonate simultaneously are not due to different multiexciton states or other nonlinearities of the same dot. Also, the fact that the power dependence is linear on resonance means that the excitation and transfer processes themselves are linear. Previous work has shown there to be no perceptible phonon bottleneck in SADs,23 leading to PL exclusively from the groundstate at moderate excitation densities.24 If the power of the pump light is high enough, however, state filling of the ground state occurs causing emission from excited states.15 Since it is clear from Fig. 6 that no significant saturation and therefore no state filling effects are observed at our higher power levels, we can exclude the possibility of
FIG. 6. 共a兲 PLE of strong multiline resonance. Arrows indicate excitation energies for power dependence off resonance, shown in 共b兲, and on resonance, shown in 共c兲.
recombination from different excited states of the same dot as an explanation for our multiline resonances. Moreover, the separation between the observed multiresonant lines varies essentially randomly from 0.5 to over 25 meV. This spread in energies is inconsistent both with the 40 meV excited state separation of the dots in this sample and the few meV splitting that could be expected from any loss of cylindrical symmetry lifting the excited state degeneracy. D. Excitation transfer—spatial evidence
Spatial LT-NSOM scans of isolated QDs yield an image such as the one in Fig. 7共a兲, where a single ring shape is seen at only one detection energy. This peculiar shape is due to the combination of an illumination mode setup with reflection geometry, i.e., both tip and collection optics on the same side of the sample. In this configuration, the outgoing light is blocked by the tip when it is positioned right above the dot under observation, suppressing the PL signal. When on the other hand the tip is positioned at a distance from the dot small enough that excitons still can reach the dot through diffusion, but without directly blocking it, the PL signal is free to be collected by the optics, hence making the QD appear as a ring.25 In other cases, a larger, less distinct image is observed 关Fig. 7共b兲兴. This is well explained by interdot excitation transfer, where excitons from several dots are fed into one
075308-4
OBSERVATION OF EXCITATION TRANSFER AMONG . . .
PHYSICAL REVIEW B 64 075308
FIG. 7. Spatially resolved PL of 共a兲 a single dot, uncoupled to its neighbors, and 共b兲 a cluster of coupled dots. Units are in m. The two plots correspond to different energies as well as spatial ranges.
single dot where they eventually recombine. The final dot then appears as a ring, while the other dots lack a central ‘‘hole’’ as they themselves do not emit photons. This is in fact precisely what is observed. Possible locations of the initial and final dots are indicated in Fig. 7 by rings and crosses, respectively. III. INTERPRETATION
Having excluded excited states, multiexciton emission, and wetting layer resonant absorption, we conclude that the most probable interpretation of the data is excitation transfer between dots. Indications exist of such coupling in ensemble measurements of samples with higher dot densities,26,27 but the present experiment shows the first direct evidence of transfer between individual dots. The two most common mechanisms for energy transfer between localized states28 is dipole-dipole 共Fo¨rster兲 excitation transfer29 or exciton tunneling.30 The Fo¨rster interaction requires an overlap of the donor state emission with the acceptor state absorption, and since there are relatively few optically active exciton states in the quantum dots, and these states have a very small linewidth, such an overlap is quite unlikely to exist between the spectra of two given dots. For this reason, Fo¨rster excitation transfer directly between the dots is insufficient to explain the data. In order to estimate the probability of direct dot-to-dot tunneling as another mechanism for interdot excitation transfer we have carried out a simple Monte Carlo simulation of the spatial dot distribution, assuming hard-wall potentials to prevent overlap, but otherwise allowing equal probability for all separations. The calculated random dot distribution is consistent with experimental observations.2,31 The nearest neighbor edge-to-edge separation is larger than 10 nm 70% of the time 共greater than 5 nm for 86%兲. The tunneling time can be estimated in the small coupling limit to be ⫽h/2␣ , where ␣ ⫽ 兰 0 (r)V 0 (r) 1 (r)dr. By taking the potential
再
1 2 m 01 共 r 2 ⫺R 2 兲 , 2 V 共 r兲 ⫽ 0,
r⬍R, R⬎r,
FIG. 8. 共a兲 PLE of a QD line going through the 2D WL resonance of the Al-free sample described in Ref. 35. The arrows indicate the energies at which the spectra shown in 共b兲 were taken. Conversely, the dot-dashed line in 共b兲 indicates the energy at which 共a兲 was obtained. Clearly, a signal is present in the PLE, even below the WL exciton energy.
and the wave function (r) to be the solution to the harmonic oscillator for r⬍R and the appropriate combination of Bessel functions K 0 and K 2 for r⬎R, we can estimate for tunneling between second excited states. We have used m ⫽0.18, R⫽10 nm, and ប 01⫽38 meV, which are close to the measured values, and yields a confinement of 133 meV, consistent with the measured distance between WL and QD emission. We find ⬇1 ns for a 10 nm dot separation, which is of the same order as the exciton recombination time. This would mean that by our estimate about 30% of the dots can be involved in interdot tunneling, which is consistent with the data. However, the tunneling must be assisted by emission or absorption of an LO phonon32,33 共through the Fro¨hlich interaction兲 or an LA phonon33 共through the deformation potential interaction兲, or some combination of the two. The geometry of the problem makes a calculation of tunneling rates far from straight forward, and is well beyond the scope of this paper. We can nonetheless safely assume that the rate of phonon-assisted tunneling must be orders of magnitude smaller than indicated by our estimate, implying that direct tunneling between dots also is too weak to fully explain what we have observed. In Ref. 27, thermally activated detrapping is proposed as a
075308-5
H. D. ROBINSON, B. B. GOLDBERG, AND J. L. MERZ
PHYSICAL REVIEW B 64 075308
mechanism for the interdot carrier transfer. In our experiment, however, all data was taken at 4.2 K, where k B T is too small compared to the lateral confinement energy for thermal excitation to be a possibility. The high optical power density immediately below the near-field tip could raise the local electronic temperature well above the average lattice temperature, but if that were a significant factor, the power dependence on a multiline resonance should be superlinear, which is not observed 关Fig. 6共c兲兴. In the absence of direct tunneling and without invoking thermal detrapping, the most likely mechanism is then that localized WL states act as intermediate states for the interdot excitation transfer. IV. CONCLUSION
From the data presented in this paper, a consistent picture of the energy levels in the SAD sample emerges. It differs from the standard picture primarily in that the WL is so disordered that it consists solely of localized states. The density of these states is sufficiently high that even in the near field, the WL PLE is a continuous tail where individual states cannot be discerned. Some of the states are however sufficiently isolated that weak PL can be observed from them as sharp, easily saturable lines. Similarly, the degree of localization is sufficiently high that the QD excited states are well defined, although still coupled to the WL strongly enough that no state filling is observed in this sample, either in our data, or in previous far-field experiments.9 The observed interdot excitation transfer can be attributed to the same QD-WL coupling mechanism.
*Present address: Electrical Engineering Department at the University of California at Los Angeles, Los Angeles, CA 90095. 1 P.M. Petroff and S.P. Denbaars, Superlattices Microstruct. 15, 15 共1994兲. 2 J.M. Moison, F. Houzay, L. Leprince, E. Andre´, and O. Vatel, Appl. Phys. Lett. 64, 196 共1994兲. 3 J.-Y. Marzin, J.-M. Ge´rard, A. Israe¨l, D. Barrier, and G. Bastard, Phys. Rev. Lett. 73, 716 共1994兲. 4 M. Grundmann, N.N. Ledentsov, R. Heitz, L. Eckey, J. Bo¨hrer, D. Bimberg, S.S. Ruminov, P. Werner, U. Richter, J. Heydenreich, V.M. Ustinov, A.Y. Egorov, A.E. Zhukov, P.S. Kop’ev, and Z.I. Alferov, Phys. Status Solidi B 188, 249 共1995兲. 5 I.N. Stranski and L. v. Krastanow, Akad. Wiss. Lit. Mainz Abh. Math. Naturwiss. Kl. 146, 797 共1939兲. 6 L. Goldstein, F. Glas, J.-Y. Marzin, M.N. Charasse, and G.L. Roux, Appl. Phys. Lett. 47, 1099 共1985兲. 7 E. Betzig and J.K. Trautman, Science 257, 189 共1992兲. 8 M. A. Paesler and P. J. Moyer, Near-Field Optics: Instrumentation & Applications 共John Wiley & Sons, New York, 1996兲. 9 S. Fafard, R. Leon, J.L. Merz, and P.M. Petroff, Phys. Rev. B 52, 5752 共1995兲. 10 R. Leon, S. Fafard, D. Leonard, J.L. Merz, and P.M. Petroff, Science 267, 1966 共1995兲. 11 R. Leon, S. Fafard, D. Leonard, J.L. Merz, and P.M. Petroff, Appl. Phys. Lett. 67, 521 共1995兲. 12 P.D. Wang, J.L. Merz, S. Fafard, R. Leon, D. Leonard, G. Medeiros-Ribeiro, M. Oestrich, P.M. Petroff, K. Uchida, N.
Without detailed knowledge of the WL state distribution, we are unable to precisely determine the nature of the coupling mechanism between the WL and the QDs, although there are several possibilities. For example, excitons could travel between dots through multi-step, phonon-assisted tunneling,34 or a WL-mediated Fo¨rster interaction could be envisaged. Similarly, QD excited states could weakly hybridize with the WL localized states, creating a nonzero overlap with neighboring dots, allowing coherent transfer of excitons. It is finally worth mentioning that even in samples where we do not observe this type of interdot excitation transfer, and where state filling is observable, a tail in the PLE is nonetheless present below a distinct WL exciton peak. See Fig. 8 共this sample is described in more detail in Ref. 35兲. Therefore, WL disorder is likely to be important in most SAD samples, even in cases where it is not strong enough to suppress a 2D WL state, or reduce state filling. It is for instance possible that WL localized states provide an additional channel for carrier relaxation, further explaining the absence of a phonon bottleneck in these samples.
ACKNOWLEDGMENTS
This work was supported by NSF Grant No. DMR9701958. The authors gratefully acknowledge Dr. Rosa Leon as well as Dr. Simon Fafard, who grew the samples used for these studies. The authors also thank Pawel Hawrylak for helpful discussions.
Miura, H. Akiyama, and H. Sakaki, Phys. Rev. B 53, 16 458 共1996兲. 13 R. Heitz, T.R. Ramachandran, A. Kalburge, Q. Xie, I. Mukhametzanov, P. Chen, and A. Madhukar, Phys. Rev. Lett. 78, 4071 共1997兲. 14 T.R. Ramachandran, A. Madhukar, I. Mukhametzhanov, R. Heitz, A. Kalburge, Q. Xie, and P. Chen, J. Vac. Sci. Technol. B 16, 1330 共1998兲. 15 S. Raymond, S. Fafard, P.J. Poole, A. Wojs, P. Hawrylak, S. Charbonneau, D. Leonard, R. Leon, P.M. Petroff, and J.L. Merz, Phys. Rev. B 54, 11 548 共1996兲. 16 B. Ohnesorge, M. Albrecht, J. Oshinowo, A. Forchel, and Y. Arakawa, Phys. Rev. B 54, 11 532 共1996兲. 17 T.S. Sosnowski, T.B. Norris, H. Jiang, J. Singh, K. Kamath, and P. Bhattacharya, Phys. Rev. B 57, R9423 共1998兲. 18 H.D. Robinson, B.B. Goldberg, and J.L. Merz, Phys. Rev. B 61, R5086 共2000兲. 19 D. Hessman, P. Castrillo, M.-E. Pistol, C. Pryor, and L. Samuelson, Appl. Phys. Lett. 69, 749 共1996兲. 20 L. Landin, M.S. Miller, M.-E. Pistol, C.E. Pryor, and L. Samuelson, Science 280, 262 共1998兲. 21 E. Dekel, D. Gershoni, E. Ehrenfreund, D. Spektor, J.M. Garcia, and P.M. Petroff, Phys. Rev. Lett. 80, 4991 共1998兲. 22 A. Chavez-Perez, J. Temmyo, H. Kamada, H. Gotoh, and H. Ando, Appl. Phys. Lett. 72, 3494 共1998兲. 23 U. Bockelmann and G. Bastard, Phys. Rev. B 42, 8947 共1990兲. 24 G. Wang, S. Fafard, D. Leonard, J.E. Bowers, J.L. Merz, and
075308-6
OBSERVATION OF EXCITATION TRANSFER AMONG . . .
PHYSICAL REVIEW B 64 075308
P.M. Petroff, Appl. Phys. Lett. 64, 2815 共1994兲. H.F. Hess, E. Betzig, T.D. Harris, L.N. Pfeiffer, and K.W. West, Science 264, 1740 共1994兲. 26 D.L. Huffaker, L.A. Graham, and D.G. Deppe, Appl. Phys. Lett. 72, 214 共1998兲. 27 A. Polimeni, A. Patane`, M. Henini, L. Eaves, and P.C. Main, Phys. Rev. B 59, 5064 共1999兲. 28 V. M. Agranovich and M. D. Galanin, Electronic Excitation Energy Transfer in Condensed Matter 共North-Holland, New York, 1982兲. 25
29
C.R. Kagan, C.B. Murray, and M.G. Bawendi, Phys. Rev. B 54, 8633 共1996兲. 30 J.A. Kash, Phys. Rev. B 29, R7069 共1984兲. 31 D. Leonard, S. Fafard, K. Pond, Y.H. Zhang, J.L. Merz, and P.M. Petroff, J. Vac. Sci. Technol. B 12, 2516 共1994兲. 32 T. Weil and B. Vinter, J. Appl. Phys. 60, 3227 共1986兲. 33 F. Chevoir and B. Vinter, Phys. Rev. B 47, 7260 共1993兲. 34 D. Gershoni, E. Cohen, and A. Ron, Phys. Rev. B 37, 4577 共1989兲. 35 S. Fafard and C. Nı`. Allen, Appl. Phys. Lett. 75, 2374 共1999兲.
075308-7