arXiv:hep-ex/0107042v1 17 Jul 2001. Observation of Pseudoscalar and Axial Vector Resonances in Ïâp â K+KâÏ0n at 18. GeV. G.S. Adams,1 T. Adams,2â Z.
Observation of Pseudoscalar and Axial Vector Resonances in π − p → K + K − π 0 n at 18 GeV G.S. Adams,1 T. Adams,2∗ Z. Bar-Yam,3 J.M. Bishop,2 V.A. Bodyagin,4 D.S. Brown,5† N.M. Cason,2 S.U. Chung,6 J.P. Cummings,1 K. Danyo,6 A.I. Demianov,4 S. Denisov,7 V. Dorofeev,7 J.P. Dowd,3 P. Eugenio,3‡ X.L. Fan,5 A.M. Gribushin,4 R.W. Hackenburg,6 M. Hayek,3§ J. Hu,1 E.I. Ivanov,2 D. Joffe,5 I. Kachaev,7 W. Kern,3 E. King,3 O.L. Kodolova,4 V.L. Korotkikh,4 M.A. Kostin,4 J. Kuhn,1 V. Lipaev,7 J.M. Losecco,2 M. Lu,1 J.J. Manak,2 J. Napolitano,1 M. Nozar,1∗∗ C. Olchanski,6 A.I. Ostrovidov,4 T.K. Pedlar,5†† A. Popov, 7 D. Ryabchikov,7 A.H. Sanjari,2 L.I. Sarycheva,4 K.K. Seth,5 N. Shenhav,3‡ X. Shen,5,8‡‡ W.D. Shephard,2 N.B. Sinev,4 D.L. Stienike,2 S.A. Taegar,2§§ D.R. Thompson,2 A. Tomaradze,5 I.N. Vardanyan,4 D.P. Weygand,8 D. White,1 H.J. Willutzki,6 A.A. Yershov,4 1
Department of Physics, Rensselaer Polytechnic Institute, Troy, New York 12180 Department of Physics, University of Notre Dame, Notre Dame, Indiana 46556 3 Department of Physics, University of Massachusetts Dartmouth, North Dartmouth, Massachusetts 02747 4 Nuclear Physics Institute, Moscow State University, Moscow, Russia 119899 5 Department of Physics, Northwestern University, Evanston, Illinois 60208 6 Brookhaven National Laboratory, Upton, New York 11973 7 Institute for High Energy Physics, Protvino, Russia 142284 8 Physics Dept., Thomas Jefferson National Accelerator Facility, Newport News, VA 23606
arXiv:hep-ex/0107042v1 17 Jul 2001
2
(E852 Collaboration) The number of pseudoscalar mesons in the mass range from 1400 to 1500 MeV/c2 has been a subject of considerable interest for many years, with several experiments having presented evidence for two closely spaced states. A new measurement of the reaction π − p → K + K − π 0 n has been made at a beam energy of 18 GeV. A partial wave analysis of the K + K − π 0 system shows evidence for three pseudoscalar resonances, η(1295), η(1416), and η(1485), as well as two axial vectors, f1 (1285), and f1 (1420). Their observed masses, widths and decay properties are reported. No signal was observed for C(1480), an I G J P C = 1+ 1−− state previously reported in φπ 0 decay.
∗
Present address: Dept. of Physics, Kansas State University, Manhattan, KS 66506. Present address: Department of Physics, University of New Mexico, Albuquerque, NM 87131. ‡ Present address: Dept. of Physics, Carnegie Mellon University, Pittsburgh, PA 15213. § Permanent address: Rafael, Haifa, Israel. ∗∗ Present address: Thomas Jefferson National Accelerator Facility, Newport News, VA 23606. †† Present address: Laboratory for Nuclear Science, Cornell University, Ithaca, NY 14853. ‡‡ Permanent address: Institute of High Energy Physics, Bejing, China 100039. §§ Present address: Dept. of Physics, University of Arizona, Tucson, AZ 85721. †
1
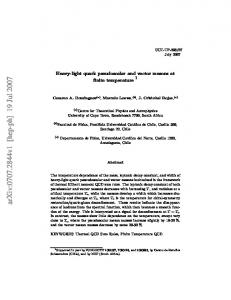
at about 1.4 GeV/c2 . One controversial state is the C(1480), which was found by the Lepton–F group in φ(1020)π 0 decay [30]. The mass and width of this resonance were measured to be M = 1480±40 MeV/c2 , and Γ = 130±60 MeV/c2 , respectively, with I G J P C = 1+ 1−− . Because it has a large production cross section in π − p → (K + K − π 0 )n and its decay into ωπ 0 was not observed, it has been suggested that this state is not a conventional meson [31]. The PDG now lists C(1480) under ρ(1450), a state previously associated with non-strange decay modes [1]. The present experiment (E852) was carried out during the 1997 running period of the Alternating Gradient Synchrotron at Brookhaven National Laboratory. A diagram of the experimental apparatus is shown in Fig. 1. A Cherenkov-tagged π − beam of momentum 18.3 GeV/c was incident on a 60 cm liquid hydrogen target within the Multi-Particle Spectrometer. The spectrometer central field was set to 0.75 Tesla. The target was surrounded by a four-layer cylindrical wire chamber (TCYL) which was used to reject events that included a large-angle charged particle [32]. A segmented CsI detector was used to reject events with large-angle photons [33]. The downstream part of the magnet was equipped with six multi-plane drift-chamber modules (DC1-6) [34] for charged-particle tracking. Three proportional wire chambers (TPX1-3) allowed the acquisition system to trigger on events having two charged tracks. A 3045element lead-glass calorimeter (LGD) [35] was used to detect forward photons, and a 96-segment threshold Cherenkov counter was used to distinguish charged kaons from pions. The Cherenkov radiator was Freon 114 at atmospheric pressure, giving a diffractive index of 1.00153. The corresponding pion (kaon) threshold is at 2.52 (8.93) GeV/c. The trigger for the present data required two forwardgoing charged tracks, energy deposition in the LGD, and no charged recoil track. A total of 18.5 million events of this type were recorded. After calibration and track fitting the events were filtered by requiring:
A long history of confusion surrounds the pseudoscalar meson spectrum [1,2]. Results from previous experiments [3–18] carried out over the past four decades, including peripheral production with pion beams, p¯ p annihilation, and J/ψ radiative decay, indicate that there may be three isosinglet pseudoscalar states in the narrow mass range from 1250 to 1500 MeV/c2 . However only two states are expected in the standard J P = 0− nonet. The lowest pseudoscalar, η(1295), was first observed in a PWA analysis of the ηππ system [19] and later confirmed by other experiments [20–23]. However the η(1295) was not observed in some reactions where the production of pseudoscalars is allowed, such as γγ collisions [24], central production [25,26] and J/ψ decays [10–12]. Therefore further confirmation of this state is desirable. The central issue in the higher mass region is sometimes referred to as the E/ι puzzle. There was a longstanding question whether the iota, seen in radiative J/ψ decay [14,15], and the E meson (now called f1 (1420)) were the same state or two distinct resonances. Peripheral production experiments at Brookhaven National Laboratory showed a complex spectroscopy in this mass region [3,4,27,28]. One of these, experiment E771, used pion, kaon and antiproton beams to study the production of different states [4,27,28]. The kaon data showed that the f1 (1285) has very little strange-quark content [28]. Evidence was also obtained for a J P C = 1+− resonance at about 1380 MeV/c2 [28], below the K ∗ K threshold. Those results were consistent with data obtained by the LASS collaboration [29]. They also observed J P C = 1++ states at 1420 and 1500 MeV/c2 [4], and two pseudoscalar states [27,28] in the 1400 MeV/c2 mass region, one decaying mainly to K ∗ K and the other decaying primarily to a0 (980)π. Evidence was also presented for an additional pseudoscalar at 1515 MeV/c2 appearing only in a0 (980)π [27]. In their latest publication [11] the Mark III group conclude that their data require two J P = 0− resonances: one at 1416 MeV/c2 decaying to a0 (980)π and the other at 1490 MeV/c2 decaying to K ∗ K. The DM2 collaboration [12] present quite a different picture: a 0− resonance at 1421 MeV/c2 decaying to K ∗ K and a 0− resonance at 1459 decaying to a0 (980)π. The Obelix group recently reported results for p¯ p → (K ± KS π ∓ )π + π − at rest [7–9]. − They observe two 0 resonances in the (KKπ) final state, one at 1405 MeV/c2 decaying directly to (KKπ) and a broader one at 1500 MeV/c2 decaying primarily to K ∗ K. The PDG [1] concludes that most of the evidence now supports two 0− states in the range 1.4-1.5 GeV/c2 , but their decay properties are poorly determined. The present experiment was designed to clarify this situation by obtaining a large sample of data for the reaction π − p → K + K − π 0 n. The task is a challenging one because of the large number of overlapping resonances in this mass region, and the presence of the K ∗ K threshold
1. a fully reconstructed beam track; 2. two forward tracks, one positive and one negative, both identified as kaons by the Cherenkov detector; 3. two energetic clusters in the active region of the LGD, both identified as neutral particles; 4. a reaction vertex within the target volume; 5. energy deposition < 40 MeV in the CsI detector. In the final step of the data selection a kinematic fit was made to the π − p → K + K − π 0 n reaction hypothesis using the full covariance matrix from track and vertex reconstruction [36]. Events with confidence level less than six percent were rejected. This was done to remove 2
non-interfering isotropic background wave was included at each mass bin to simulate the cumulative effect of numerous small waves that were omitted from the fit. The final fit was performed on 20,000 events having momentum transfer |t| > 0.1 GeV2 . This cut reduced the contributions from φπ decay (see Fig. 2), and also the strength of the 1−− waves. No (Kπ)S K waves were included in the final fit. Those waves were found to be ambiguous with the a0 π S-waves and with the background wave. Fits which included both (Kπ)S and a0 waves exhibited large interference that varied wildly in strength at adjacent M (KKπ) mass bins. Therefore one cannot exclude the possibility of some undetected (Kπ)S K strength in the present analysis. Different wave sets were used to describe the data above and below the K ∗ K threshold. Fits below 1.375 GeV/c2 did not include K ∗ K waves. The main results of the mass-independent PWA fit are shown in Figs. 3 and 4. The low-mass spectrum shows large contributions from J P C = 1++ and 0−+ waves. Mass-dependent fits to the intensities and phase differences were made by least-squares minimization for three separate wave pairs. The phase information is particularly important for determining the resonant content of the mass-independent results. These mass-dependent fits used linear combinations of relativistic Breit-Wigner poles with mass-dependent widths and Blatt-Weisskopf barrier factors [41]. The details of this procedure are given below. The first fit was to the a0 π 0 waves below 1.36 GeV/c2 . Those results, depicted in Fig. 3 (a-c), show clear excitation of η(1295) and f1 (1285). The resonance parameters from this fit are tabulated in Table II. Contributions from experimental resolution (about 10 MeV/c2 ) were removed from the listed widths. The errors given in the table include statistical contributions from the massdependent fit (first entry), and systematic errors from the PWA fits (second entry). The latter contribution was estimated by comparing the results of several massdependent fits which used different PWA results. In those fits the mass binning and wave sets were varied. With the exception of the f1 (1285) width, the measured parameters of the η(1295) and f1 (1285) are in good agreement with the average values reported by the PDG [1]. For the f1 (1285) we observe a width Γ = 45 ± 9 ± 7 MeV/c2 , which is consistent with the latest measurement from GAMS [22] but larger than the PDG value of 24.0 ± 1.2 MeV/c2 . Fitting only the intensity function in this case (data in Fig. 3b) yields a much smaller width, Γ = 23 ± 5 MeV/c2 . Thus it is the interference with η(1295) that is important in our determination of the width. Above 1.38 GeV/c2 several overlapping states show interesting structure, as indicated in Fig. 4. Pseudoscalar waves show up prominently in a0 π 0 and K ∗ K, while the most important axial vector wave is in K ∗ K decay. The
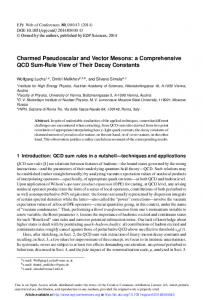
events with low-energy photons that were not detected by the apparatus. Approximately 34,000 events survived the above selection criteria. Fig. 2 shows the invariant mass distributions for these exclusive events. The most striking features of the data are two peaks in the K + K − π 0 mass spectrum at about 1.3 and 1.45 GeV/c2 . The two-particle mass spectra show clear signatures for φ(1020) and K ∗ (892) excitation. A partial wave analysis (PWA) of the present data was made in the isobar model [37,38]. The mass of the threemeson final state was binned in 20 MeV/c2 intervals and independent fits were performed on the data in each bin. The final state was represented as a sequence of interfering two-body intermediate states. An initial decay of a parent meson into a KK or Kπ 0 intermediate resonance (isobar) and an unpaired pion or kaon, followed by the subsequent decay of the isobar, populates the K + K − π 0 final state. Each partial wave is characterized by the quantum numbers J P C [isobar]LM ǫ , where J P C are the spin, parity and C-parity of the partial wave, M is the absolute value of the spin projection on the beam axis, ǫ is the reflectivity (corresponding to the naturality of the exchanged particle), and L is the orbital angular momentum between the isobar and the unpaired particle. Both nucleon spin-flip and non-flip amplitudes were included. The experimental acceptance was determined by means of a Monte Carlo simulation, which was then incorporated into the PWA normalization for each partial wave. In the description of the isobars a coupled-channel Flatt´e parametrization [39] was used for the a0 (980). The parameters of this function were set to the values used in previous partial wave analyses [4,6]. A scattering length function was used to describe (Kπ)S , the (Kπ) S-wave interaction [40]. The other isobars, K ∗ (892), and φ(1020), were modeled by relativistic Breit-Wigner shapes with masses extracted from the PDG [1]. Experimental resolution made a significant contribution to the measured width of the φ(1020) so in that case the observed width (9.5 MeV/c2 ) was used in the PWA analysis. In the partial wave analysis numerous fits with different wave sets were performed to determine the minimum set of waves that gave a good description of the angular distributions and the two-particle mass distributions. All waves were included as C-parity eigenstates [38] (eg. K ∗+ K − ± K ∗− K + ). Partial waves with J < 4 were included for K ∗ , a0 and φ isobars as well as (Kπ)S . The extended maximum likelihood method was used to determine the goodness-of-fit. The largest contributions came from pseudoscalar and axial vector waves, with natural-parity exchange dominating the results. Table I lists all partial waves used in the final fit. Waves with J P C = 2++ and 1−− were employed to account for the presence of strong tails from the ρ(1700) and other high-lying states. Both of these were needed in the fits. The 1+− K ∗ K S-wave was included to allow for possible excitation of the h1 (1380). A 3
pseudoscalar mass spectrum for a0 π 0 decay is markedly different from that for K ∗ K. The former shows a narrow peak in the intensity distribution while the latter shows strength over a much wider mass range. The results of the mass-independent PWA fits for this mass region were interpreted in two steps. In the first step the intensities and relative phase of the most prominent pseudoscalar a0 π 0 and axial vector K ∗ K waves were fitted with two Breit-Wigner poles. The results of that fit are given in Fig. 4 (a-c) and in Table II. They are consistent with previous observations of f1 (1420) and a low-mass component of η(1440) [1], seen here at a mass of 1416±4±2 MeV/c2 . In the present work this state will be labeled η(1416). The mass and width of the f1 (1420) agree with the average values reported by the PDG [1]. In the second step of the mass-dependent analysis the intensities and relative phase of the prominent pseudoscalar and axial vector K ∗ K waves were fitted to three resonance poles. The parameters of the f1 (1420) and η(1416) were held constant at the values determined above (see Table II), while the mass and width of a third resonance were varied to minimize χ2 . The results of this fit are given in Fig. 4 (d-f) and in Table II. They show a mass and width for the high-mass component of η(1440) equal to 1485±8 ± 5 MeV/c2 and 98±18 ± 3 MeV/c2 , respectively. This state will be labeled η(1485). For this fit χ2 /d.o.f was 1.07 (for 16 degrees of freedom). Fits were also made with the parameters of the lower states unconstrained. Those results were in good agreement with the values given in Table II, but with larger error bars. Pre0 vious PWA analyses have determined that the K + K π − spectrum is dominated by positive G-parity excitation [4,23], so one is justified in assigning isospin I = 0 to the positive C-parity states discussed above. The present results agree with those from earlier π − p [3], p¯ p [7], and J/ψ radiative decay [11] experiments; two pseudoscalar resonances were observed, with the lower state appearing clearly in a0 π 0 decay and the upper one strongly populating only the K ∗ K spectrum. In the present measurements η(1416) was observed in both a0 π 0 and K ∗ K decay. In order to test the significance of this result a new fit of the intensities and relative phase of the waves depicted in Fig. 4 was made. In that fit a single resonance was assumed in the pseudoscalar K ∗ K wave. This resulted in the width of the resonance increasing to about 300 MeV/c2 , and χ2 /d.o.f increasing from 1.07 to 1.38 (for 17 degrees of freedom), which demonstrates that the two-pole fit offers an improved description of the data. No strong signals were observed for excitation of the f1 (1510). As one can see in Fig. 4, the J P C = 1++ K ∗ K intensity shows a small bump at 1.5 GeV/c2 but no clear phase motion with respect to the η(1485). The decay properties of the η(1416) are of particular interest for determining the structure of the state. From
our measurements we obtain the ratio of branching fractions, BR[η(1416) → K ∗ K, K ∗ → Kπ 0 ] = 0.4 ± 0.1 BR[η(1416) → a0 π 0 , a0 → K + K − ] When all charge states are included this leads to the ratio of total branching fractions, BR[η(1416) → K ∗ K + c.c.] = 0.084 ± 0.024 BR[η(1416) → a0 π] The quoted error is statistical in nature. This ratio is reduced by about a factor of two when pseudoscalar (Kπ)S K waves are included in the fits. The above values are consistent with early results obtained by Obelix when similar wave sets were used [9], but is much smaller than those obtained in later Obelix experiments [7,8]. The η(1416) and η(1485) states were both observed to decay to K ∗ K. The ratio of production rate times branching fraction for these two states is, R[η(1416) → K ∗ K] = 0.16 ± 0.04 R[η(1485) → K ∗ K] Previous π − p experiments were unable to detect the η(1416) contribution to the K ∗ K spectrum [3,4,27]. In principle one should be able to use the measured widths and decay rates of η(1416) and η(1485) to determine their valence structure. Unfortunately the present state of hadron theory does not allow this. In the 3 P0 model one expects a pseudoscalar ss meson to have a narrow width (< 100 MeV/c2 ) and a dominant K ∗ K decay branch [42]. However both η(1416) and η(1485) have widths that fall within acceptable limits, and both decay to K ∗ K. The fact that η(1485) decays primarily by kaon emission suggests that it is the better ss candidate, but further theoretical work is needed before an identification can be made. Another important spectroscopic issue is the existence of C(1480). That state was first identified in a production experiment similar to the present one [30]. It was observed in φ(1020)π 0 decay with a mass and width M = 1480 ± 40 MeV/c2 , and Γ = 130 ± 60 MeV/c2 . Subsequently it was not seen in several other experiments, including pp central production [25] and p¯ p annihilation at rest [43]. A φ(1020) side-band study and partial wave analysis were used to search for such a state in the present data. Both studies were carried out using the full data set without a t cut. In the K + K − effective mass spectrum a clear peak is seen at the mass of the φ meson (Fig. 2b). The intensity peaks at 1020.3 ± 0.4 MeV/c2 and has a width of 9.5 ± 1.0 MeV/c2 . The width is mainly from the instrumental resolution of the detector. For the side-band study the two-kaon mass spectrum was divided into three bins, each 10 MeV/c2 wide, and K + K − π 0 mass distributions were 4
produced for each bin. Those spectra are shown in Fig. 5. Fig. 5b shows the K + K − π 0 effective mass spectrum for those events in the φ signal region. Background was removed from this spectrum by subtracting the average number of events in the adjacent two-kaon mass intervals. The resulting background-subtracted mass spectrum is shown in Fig. 5d. No peaks can be discerned in the spectrum. A more definitive test was made by performing additional PWA fits with φπ 0 S and P waves added to the wave set given in Table I. No peaks were observed in the resulting mass spectra. Since the C(1480) was believed to be a vector meson, these fits included all allowed M ǫ values for 1−− φπ 0 . Fig. 6 shows the contribution from the wave with the largest intensity (M ǫ = 0− ). The present results indicate no strong excitation of any φπ 0 waves and negligible resonance strength for 1−− φπ 0 waves in particular. The previous identification of C(1480) cannot be confirmed. In summary, a partial wave analysis of the mesons produced in the reaction π − p → K + K − π 0 n was performed. The intensity and phase of the resulting waves show clear excitation of several previously identified states: f1 (1285), η(1295), η(1416), f1 (1420), and η(1485). The existence of three low-mass pseudoscalars is confirmed. The η(1416) and η(1485) are distinguished by their decay properties; η(1416) decays primarily to a0 π 0 but has a small K ∗ K branch as well. The η(1485) was observed only in K ∗ K decay. C(1480), a state previously identified in KKπ decay, was not observed. We are grateful to the members of the MPS group for their outstanding efforts in running this experiment. This research was supported in part by the U.S. Department of Energy, the National Science Foundation, and the Russian State Committee for Science and Technology.
[12] [13]
[14] [15] [16] [17] [18] [19] [20] [21] [22] [23] [24] [25] [26] [27]
[28]
[29] [30] [31] [32] [33] [34] [35] [36]
[37] [1] Particle Data Group, The European Phys. Journal C15, 1 (2000). [2] S. Godfrey and J. Napolitano, Rev. Mod. Phys. 71, 1411 (1999). [3] M.G. Rath et al., Phys. Rev. Lett. 61, 802 (1988); N.M. Cason et al., AIP Conf. Proc. No. 185 (AIP, New York, 1989) ed. S.U. Chung, p. 334. [4] A. Birman et al., Phys. Rev. Lett. 61, 1557 (1988). [5] J.J. Manak et al., Phys. Rev. D62, 012003 (2000). [6] J.H. Lee et al., Phys. Lett. B323, 227 (1994). [7] C. Cicalo et al., Phys. Lett. B462, 453 (1999). [8] A. Bertin et al., Phys. Lett. B400, 226 (1997). [9] A. Bertin et al., Phys. Lett. B361, 187 (1995). [10] J. Bai et al., Phys. Lett. B440, 217 (1998). [11] Z. Bai et al., Phys. Rev. Lett. 65, 2507 (1990); J.
[38] [39] [40] [41] [42] [43]
5
Drinkard, Ph. D. thesis, University of California at Santa Cruz, 1990 (unpublished). J.-E. Augustin et al., Phys. Rev. D46, 1951 (1992). P. Baillon et al., Nuovo Cimento A50, 393 (1967); P. Baillon, AIP Conf. Proc. No. 113 (AIP, New York, 1983) ed. S.J. Lindenbaum, p. 78. C. Edwards et al., Phys. Rev. Lett. 49, 259 (1982). D.L. Scharre et al., Phys. Lett. B97, 329 (1980). C. Dionisi et al., Nucl. Phys. B169, 1 (1980). T.A. Armstrong et al., Phys. Lett. B146, 273 (1984). D. Aston et al., Phys. Lett. B201, 573 (1988). N. Stanton et al., Phys. Rev. Lett. 42, 346 (1979). A. Ando et al., Phys. Rev. Lett. 57, 1296 (1986). S. Fukui et al., Phys. Lett. B267, 293 (1991). D. Alde et al., Physics of Atomic Nuclei 60, 386 (1997). J. Cummings, Ph.D. thesis, Rice Universtiy, 1995 (unpublished). H. Aihara et al., Phys. Lett. B209, 107 (1988). T.A. Armstrong et al., Z. Phys. C56, 29 (1992). D. Barberis et al., Phys. Lett. B413, 225 (1997). S. Blessing et al., AIP Conf. Proc. No. 185 (AIP, New York, 1989) ed. S.U. Chung, p. 363; D. Zieminska, ibid., p. 112; S. Blessing, Ph. D. thesis, Indiana University, 1988 (unpublished). Z. Bar-Yam et al., Proceedings of Hadron91 (Singapore Press, Singapore, 1992) ed. S. Oneda and D.C. Peasley, p. 61; E. King, Ph. D. thesis, University of Massachusetts, 1991 (unpublished). D. Aston et al., Phys. Lett. B201, 573 (1988). S.I. Bityukov et al., Phys. Lett. B188, 383 (1987). F.E. Close and H.J. Lipkin, Phys. Lett. B196, 245 (1987). Z. Bar-Yam et al., Nucl. Instrum. Methods Phys. Res., Sect. A386, 235 (1997). T. Adams et al., Nucl. Instrum. Methods Phys. Res., Sect. A368, 617 (1996). S.E. Eiseman et al., Nucl. Instrum. Methods Phys. Res., Sect. A217, 140 (1983). R.R. Crittenden et al., Nucl. Instrum. Methods Phys. Res., Sect. A387, 377 (1997). O.I. Dahl et al., “SQUAW kinematic fitting program”, Univ. Calif. Berkley Group A programming note P-126 (1968). S.U. Chung and T.L. Trueman, Phys. Rev. D111, 663 (1975); J.P. Cummings and D.P. Weygand, BNL Internal Report BNL-64637, 1997 (unpublished). S.U. Chung, BNL Internal Report QGS98-901, 1998 (unpublished). S.M. Flatt´e, Phys. Lett. B63, 224 (1976). D. Aston et al., Nucl. Phys. A296, 493 (1998). S.U. Chung et al., Phys. Rev. D60, 092001 (1999). T. Barnes, F.E. Close, P.R. Page, and E.S. Swanson, Phys. Rev. D55, 4157 (1997). J. Reifenr¨ other et al., Phys. Lett. B267, 299 (1991).
2
Events/20 MeV/c
TPX 1-3
TCYL
Lead Glass Array
Window Frame Lead-Scintillation Counter Cerenkov Hodoscope
1000 800
a)
0 a0 π
b)
1
-+
0
600 400 200 0 1000 800
++
a0π
0
600 400
∆φ (rad)
200
Drift Modules
Scintillation Counter
-2
-4 1.2
2
1750
Events/7 MeV/c
a)
1250 1000 750 500
b) 750
1.6 - 0
1.8 2
2
Events/10 MeV/c
0
2 1
1.2
c)
1250 1000 750 500
1.6 2
2000
d)
1750
1 + 0
1.2
M(K π ) GeV/c2
-+
0
2000
-+
*
++
KK
d)
0 KK
e)
1
1000
1500
0
1250
1000
1000
750
750
500
500
250
250
0 ++
b)
1
*
KK
1000
*
750
250 0.8
0 a 0π
a)
1000
500
250 0 0.6
1.4 + -
M(K K ) GeV/c
2000
0 0.6
0.8
1 - 0
1.2
∆φ (rad)
2
Events/10 MeV/c
1750
2
500
M(K K π ) GeV/c +
1.35
- 0
FIG. 3. Results of mass-independent fits (points) and mass-dependent fits (lines) for (a) 0−+ [a0 (980)] S0+ intensity, (b) 1++ [a0 (980)] P 0+ intensity, (c) phase difference between (a) and (b).
1000
250
1.4
1.3 +
250 0 1.2
1.25
M(K K π ) GeV/c
Events/20 MeV/c
Events/10 MeV/c
2
FIG. 1. Schematic diagram of the experimental apparatus.
1500
c) 0
3 meters
CsI
1500
0
M(K π ) GeV/c2
FIG. 2. Mass spectra for (a) K + K − π 0 , (b) K + K − , (c) K + π 0 , and (d) K − π 0 . The open areas are all events and the shaded areas are events with |t| > 0.1 GeV2 .
0 -1.5
0
c)
4
f)
-2 3
-2.5
2
-3 -3.5
1.4
1.45
1
1.5
1.4
1.45
1.5
M(K K π ) GeV/c +
- 0
2
FIG. 4. Results of mass-independent fits (points) and mass-dependent fits (lines) for (a) 0−+ [a0 (980)] S0+ intensity, (b) 1++ [K ∗ (892)] S0+ intensity, and (c) phase difference between (a) and (b), (d) 0−+ [K ∗ (892)] P 0+ intensity, (e) 1++ [K ∗ (892)] S0+ intensity, and (f) phase difference between (d) and (e).
6
b)
TABLE II. Resonance parameters and decay modes of the observed states. Statistical errors are listed first, followed by systematic errors.
d)
Resonance f1 (1285) η(1295) η(1416) f1 (1420) η(1485)
200
a) 150
Events/50 MeV/c
2
100
50
0 200
c) 150
100
50
0 1.2
1.4
1.6
1.2
1.4
1.6
M(K+K-π0) GeV/c2
Events/20 MeV/c2
FIG. 5. φ(1020) side-band study. The K + K − π 0 effective mass for events with (a) 1.0 < M (K + K − ) < 1.01 GeV/c2 , (b) 1.015 < M (K + K − ) < 1.025 GeV/c2 , (c) 1.03 < M (K + K − ) < 1.04 GeV/c2 , and (d) the background-subtracted signal.
100
1 Φπ --
0
80 60 40 20 0
1.2
1.3
1.4
1.5
1.6
1.7
M(K K π ) GeV/c +
- 0
2
FIG. 6. Intensity of the 1−− [φ(1020)]P 0− wave.
TABLE I. Partial waves used in the amplitude analysis. Note that the K ∗ K partial waves were used only for masses greater than 1.375 GeV/c2 JPC 0−+
Mǫ 0+
1++
0+ 0 , 1± 0+ 0− − 0 , 1+ +
1+− 1−− 2++
L S P S P S P D
Decay Mode a0 (980)π 0 K ∗ (892)K K ∗ (892)K a0 (980)π 0 K ∗ (892)K K ∗ (892)K K ∗ (892)K
7
M (MeV/c2 ) 1288 ± 4 ± 5 1302 ± 9 ± 8 1416 ± 4 ± 2 1428 ± 4 ± 2 1485 ± 8 ± 5
Γ (MeV/c2 ) 45 ± 9 ± 7 57 ± 23 ± 21 42 ± 10 ± 9 38 ± 9 ± 6 98 ± 18 ± 3
Decay Modes a0 π 0 a0 π 0 a0 π 0 , K ∗ K K∗K K∗K