promotes more efficient lightning-related. TC monitoring. ... between lightning activity and various thunder .... appears to have operated as a kind of "switch-.
Eos, Vol. 88, No. 40, 2 October 2007 added receivers in Brazil and Guadeloupe, promotes more efficient lightning-related TC monitoring. Ongoing upgrades also enable Zeus to record the polarity of the CG lightning strikes [Morales et al, 2007]. Cur rent NASA-funded research (NASA African Monsoon Multi-Disciplinary Analyses, NAMMA) based on Zeus data from the 2004 and 2006 hurricane seasons aims to answer questions that arise from the analysis pre sented in this article: Is lightning activity over West Africa and the eastern Atlantic a precursor of tropical cyclogenesis? If so, what sets up the right conditions for oceanic electrified convection, and what is its spe cific role in the dynamics of cyclogenesis? Acknowledgments This study was supported by the U.S. National Science Foundation through a Water Cycle Program grant to Emmanouil Anagnostou at the University of Connecti cut. Zeus data from the European network were available from the National Observa tory of Athens. Walter Petersen acknowl edges research funding by the NASA Pre cipitation Measurement Missions. The authors thank Ramesh Kakar (NASA) and
Steve Goodman (NASA/NOAA) for their support of the Zeus network during the 2006 NAMMA campaign, and for the provision of follow-up NAMMA research support. References Avila,A.L.,and J.R.Pasch (1992).Atlantic tropical systems of \99\,Mon. Weather Rev, 120, 2688-2696. Baker, M. B., A. M. Blyth, H. J. Christian, J. Latham, K. L. Miller, and A. M. Gadian ( 1 9 9 9 ) , Relationships between lightning activity and various thunder cloud parameters: Satellite and modeling studies, Atmos.Res., 5 7 , 2 2 1 - 2 3 6 . C a r l s o n , ! N. ( 1 9 6 9 ) , Synoptic histories on African disturbances and their progress over the tropical Atlantic,Mon. Weather Rev., 97,256-276. Chronis,T,and E.N.Anagnostou (2006),Evaluation of a long-range lightning detection network with receivers in Europe and Africa, IEEE Trans. Geosci. Remote Sens., 44(6), 1 5 0 4 - 1 5 1 0 . Goodman, S. ( 2 0 0 3 ) , Atmospheric electrical activ ity and the prospects for improving short-term weather forecasting, paper presented at the 12th International Conference on Atmospheric Electric ity, Int. Comm. of Atmos. Electr., Versailles, France, 9 - 1 3 June. Molinari, J., PMoore, and V Idone ( 1 9 9 9 ) , Convective structure of hurricanes as revealed by lightning locations, Mon. Weather Rev., 7 2 7 , 5 2 0 - 5 3 4 . Morales, C.A., E. N.Anagnostou, E.Williams, a n d S. J.Kriz ( 2 0 0 7 ) , Evaluation of peak current polar ity retrieved by the Zeus Long-Range Lightning
Observational Program Tracks Arctic Ocean Transition to a Warmer State PAGES 398-399 Over the past several decades, the Arctic Ocean has undergone substantial change. Enhanced transport of warmer air from lower latitudes has led to increased Arctic surface air temperature. Concurrent reduc tions in Arctic ice extent and thickness have been documented. The first evidence of warming in the intermediate Atlantic Water (AW, water depth between 150 and 900 meters) of the Arctic Ocean was found in 1990. Another anomaly, found in 2004, suggests that the Arctic Ocean is in transi tion toward a new, warmer state [Polyakov et al, 2005, and references therein]. Detection of this anomalous state became possible due to the concerted efforts of the international team of scientists who jointly established and maintain the large-scale Mooring-Based Arctic Ocean Observational System (MAOOS). The program provides a quantitative assessment of circulation, water mass transformations, biogeochemical fluxes, key mechanisms of variability in the Arctic Ocean, and links to lower-latitude processes. MAOOS also provides a unique opportunity for coordinated long-term mea surements over a vast polar/subpolar region, and the program promises to become a key contributor to the International Polar Year (IPY). MAOOS is linked with North Atlantic and Arctic observations provided by the international Arctic/Subarctic Ocean Fluxes
(ASOF), Study of Environmental Arctic Change (SEARCH), Developing Arctic Modeling and Observing Capabilities for Long-Term Envi ronmental Studies (DAMOCLES), and Inte grated Arctic Ocean Observing System (iAOOS-Norway) programs. The program's primary monitoring tool is a series of moorings placed around the Arctic Ocean. The mooring locations are chosen to capture major near-slope transports, measure shelf-basin interaction processes, and docu ment interactions between different water masses. Mooring-based observations are com plemented by repeat quasi-synoptic oceanographic surveys, which provide the spatial coverage to enhance data interpretation. Observations From Recent Arctic Surveys In 2002 the Russian icebreaker Kapitan Dranitsyn left Kirkenes, Norway, on her first scientific voyage to the northern Laptev Sea. Scientists from several Russian, Cana dian, and U.S. institutions were aboard the icebreaker to deploy the first Nansen and Amundsen Basins Observational System (NABOS) mooring in the Eurasian Basin, and to conduct attendant multidisciplinary measurements. Observations from that expedition and one in 2003 showed that the AW temperature was close to the climatic mean. However, data collected in 2004 showed a strong warming signal, suggesting
Monitoring System,IEEE Geosci. Remote Sens. Lett., 4(1), 32-36. Papadopoulos,A.,T. Chronis, and E. N.Anagnostou ( 2 0 0 5 ) , Improving convective precipitation fore casting through assimilation of regional lightning measurements in a m e s o s c a l e model,Mon. Weath er Rev,133,1961-1977. Petersen, W A., and S.A.Rutledge ( 2 0 0 1 ) , Regional variability in tropical convection: Observations from TRMM, J Clim., 14,3566-3586. Price, C.,YYair, and M.Asfur (2007), East African lightning as a precursor of Atlantic hurricane activity Geophys. Res. Lett., 34, L09805, doi: 10.1029/ 2006GL028884. Thorncroft.C. D.,and K. Hodges (2001),African east erly wave variability and its relationship to Atlantic tropical c y c l o n e activity,./ Clim., 7 4 ( 6 ) , 1 1 6 6 - 1 1 7 9 .
Author Information Themis Chronis, Global Hydrology Cli mate Center, NASA Marshall Space Flight Center, Huntsville, Ala.; E-mail: chrontx® nsstc.nasa.gov; Earle Williams, Parsons Lab oratory, Massachusetts Institute of Technol ogy, Cambridge; Emmanouil Anagnostou, Department of Civil and Environmental Engineering, University of Connecticut, Storrs; Walter Petersen, Earth System Sci ence Center, National Space Science and Technology Center, University of Alabama in Huntsville.
the Arctic Ocean is in transition toward a new, warmer state. The anomaly found in 2004 took about 1.5 years to propagate from the Norwegian Sea to the Fram Strait region, and it took an additional 4.5-5 years to reach the Laptev Sea slope. These estimates sug gested an anomaly speed of about 1.5 centime ters per second for the segment from Fram Strait to the Laptev Sea. Since 2004, the authors have accumu lated several more years of observations. Oceanographic transects confirmed ongo ing large-scale warming of the eastern Eur asian Basin. Furthermore, they showed that the warm anomaly found its way farther eastward, toward the Canadian Basin (Fig ure 1). According to these repeated cross sections, the anomaly reached the Novosibirskiye Islands slope sometime between September 2005 and September 2006. A comparison of records from two moorings separated by several hundred kilometers was instrumental in defining the propaga tion speed for this anomaly of about 0.9 centimeters per second, which is lower than an early estimate of 1.5 centimeters per second for the entire Eurasian Basin continental slope. Springtime hydrographic surveys conducted as part of the North Pole Environmental Observatory show that the 1990s AW warming persisted near the North Pole through the early 2000s, but that it has since declined to near-climatological values [Morison etal, 2006]. Thus, conditions in the central Arctic Ocean in the vicinity of the North Pole do not indicate the sustained warming seen in the Nansen Basin. However, an oceanographic
Eos, Vol. 88, No. 40, 2 October 2007
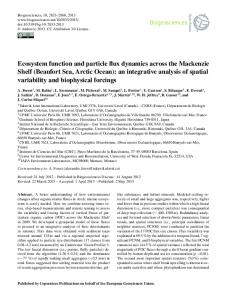
Fig. 1. Vertical cross sections of water temperature and mooring-based time series of water temperature anomalies (°C) from the Laptev Sea slope (top; see cascaded plots marked with letter a) and the vicinity ofSvalbard (middle, see cascaded plots marked with letter b). Maximum lagged correlation is used to define the anomaly propagation speed (V). These observations provide evidence of unprecedented warming of the Arctic Ocean. Plot marked c shows evidence of warming of AW (observed to a depth of 100 meters) propagating northward to the Fram Strait near Svalbard. Plot marked d shows evidence of warming propagating to the Fram Strait from the North Atlantic. The map gives locations of the time series of sea surface temperature data (gray dots). Original color image appears at the back of this volume.
Eos, Vol. 88, No. 40, 2 October 2007 survey conducted in 2005 showed northward propagation of a strong warming signal along the Lomonosov Ridge (I. A. Dmitrenko et al., Toward a warmer Arctic Ocean: Spreading of the early 21st century Atlantic water warm anom aly along the Eurasian Basin margins, submit ted to Journal of Geophysical Research-Oceans, 2007), adding complexity to the understanding of processes occurring in the high-latitude ocean. In September 2004, scientists from the Norwegian Polar Institute and the Interna tional Arctic Research Center jointly deployed a mooring in 1100 meters of water from R/V Lance and carried out an oceanographic cross section in the vicinity of Svalbard at about 30°E. This mooring was recovered and the conductivity, tem perature, and depth (CTD) cross section was repeated in September 2006 (Figure 1). These observations showed that the excep tional warming that occurred in the Eur asian Basin in 2004 progressed from Fram Strait along the slope and was captured by this mooring and attendant CTD cross section. The magnitude of this warming is unprecedented with no analogy in the his tory of regional instrumental observations. The depth range and horizontal extent of this warming are also exceptional, extend ing from the surface to almost 1000-meter depth and occupying a vast area of the Barents Sea slope. Comparing time series from this mooring with the one from Fram Strait moorings suggests a propagation speed for this anomaly of about 20 centi meters per second. The unique strength and spatial distribution (both lateral and vertical) of the warm anomaly suggest the important role of oceanic heat in shaping recent substantially reduced ice cover in the Eurasian Basin of the Arctic Ocean. The fact that the new warm anomaly is entering the Arctic Ocean suggests that the lowest Arctic ice coverage has yet to be seen. The intrusion of AW, combined with the ongoing reduction of the sea ice cover, will have major impacts on the unique Arctic fauna and ecosystems.
Possible Sources of Warm-Water Anomalies The ultimate source of the observed changes in the Arctic Ocean lies in interac tions between polar and subpolar basins. Since 1980, scientists have sufficient data cov erage to trace the spread of the recent extreme warmth along the eastern boundary from the northeast Atlantic to the Fram Strait. The sim plest interpretation is that warm water enters the Norwegian Sea and spreads north in the semipermanent ocean circulation. Satellitebased observations provide a plausible expla nation of what is driving extreme change through the system: Altimeter records from the TOPEX/POSEIDON ocean surface topog raphy venture reveal a slow rise in sea surface height at the center of the Atlantic subpolar gyre, suggesting a weakening of the gyre cir culation. This weakening, together with a westward retraction of the gyre boundary, appears to have operated as a kind of "switchgear" mechanism to control the temperature and salinity of inflow to the Nordic seas. By that mechanism, when the gyre was strong and spread east (in the early 1990s), the inflows recruited colder, fresher water directly from the subpolar gyre; however, when the gyre weakened and shifted west (as in the 2000s), the inflows to Nordic seas were able to push warmer and saltier water from the subtropical gyre. The longest records from the Faroe-Shetland Channel confirm that the temperature and salinity of the Atlantic Water flowing into the Norwegian Sea along the Scottish shelf have not been greater in 100 years (W. Turrell, Marine Laboratory, Aberdeen, Scotland, per sonal communication, 2007). Norwegian observational sites provide evidence of a recent steady warming and salinification of the eastern Norwegian Sea (Figure 1). Data from the West Spitsbergen Current also show intensive warming of Atlantic Water, particu larly during 2004-2006 (Figure 1). Although MAOOS is only a few years old, it was successful in providing important infor mation about unprecedented transitions that occurred recently in the Arctic Ocean. Thus,
MAOOS became a key component of the inte grated Arctic Ocean Observing System for the IPY (iAOOS) and the Arctic Observing Net work (AON). This early success attests that the monitoring system works and delivers valuable information for understanding changes in the Arctic climate system. The program promises to become an important element of the IPY in enhancing international cooperation, resulting in shared research infrastructure, updated databases, and the fostering of interdisciplinary dialog. References Morison, J., M. Steele, T. Kikuchi, K. Falkner, and W. Smethie (2006), Relaxation of central Arctic O c e a n hydrography to pre-1990s climatology, Geophys. Res. Lett., 33, L17604, doi:10.1029/2006GL026826. Polyakov, I. V. et al. ( 2 0 0 5 ) , O n e m o r e s t e p toward a w a r m e r Arctic, Geophys. Res. Lett., 32, L17605, d o i : 1 0 . 1 0 2 9 / 2 0 0 5 G L 0 2 3 7 4 0 .
Author Information IGOR POLYAKOV, International Arctic Research Center (IARC), University of Alaska Fairbanks; E-mail: igor@ iarc.uaf.edu; LEONID TlMOKHOV, Arctic and Antarctic Research Institute, St. Petersburg, Russia; IGOR DMIT RENKO, VLADIMIR IvANOv,and HARPER SIMMONS, IARC; AGNIESZKA BESZCZYNSKA-MOLLER, Alfred Wegener Insti tute (AWI),Bremerhaven, Germany; ROBERT DlCKSON, Centre for Environment, Fisheries and Aquaculture Sci ence, Lowestoft, U.K.; EBERHARD FAHRBACH,AWI; LOUIS FORTIER, Laval University Quebec, Ontario, Canada; JEAN-CLAUDE GASCARD,LOCEAN, Pierre and Marie Curie University Paris; JENS HOLEMANN, AWI; N. PENNY HOLLIDAY, National Oceanography Centre, Southamp ton, U.K.; EDMOND HANSEN, Norwegian Polar Institute, Tromso, Norway; CECILIE MAURITZEN, Norwegian M e t e orological Institute, Oslo; JAN PlECHURA, Institute of Oceanology Polish Academy of Sciences (PAS), Sopot, Poland; ROBERT PlCKART, Woods Hole Oceanographic Institution,Woods Hole, Mass; URSULA SCHAUER, AWI; MICHAEL STEELE, Applied Physics Laboratory University of Washington, Seattle; and WALDEMAR WALCZOWSKI, Institute of Oceanology PAS.
Eos, Vol. 88, No. 40, 2 October 2007
letter b). Maximum lagged correlation is used to define the anomaly propagation speed (V)- These observations provide evidence of unprecedented warming of the Arctic Ocean. Plot marked c shows evidence of warming ofAW (observed to a depth of 100 meters) propagating northward to the Fram Strait near Svalbard. Plot marked d shows evidence of warming propa gating to the Fram Strait from the North Atlantic. The map gives locations of the time series of sea surface temperature data (red dots).
Page 398