Obvious: a Meta-toolkit for information visualization toolkits used in Visual Analytics Pierre-Luc Hemery∗
Thomas Baudel†
Jean-Daniel Fekete‡
INRIA
IBM
INRIA
A BSTRACT Put an abstract here. Index Terms: K.6.1 [Management of Computing and Information Systems]: Project and People Management—Life Cycle; K.7.m [The Computing Profession]: Miscellaneous—Ethics 1
I NTRODUCTION
Over the past few years, several information visualization toolkits have flourished in various languages such as Java [10, 13, 14, 18], C++ [1, 9] or JavaScript [11, 4, 6] to name a few. When starting a Visual Analytics project, the choice of the toolkit is a major initial decision and this proliferation of toolkits can be confusing for visual analytics software developers who know that an inappropriate choice can lead to unanticipated limitations during the development of the application. Historically, this proliferation of toolkits can be explained by several factors: each created toolkit addresses a specific set of problems, is designed with a specific application domain in mind or simply offers different tradeoffs. However, it results in a dispersion in terms of capabilities since each toolkit has unique and useful techniques for visualization and interaction. For example, the Prefuse [13] and JUNG [14] toolkits offer several graph layout algorithms whereas Improvise [18] supports very sophisticated coordinated views with limited graph capabilities. The choice of the information visualization toolkit should be made early because it imposes not only the visualization techniques but also the data structure to work with. For an application dealing with small quantities of data, copying data from one structure to another is possible but not for visual analytic applications that usually manage data sets too large to be duplicated at all. Therefore, most data-management and analysis will be made on data structures compatible with the visualization and tied to the visualization toolkit. J O SAYS : changed language in the following paragraph −→to emphasise that this is a consequence of a lack of metatoolkit/interface rather than advice. Once the choice is made, any missing components have to be added specifically to the toolkit: if a special data manager is required (e.g. reading a particular data format), it has to be implemented specifically for the data structure managed by the toolkit. Analysis not supported by the toolkit requires the authoring or adaptation of analytical toolkit components. Likewise, if visualization techniques are required that are not supported by the chosen toolkit, they must be added, creating a strong dependency that may prevent change of toolkit later-on in development. The effort required by one application to implement the missing components cannot easily be reused in other applications us∗ e-mail:
[email protected] † e-mail:
[email protected] ‡ e-mail:
[email protected]
ing another toolkit. Therefore, important resources are wasted reimplementing data converters, analysis modules and visualization techniques. To address this early proliferation problem, this article introduces Obvious: a meta-toolkit that abstracts and encapsulates information visualization toolkits implemented in the Java language as a way to unify their use and postpone the choice of which concrete toolkit(s) to use later-on in the development process. Obvious is mainly targeted at Visual Analytics software developers but also at library or toolkits developers if they want to promote sharing of data managers, converters or algorithms not restricted to one toolkit. This article presents three contributions: 1. it describes the design and implementations of Obvious, 2. it reports some lessons learned when wrapping existing toolkits with Obvious, 3. it presents rationales for the social process we started and want to follow for the future of Obvious. The article is organized as follows: after the related work section, we describe the design of Obvious. Section 3 reports on the wrapping of several toolkits and components with Obvious. Section 4 shows examples of Obvious in action to assess its usefulness. Section 5 discusses the social process we have used and how we envision the evolution of Obvious before concluding. 2
R ELATED W ORK
Obvious is a set of interfaces and extension classes for wrapping around existing information visualization toolkits. It generalizes and extends the standard architecture as defined in the Information Visualization reference model to try to abstract all the existing implementations. In this section, we list all of the existing toolkits and explain what is common and how they differ. In the second section, we describe the most common standardization processes for software systems. 2.1
Visualization Toolkits
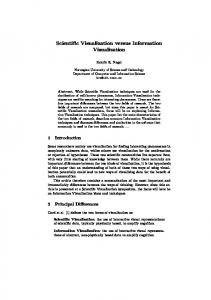
Mostly all the existing information visualization toolkits follow the InfoVis reference model initially specified by Ed Chi and refined by Card, Mackinlay and Shneiderman [8, 7]. The model defines three stages: Data Table, Visual Structure and View (Figure 1). One of its main benefits is that it explicitly represents interaction, in contrast to older visualization models. Several articles have described the concrete design of an information visualization toolkit. We report here on the common and the specific parts. The InfoVis Toolkit [10] is based on an in-memory database manager where data is organized in columns — contrary to most relational databases — to improve the memory footprint and allow addition of new attributes that are needed to manage the interaction (e.g. selection or filtering) and to hold attributes computed on demand. The main challenge being the support of interactive performance for rendering and dynamic queries with a small memory footprint. The visual structure is managed using a monolithic architecture [3]: each visualization technique is implemented as a
Figure 1: The Information Visualization Reference Model (drawing by J. Heer)
specific class (e.g. ScatterplotVisualization, ParallelCoordinatesVisualization, TreeVisualization) that performs the mapping between the data tables and the graphics items to render. Finally, the view component is the same for each of the visual structures and takes care of scrolling, zooming, overlaying magic lenses (e.g. Fisheye or Magic Lenses). A notification mechanism implements the communication between the data tables and the visual structure: each time a data table is modified, it notifies all the registered handlers of the details of the modification. The interaction is managed by Interactor objects that are associated with the visual structures; the views are generic and forward interaction managements to the Interactors. One specific feature provided by the InfoVis Toolkit is layering: visualization can be composed on top of each others. Composite visualizations are useful to build complex visualization by breaking them into simple parts. For example, node-link diagrams are split into links managed as a layer and nodes as another. Magic lenses and Fisheyes are also managed as layers on top of other visualizations. Prefuse [13] also relies on an in-memory database with notification but implements the visual structure using an extension of the data model (a visual table derives from a data table). It then transforms the data into a polylithic graphic structures whereas all the other toolkits use a monolithic architecture. In a polylithic architecture, there is only one component in charge of all the visual structures. A visualization object is responsible of managing a visual structure: it contains visual tables that augment data tables with graphic attributes (shape, color, etc.) Visualizations are in charge of computing the layout (assigning a position and shape to visual items), the graphic attributes and animations. Visualizations use a Renderer object to actually display visual items. Users can control which renderer is used depending on the visualization and the object itself. In Prefuse, data managers, visual managers and views are generic, offering a very clean interface to the application programmer. However, as noted by Bederson at al. [3], polylithic toolkits have a steeper learning curve than monolithic ones because the polylithic components do not work out of the box, they always need to be configured. To address this issue, Prefuse comes with code samples that simplify the initial setup. Building upon their experience in the Prefuse toolkit [13], Heer et Agrawala [12] have derived software design patterns that are common to information visualization applications and toolkits. Improvise [18] relies on an in-memory database with notification that is row-oriented and its visual structures are monolithic. The main characteristic of Improvise lies in its management of coordinated views. To this aim, it relies on several design patterns not supported by Prefuse; compared to the other information visualization toolkits, it adds a coordination component that is central and extends the notification mechanism implemented by the InfoVis Toolkit or Prefuse. J O SAYS : I’m not sure I am convinced of the assertion in the −→following paragraph. The three toolkits above are described in some detail, not all of which is relevant to other toolkits. Perhaps we should instead abstract their distinct design char-
acters. e.g. Row-oriented vs column oriented; in-memory vs cached database management; monolithic vs polylithic etc. The point being that while they all attempt to achieve similar general aims, their lower-level approach to doing so requires different programming approaches, hence the need for Obvious. Other information visualization toolkits can mostly be described using the three toolkits above, even if they use a different programming language. Tulip [1] is a graph-oriented toolkit programmed in C++ that uses data tables for vertices and edges, like the InfoVis Toolkit and Prefuse. It implements several complex graph layout algorithms and uses OpenGL for its rendering but the conceptual architecture is table-based and monolithic. There are also lower-level toolkits that can be used to build visual analytics applications. Two popular families are scene-graph managers and graph libraries. J O SAYS : I’m not sure what point is being made here with the discussion of lower level visualization toolkits. Are we asserting that the standardization implied by Obvious is also appropriate for lower level approaches to VA software construction? If so, we need to identify what is lacking in an approach without Obvious as well as demonstrating (later on in the paper) that implementing the Obvious interfaces in lower level visualization environments is both practical and beneficial. An interesting test case might be Processing (processing.org). This is, compared to the other examples cited, a very low level approach to visualization software development. However, it is designed for rapid-prototyping, and if it could be easily integrated with Obvious it might provide a nice example of how early prototypes could be transformed into more robust applications using Obvious as the bridge. I’d be happy to write some words on this if you think it fits well with the theme of the paper. 2.2
Scene-Graph Managers
Visual analytics applications can manage their own data structure and manage the mapping from data to visual structure on their own. At this point, they can use scene-graph toolkits to manage the visual structure and view as described in the reference model. Scene-graph toolkits are focused on computer graphics and interaction: they only deal with the visual structure and view. Piccolo and Jazz [3] are popular 2D scene-graph managers that have been used to create several information visualization applications (e.g. [15, 5].) An early version of Piccolo has also been used as graphics engine for the Cytoscape graph visualization system [16] but dropped for performance reasons. High-performance information visualization applications use scene-graph optimization techniques to speed-up the rendering of scenes. Tulip [1] and Gephi [2] maintain a spatial indexing structure to avoid rendering objects that are not visible. Although scene-graph technologies are mature and used in a wide variety of graphics applications such as games, virtual-reality applications and scientific visualization systems, they are not adequate for information visualization systems because they require the explicit specification of geometry and graphic attributes for each displayed objects. Very often, information visualization can quickly compute graphic attribute and even geometry from data attributes. For example, the position of an item using a scatterplot visualization is computed using a simple affine transformation from two data attributes. There is no need to store the computed values when computing them on the fly is very cheap. The same is true for color etc. Copying this information is costly in term of time and memory. Still, by separating the data-model from the visual model, scenegraph managers offer more flexibility than information visualization systems for complex graphics and sophisticated interaction.
←−
This is why several information visualization systems still use them. 2.3
Graph Managers
J O SAYS : Referred to as ‘graph libraries’ above. −→ While most table-based visualization toolkits rely on an inmemory database, several graph-based visualization systems manage their data-structures using a model inspired from graph-theory where topology is the main focus and data associated with graph entities is less important. This is the case for the JUNG library [14] or the Boost Graph Library (BGL) [17], as well as for the graph library used by Cytoscape [16]. These libraries support graphs as set of vertices and edges (the topological entities) that can be associated with arbitrary data. This data is just stored by the graph entities as a convenience for the application: the library does not implement any integrity check between data and graph entities. In contrast, the InfoVis Toolkit, Prefuse and Tulip maintain a close consistency between graphs and data tables: removing a data table entry associated with a graph entity (vertex or edge) also removes the entity from the graph structure. Thus, there is no clear consensus on how a graph data structure should be managed internally; the design choices are quite different depending on the communities such as graph theory, information visualization, database and semantic web. 2.4
Standardization Processes
Standardization is a well established habit in the software community; several standardization models have been used in the past and these models tend to evolve due to the growing pace of software development taking place nowadays. Standards have been specified by national and international organization such as the International Organization for Standardization (e.g. ISO, ASCII), non-profit organizations (e.g. the Unicode Consortium or OMG), consortia of public or private organizations (e.g. the World Wide Web Consortium (W3C)). Closer to the information visualization community, “The Open Geospatial Consortium (OGC)1 is an international industry consortium of 423 companies, government agencies and universities participating in a consensus process to develop publicly available interface standards.” 3
D ESIGN OVERVIEW
a) generic implementation of the InfoVis ref. model b) social process involving workshop to build consensus c) selecting emerging consensual patterns Obvious is organized according to the Information Visualization Reference Model in three main packages: data, visu and view. Additionally, it provides utility classes in the util package. J O SAYS : It seems to me that there were two categories −→of contributors to the consensus. Firstly there were the developers of existing comparatively generic vis toolkits (InfoVis Toolkit, Prefuse, Improvise). While they had different approaches to their architecture (as detailed in the previous section), they are all relatively application-agnostic. This has understandably had the main influence on the design of Obvious since they are sufficiently generic to offer wide applicability to other toolkits. Then there developers who worked with specific types of data or application (Jung, Cytoscape, LandSerf [19], Mondrian). These data/applications have particular character that shaped the design of the Obvious interface (e.g. need for robust graph handling; need for geospatial raster handling; statistical graphics). Sometimes these application areas fit well with the initial Obvious interface (e.g. JUNG graphs), but some others were a little more problematic (e.g. large geospatial rasters can be modelled as tables, 1 http://www.opengeospatial.org
but not particularly efficiently. This raises the design question as to what extent Obvious should accommodate these application areas and to what extent should they adapt their internal architectures to accommodate a common Obvious framework? I think this would lead nicely into the next section that provides details on the Obvious data model. 3.1 4
Obvious Design patterns DATA M ODEL
This section describes the data model used in Obvious and the way to create data structures. It also exposes the util package for the data model. The data model used in Obvious has been largely specified during the workshop: a consensus has been found among all participants. The initial data model proposed for Obvious derived from the proxy tuple design pattern exposed in [12]. However, originally, this model contained table, graph and tree (an extension of graph) classes. The initial proposal used the relational graph pattern described in [12]. While this pattern facilitates extendability, graphs cannot be manipulated in an object-oriented manner and as many developers are used to manipulation of object oriented graphs, the relational graph pattern was not considered satisfactory. We therefore offered the use of the proxy tuple pattern, a design pattern combining benefits of the relational graph pattern and of object oriented graphs. In addition, a major difference exists between our patterns and those introduced in [12]. Our patterns used schema to describe the columns of a table (type, name and default value) instead of a column object, that does not exist in Obvious. Schemas have been introduced, since it is efficient to gather all meta-data for the columns of a table in one unique structure, allowing table and network instantiations with a factory. Thus, the data model used in every implementation [described in the corresponding section] is built around tuples: abstractly tables are composed of tuples and graphs are described as networks i.e. a combination of two tables one made of nodes and the other of edges (both classes derived from tuples). Also, this model is completed by factories, that allows data structure instantiations. Logically, they used the well known factory pattern. With those factories, it is possible to instantiate tables and networks from a schema or from an existing object from a targeted Obvious implementation (e.g. a Prefuse table or a JUNG graph...). This also provides the possibility to use parameters to provide more arguments used in targeted toolkits. For example, in the Prefuse implementation of Obvious, parameters are used to specify the source and target node columns for a graph in an edge table. Finally, we have defined an utility package obviousx, named in the same way as javax. This package provides different kinds of utility classes for the Obvious data model. First, we have defined in obviousx, reader and writer interfaces allowing the creation of gateways between the Obvious data model and common data formats such as CSV and GraphML. It is useful since it gives software developers a standard way to import and export data in Obvious whatever the underlying implementation of the data model is. In addition, for data providers, it simplifies their work because they only have to develop one reader and one writer to be compatible with a large number of toolkits. With the same logic, obviousx furnishes a Java TableModel compatible with the Obvious one: it allows quick creation of a JTable from an Obvious table. Finally, obviousx also provides wrappers to transform obvious data structures into common existing data structures (Prefuse, Ivtk, Jung, more to develop) in order to avoid copying of data when using more than one data model.
5 V ISUALIZATION AND V IEW MODELS Unlike the data model, during the workshop, no consensus emerged concerning the Visualization and View models in Obvious. The main reason is that currently different approaches exist among toolkits : the monolithic and the polylithic approaches. So, for the moment, there is no way to create an abstract layer for visualization as we did for the data model. Further discussions and workshops may address this problem. However, we propose a solution to address this problem for monolithic toolkits. We propose wrapping monolithic components in a black box fed by an Obvious data structure and a map of parameters allowing configuration of the component. For example, it is possible to indicate the X and Y axis columns for a scatter-plot. If a developer needs a non-existing visualization component, it simply adds the choice of an implementation toolkit to create it, then this new visualization will be compatible with all data models. Our solution does not generate extra costs of development. J O SAYS : Can we sure about the last sentence above?. The −→discussion of Prefuse in 6.1 is an example of this, but requires the user of Prefuse to develop new visualization components and wrap them in Obvious. This seems like an ’extra cost of development’ to me. Concerning the view, we choose to implement a simplified version of the camera pattern introduced in [2]. The black box concept is still present : a view simply wraps a view component of a targeted toolkit. J O SAYS : The assertion made in this section suggests that −→the mono/poly-lithic approaches that vary between existing toolkits have less of an impact on data models than on view models. We should probably make some reference to this distinction in Section 2 so that it does not look like we simply ran out of time in the workshop to consider standardization of view models. 6 I MPLEMENTATIONS In this section, we point out encountered difficulties, raised problems and learned lessons during implementations of Obvious. Each implementation has its own particularities and allows us to better identify gaps in existing design patterns and models. Thus, we start by describing specific points in realized implementations and then we conclude with lessons learned during the whole step of implementation. 6.1 Prefuse Prefuse was the first targeted implementation of Obvious since its design patterns are very close to those of Obvious. The binding implements all abstractions described in the core Obvious interfaces for all data model structures, visualizations, views and predicates. [to be continued...] Prefuse is currently the only polylithic Information Visualization toolkit [ref]. However, Obvious does not currently offer a visualization abstraction for polylithic components since. Thus, we choose to provide some pre-built monolithic components based on Prefuse for well know visualization techniques such as scatter plots, force directed graphs, radial graphs... Currently, if a software developer wants to use a non existing technique, he has to write it with Prefuse as a component and wrap it with the Obvious visualization interface. 6.2 Infovis Toolkit The Obvious implementation based on Infovis Toolkit realizes all introduced design patterns. Since it is a monolithic toolkit, we do not encounter problems seen with the Prefuse implementation. We simply bind Infovis Toolkit components to Obvious ones. Implementing the data model was a bit more complex because Infovis Toolkit owns many different data structures (DynamicTable,
Table, Graph, Tree) and super interfaces for tables and graphs do not provide equivalent to methods defined in Obvious interfaces. That is why we cannot wrap Infovis toolkit’s components directly: some complementary code that plays with existing methods in the Infovis Toolkit was needed and so complicates the development and the maintenance of the implementation. 6.3
Improvise
Currently, the Obvious implementation based on Improvise only implements the data model part - for tables -. Even if Improvise is a monolithic toolkit, we cannot directly bind Improvise visualization components, since the toolkit does not expose its visualization pipeline publicly. Components are intended to be totally monolithic from scratch. To address those problems, a solution to expose the visualization pipeline is to create in Improvise a specific visualization interface making public needed methods. In addition, Improvise does not provide dynamic data support: a functionality intended to be in every obvious implementation. 6.4
JDBC
The Obvious implementation based on JDBC only uses the data model of Obvious. It was designed to prove that our data model can be applied to a large variety of existing data models or sources. In addition, this implementation is useful since databases are often used as data sources for visualization. That is why it is interesting to directly link our model to an SQL database with JDBC. Concretely, it translates obvious methods into SQL queries. For example, getters are implemented as SELECT queries, setters as UPDATE ones, add as INSERT queries and remove as DELETE queries. Also, this original implementation passes all predefined unit tests. In addition, we use it to experiment advanced notification model that does not exist in current toolkits. The tested model includes support for transaction and batch for modifications: these functionalities are based on mechanisms provided by the database. Those techniques are useful for scalability since large data modifications often occur when working with a visualization. 6.5
JUNG
JUNG implementation of Obvious realizes Visualization and View patterns and the Network abstraction, because JUNG already follows this pattern and does not have the notion of table. Since JUNG can easily provides monolithic visualizations , we simply bind existing JUNG visualization components to Obvious ones. As JUNG does not offer schema class, we use our predefined schema implementation from obvious core package to respect our patterns. From all existing implementations, this one was the easiest to create, since it fits well in Obvious assumptions (network pattern for the data model and easily providing monolithic components). Thus, it demonstrates when an existing toolkit and obvious have the same (or close) hypotheses, it greatly facilitates implementation. 6.6
Units tests
Since, we have defined a consensual abstraction for the data model, we take advantage of this to create unit tests for this abstraction. If such a consensus emerges for the visualization and/or the view part, the same approach could be adopted. Due to the similarities of Obvious and Prefuse, the binding has been used to set up unit tests for the data model in Obvious. Unit tests allow authors of Obvious bindings to automatically test whether their implementation behaves in conformance with the intended semantics of Obvious. Also, authors are able to extend these existing tests to perform more advanced features for their binding. Concretely , unit tests have been defined with JUnit for Schema (14 tests) , Table (11 tests), Network (13 tests) and Tree interfaces (8 tests) in the Obvious core package.
6.7
Lessons learned
We have learned several lessons during the development of those implementations: mainly concerning lack of precision in the Information Visualization reference model. We can list the following lessons: • the need for a specification of a clear semantic for notifications that can support simple models and more advanced ones (with batches and transactions for example) • the need for support for a polylithic approach to define an abstraction model for visualizations • toolkits need to adopt patterns close to Obvious ones in order to enhance code quality of the implementations and to facilitate the sharing of functionalities among existing toolkits J O SAYS : The last itemized point above seems like an im−→portant one, and one we should revisit in the conclusion. It exposes the issue of the degree to which existing toolkits need to adapt to allow interoperability through Obvious. It is good that we are honest about this, but it does seem to be a significant weakness with the approach, especially if we wish to support VA that use data structures that don’t fit well into those modelled in Obvious (e.g. geospatial Rasters, fuzzy sets). 7
E VALUATION
Formally evaluating the effectiveness of a meta-toolkit for visual analytics is complex. Arguably the most convincing method would require two groups of programmers of equivalent skills to implement the same set of visual analytics programs with and without Obvious. Then, a judgment could be made from the time spent and the quality of the results. This methodology has been used to assess the InfoVis Toolkit [4] with students but is impractical for real Visual Analytics applications that are more complex and would not fit the scope of student projects. Another method, used to validate Prefuse [3] would be to reimplement complex Visual Analytics applications using Obvious and assess the results, again in term of time and quality. This is what we have done and we report on our results here. 7.1
Coding applications with Obvious
This section will show how Obvious can implement well know examples of information visualizations techniques introduced in several toolkits such as prefuse and Infovis toolkit by combining different Obvious components. The two first examples use two different implementations (obvious-ivtk and obvious prefuse) to illustrate the same use case : display of a Network using the standard graph layout of the targeted implementation. The third example demonstrates how to create an application by combining component from different Obvious implementations. The first step is to create an Obvious data structure. We have chosen to illustrate two ways of creating an Obvious structure : one is to wrap an existing data structure into an Obvious one, another is to read a file using a common format (CSV, GraphML...). As shown, in the code sample, factories are provided for each implementation and they allow the developer to use the convenient strategy to set up the data structure. Once the data is ready, the next step is to create the visualization. As explained in the Visualization section, to create the Obvious Visualization, it is needed to provide additional parameters such as the label column used to display nodes in the first two examples. For the scatterplot example, columns used for X and Y axis are indicated in the map of parameters.
Finally, created Visualizations are injected in a View component. Since all examples use Swing, they are added to Jframes and then those frames are displayed to the final user. It is also possible to add zoom and pan control to created views in order to add interactivity to those examples. 7.2
Example using Weka
Weka is a software suite of machine learning. It has been proven useful to design such applications, even in visual analytics. That is why in the obviousx package (utils), we have chosen to introduce mechanisms to support Weka. So, in practice, with one line of code, it is possible to create a Weka Instances (Weka data structure) from an Obvious table. Thus, each toolkit implementing Obvious can be easily linked with Weka. 7.3
EdiDuplicate (a DDupe-Like application)
During the development of Obvious, the meta-toolkit has been used to create piece of software used in scientific project such as Ediflow [1]. In this project, we have to check for duplicated authors in the INRIA database of publications with the Ediflow environment. Thus, we decide for our use case to create a DDupe equivalent in Java able to work with a database: EdiDuplicate. DDupe is a software initially written in .NET dedicated to detect and merge duplicated nodes (often modeling people) in (social) network to facilitate data analysis. It uses similarity metric to compare each pair of authors and class results in descending order of similarity. In addition, DDupe allows the user to see the neighbourhood of the pair of nodes before merging them, in order to check if common nodes exist among their neighbors and then to confirm metric results. Our application EdiDuplicate offers the same possibility. Concretely, we have implemented a loader to create an Obvious network from the database. This structure is then fed by an external application with metrics for each pair of authors. Then, those statistics are displayed in a JTable (automically created from the Obvious structure). When, the user clicks on a cell a view of the neighbourhood of the current nodes is created. Then, with this information, the user is able to decide if the potential duplicated authors has to be merged. In addition, it is possible to query the Obvious structure to only display pair of duplicates for a specific authors. The user can also change the layout used to display the neighbourhood network with a JList: all graph layouts introduced in Infovis Toolkit are available. Concretely, the application mainly combines Obvious components and Swing components (derived from Obvious structure). For the data model, an Obvious Network is used (from the obvious-ivtk implementation), the visualization and the view part are also provided by this implementation. Building this application takes about less than a week. 8
F UTURE
WORK
a) new candidates for inclusion b) adding new toolkits (Discovery) / evolving existing toolkits to comply better c) social process Will port it for other languages to stabilize the framework and facilitate learning. 9
C ONCLUSION
Work in progress by design, contributions welcome Service to the VA community Among many concerns, alleviate at least the early choice of the toolkit
ACKNOWLEDGEMENTS The authors wish to thank A, B, C. This work was supported in part by a grant from XYZ. R EFERENCES [1] D. Auber. Tulip : A huge graph visualisation framework. In P. Mutzel and M. J¨unger, editors, Graph Drawing Softwares, Mathematics and Visualization, pages 105–126. Springer-Verlag, 2003. 1, 2 [2] M. Bastian, S. Heymann, and M. Jacomy. Gephi: An open source software for exploring and manipulating networks. In International AAAI Conference on Weblogs and Social Media, 2009. 2 [3] B. B. Bederson, J. Grosjean, and J. Meyer. Toolkit design for interactive structured graphics. IEEE Trans. Softw. Eng., 30:535–546, August 2004. 1, 2 [4] N. G. Belmonte. Javascript infovis toolkit, Mar. 2011. 1 [5] A. Bezerianos, P. Dragicevic, J.-D. Fekete, J. Bae, and B. Watson. Geneaquilts: A system for exploring large genealogies. IEEE Transactions on Visualization and Computer Graphics, 16(6):1073–1081, Nov-Dec 2010. 2 [6] M. Bostock and J. Heer. Protovis: A graphical toolkit for visualization. IEEE Transactions on Visualization and Computer Graphics, 15:1121–1128, November 2009. 1 [7] S. K. Card, J. D. Mackinlay, and B. Shneiderman, editors. Readings in information visualization: using vision to think. Morgan Kaufmann Publishers Inc., San Francisco, CA, USA, 1999. 1 [8] E. H.-h. Chi and J. Riedl. An operator interaction framework for visualization systems. In Proceedings of the 1998 IEEE Symposium on Information Visualization, pages 63–70, Washington, DC, USA, 1998. IEEE Computer Society. 1 [9] S. G. Eick. Visual discovery and analysis. IEEE Transactions on Visualization and Computer Graphics, 6:44–58, 2000. 1 [10] J.-D. Fekete. The infovis toolkit. In Proceedings of the IEEE Symposium on Information Visualization, pages 167–174, Washington, DC, USA, 2004. IEEE Computer Society. 1 [11] J. Heer. flare data visualization for the web, Mar. 2011. 1 [12] J. Heer and M. Agrawala. Software design patterns for information visualization. IEEE Transactions on Visualization and Computer Graphics, 12:853–860, September 2006. 2, 3 [13] J. Heer, S. K. Card, and J. A. Landay. Prefuse: a toolkit for interactive information visualization. In Proceedings of the SIGCHI conference on Human factors in computing systems, CHI ’05, pages 421–430, New York, NY, USA, 2005. ACM. 1, 2 [14] J. O’Madadhain, D. Fisher, S. White, and Y.-B. Boey. The jung (java universal graph/network) framework. Technical report, UCIICS, 2003. 1, 3 [15] C. Plaisant, J. Grosjean, and B. B. Bederson. Spacetree: Supporting exploration in large node link tree, design evolution and empirical evaluation. In Proceedings of the IEEE Symposium on Information Visualization (InfoVis’02), INFOVIS ’02, pages 57–, Washington, DC, USA, 2002. IEEE Computer Society. 2 [16] P. Shannon, A. Markiel, O. Ozier, N. S. Baliga, J. T. Wang, D. Ramage, N. Amin, B. Schwikowski, and T. Ideker. Cytoscape: a software environment for integrated models of biomolecular interaction networks. Genome research, 13(11):2498–2504, Nov. 2003. 2, 3 [17] J. G. Siek, L.-Q. Lee, and A. Lumsdaine. The Boost Graph Library: User Guide and Reference Manual. Addison-Wesley, 2002. 3 [18] C. Weaver. Building highly-coordinated visualizations in improvise. In Proceedings of the IEEE Symposium on Information Visualization, pages 159–166, Washington, DC, USA, 2004. IEEE Computer Society. 1, 2 [19] J. Wood. Terrain parameterization in LandSerf. In T. Hengl and H. Reuter, editors, Geomorphometry: Concepts, Software and Applications, volume Ch. 14, pages 333–349. Elsevier, London, 2008. 3