CANCER GENOMICS & PROTEOMICS 3: 245-252 (2006)
Oligonucleotide Array Comparative Genomic Hybridization Profiling of Neuroblastoma Tumours PAOLA SCARUFFI1, STEFANO MORETTI2, SIMONA COCO1, KATIA MAZZOCCO3, RAFFAELLA DEFFERRARI3, DOMENICO ALBINO3, STEFANO BONASSI2 and GIAN PAOLO TONINI1 1Unit
of Translational Paediatric Oncology and 2Molecular Epidemiology, National Institute for Cancer Research (IST), Genoa; 3Laboratory of Italian Neuroblastoma Foundation, Advanced Biotechnology Centre, Genoa, Italy
Abstract. Neuroblastoma (NB) is one of the most common paediatric solid tumours and displays a broad variety of genomic alterations. Recently, array comparative genomic hybridization (aCGH) has emerged as a novel technology enabling highresolution detection of DNA copy number aberrations. We have previously optimized a custom cDNA-array to detect MYCN gain and chromosome 1p36 loss, two molecular markers of tumour aggressiveness in NB. In spite of the power of this technique, the production of cDNA arrays is time-consuming and expensive. In the present study, we report a printed 55-mer oligonucleotide aCGH with the aim of increasing the resolution and the sensitivity of our platform. The oligonucleotide probes, designed and validated for expression profiling, reproducibly assessed amplifications, even when using whole genomes as targets. On the contrary, this microarray platform seems to offer little accuracy in measuring genomic single-copy deletions. Therefore, an oligo library specifically designed for aCGH should improve the performance of oligonucleotide aCGH in accurately mapping unbalanced chromosomal abnormalities. Neuroblastoma (NB) is one of the most common paediatric solid tumours and is responsible for approximately 15% of paediatric cancer death. The disease is characterized by a heterogeneous clinical behaviour, including maturation, spontaneous regression and rapid malignant progression (1). Many important factors such as stage, age at diagnosis and ploidy have been identified as being associated with the biological and clinical heterogeneity of NB tumours. Complex patterns of genetic abnormalities, that contribute to the malignant phenotype, have been described (2, 3). Amplification
Correspondence to: Dr. Paola Scaruffi, Unit of Translational Paediatric Oncology, National Institute for Cancer Research (IST), L.go R. Benzi, 10, 16132 - Genoa, Italy. Tel/Fax: +39-010-5737463, e-mail:
[email protected] Key Words: Neuroblastoma, microarray, CGH, MYCN, chromosome 1p.
1109-6535/2006 $2.00+.40
of the MYCN oncogene occurs in 20-25% of primary NBs and is a reliable marker of aggressive clinical behaviour. Several structural and numerical non-random chromosome abnormalities are frequently detected in NB and their role in the disease is being actively investigated. For example, deletions of 1p36 and 11q23, both associated with a worse prognosis, have been identified in up to one-third of primary tumours (4, 5). The unbalanced gain of 17q material is also associated with an adverse prognosis (6). Other regional amplifications and deletions have been identified in NB but are not as well characterized (7). Metaphase comparative genomic hybridization (mCGH) is a molecular cytogenetic technique that has substantially increased the genome-wide information on unbalanced chromosomal changes compared to conventional cytogenetics and fluorescence in situ hybridization (FISH) analysis (8). According to the literature, mCGH analyses of NB detected many novel and non-random genomic alterations, mostly consisting of MYCN amplification, 17q gain and deletions at the 1p36, 3p, 4p, 9p, 11q and 14q regions (9-19). However, this technique is hampered by a low resolution of 5 -10 Mb (8, 20) so that small genetic changes may be not identified. These limits are overcome using array CGH (aCGH), a novel technology for genome wide high-resolution detection of DNA copy number aberrations. Instead of metaphases, aCGH uses arrayed sequences of DNA bound to glass slides and probed with the genomes of interest (21-26). Platforms with bacterial artificial chromosomes (BACs), phage artificial chromosomes (PACs) and cosmids as probes yield a resolution of 1-1.5 Mb (23), whereas cDNAs yield an average resolution of 267 kb (27, 28). Several studies have documented the utility of BAC, PAC or cDNA-based microarrays for the CGH profiling of NB (25, 29-33). We had previously optimized a custom cDNA-array to detect MYCN gain and chromosome 1p36 loss, two determinants of tumour aggressiveness in NB (34). This analysis of primary NB tumour genomes demonstrated that the cDNA aCGH platform is sufficiently robust to detect both
245
CANCER GENOMICS & PROTEOMICS 3: 245-252 (2006) 1p36 chromosome loss and MYCN amplification, with a sensitivity and specificity of ~67% and 90%, respectively. In spite of the power of this technique, the production of cDNA arrays is time-consuming and expensive. The efforts to improve our approach took two directions: i) design of a new NBspecific microarray containing 55-base long nucleotide probes, in order to increase the sensitivity of our aCGH in detecting low levels of gene copy number gains and losses; ii) improvement of the resolution of this method, including probes mapping at various chromosome regions, namely 1p13.2-p36.33, 2p13.3-p24.3, 2q36.1, 7q21.11-q34, 9p21.3-p24.2, 11q12.2-q23.2, 12q14.1-q24.31, 14q24.2-q33 and 17q11.2-q25.3 and baseline oligos mapped at non NB-related regions. It was demonstrated that the oligonucleotide aCGH platform improved the detection of DNA gains, but it was less accurate in measuring genomic single-copy detection. It is foreseen that a specifically designed aCGH oligonucleotide microarray would better map unbalanced chromosomal abnormalities in a global and detailed manner.
Materials and Methods Tumour sample collection. Tumour samples were collected from 15 patients of the Department of Haematology and Oncology of the G. Gaslini Children’s Hospital of Genoa, Italy. Samples were collected at the onset of disease with the approval of the Ethical Committee of the Institute and after obtaining the parents’ written consent. Each surgically-resected tumour was processed by pathologists according to the SIOP Europe Neuroblastoma Pathology, Biology and Bone Marrow Group guidelines (35) and immediately stored at –80ÆC. Histological classification was performed according to Shimada et al. (36) and the cell content was evaluated for each sample. Only tumours containing more than 80% of malignant cells were included in the study. The DNA content was analysed by cytoflourimetric assay on formalin-fixed, paraffin-embedded samples, carried out under a cytofluorimeter (FACScan, Becton Dickinson, NJ, USA) on at least 20,000 events. The results were analysed by means of ModFit LTTM software (Verity Software House, USA). The patients’ peripheral blood cells were collected with the aim of providing normal reference DNA for the assessment of gene copy changes in the tumour samples. Double-colour FISH on tumour interphase nuclei and LOH-PCR for chromosome 1p36. Chromosome 1p36 deletion was assessed by double-colour FISH on interphase nuclei of cell tumour touch preparations. The P1-79 (locus D1Z2 at 1pter) and QC (chromosome 1 centromere) probes were labelled with biotin-16-dUTP and digoxigenin-11-dUTP, respectively. MYCN amplification was detected using the MYCN and D2Z probes (chromosome 2 centromere) (Appligene Oncor). LOH was studied by a PCR-based method using primer sets for D1S80 and D1S76 loci mapping to subtelomeric region of chromosome 1p36. FISH results for chromosome 1p36 and MYCN and LOH for D1S76 and D1S80 have been reported according to Ambros et al. (37). Array comparative genomic hybridization (aCGH). Total genomic DNA (gDNA) was extracted from the tumour samples and normal
246
peripheral blood lymphocytes of NB patients, according to Sambrook et al. (38). In order to optimize the protocol, 5 Ìg of gDNA of each sample were treated with DNAse to obtain fragments smaller than 500 bp. After purification with the QIAquick-PCR purification kit (Qiagen GmbH, Hilden, Germany), fragmented gDNA was labelled by direct enzymatic incorporation of fluorescent tags. The gDNA was labelled with Cy3-dCTP or Cy5-dCTP (Amersham Biosciences, Piscataway, NJ, USA) using the RandomPrimed Bioprime DNA Labelling kit (Invitrogen Life Technologies, Carlsbad, CA, USA). Briefly a 50-Ìl reaction contained dATP, dGTP and dTTP (120 ÌM each), dCTP (60 ÌM) and Cy3-dCTP (60 ÌM) or Cy5-dCTP (60 ÌM). After incubation with Klenow Fragment (40 units) at 37ÆC for 2 h, the reaction was stopped with 0.5 M EDTA, pH 8.0. The average size of the fragmented labelled target was between 50 and 200 bp. Unincorporated nucleotides were removed on a Sephadex G50 microspin column (Amersham Biosciences), according to the manufacturer’s protocol. The pooled Cy3- and Cy5-labelled DNA targets were mixed with 30 Ìg of human Cot-1 DNA (Invitrogen Life Technologies) and 100 Ìg of yeast tRNA (Invitrogen Life Technologies), 20 mg of poly(dA-dT) (Sigma) and ethanol-precipitated. The solution was rinsed twice in 70% cold ethanol and air-dried. A total of 205 probes, that are 5'-MMT modified 55-base long nucleotide oligonucleotides (MWG Biotech, Ebersberg, Germany), were used. The oligonucleotides were selected at chromosome regions known as frequently deleted (1p13.2-p36.33, 9p21.3-p24.2, 11q12.2-q23.2, 14q24.2-q33) and gained (2p13.3-p24.3, 2q36.1, 7q21.11-q34, 12q14.1-q24.31, 17q11.2-q25.3) in NB cells. The arrays also contained baseline oligonucleotide mapping at the 1q21.2q23.2, 2q13-q34, 3q22.3-q25.1, 5p13.1-5q34, 6p22.1-6p25.1, 7p11.2p22.1, 8p12-q23.1, 9q22.31-q31.3, 11p15.1-p15.4, 12p13.31, 14p11.2, 15q21.2 and 17p11.2-p13.3 regions. These baseline features have been considered as referere genes. Furthermore, Arabidopsis thaliana genes (RCA, rbcL, Cab) (Stratagene, Hogehilweg, The Netherlands) were used as the control for unspecific hybridization. Our microarray yielded an average resolution of 1 Mb within each chromosome region. The oligonucleotides were suspended in 3x SSC in order to give 100 pg/spot of probe and they were spotted by the SpotArray 24 (Perkin-Elmer Precisely, Wellesley, MA, USA) on CreativeChip® Oligo slides (ELIPSA GmbH, Germany). The features of the microarray were arranged on four subgrids. In each subgrid all probes were placed in quintuplicate, for a total of 1044 spots. Arabidopsis thaliana DNA was spotted in each subgrid following a squared design. This design allowed control over the independence of technical replicates and provided a suitable measure of non-specific hybridization within each experimental unit. A post-printing quality control was performed by using the "red reflect" function of ScanArrayì 4000XL (Perkin-Elmer Precisely). Three identical sub-arrays were arranged on each glass slide so that three replicates could be performed for each sample, except one sample which was replicated only twice. The printed slides were incubated at 120ÆC for 30 min. After coupling, the DNA was cross-linked to the slide surface by exposure to 0.30 J/cm2 UV light in the UV CrossLinker Bio-Link® BLX-312 (Eppendorf, Hamburg, Germany). The slides were rinsed in 0.1% SDS for 30 sec and then in distilled water for 15 sec. The slides were pre-hybridized at 42ÆC for 4 h, with 15 Ìl of hybridization mix (50% formamide, 5x SSC, 5x Denhardt’s reagent, 0.5% SDS, 5 mM potassium phosphate, at pH 7.2) containing 30 Ìg of salmon sperm DNA (Eppendorf). The slides
Scaruffi et al: Array-CGH Analysis of Neuroblastoma Tumours
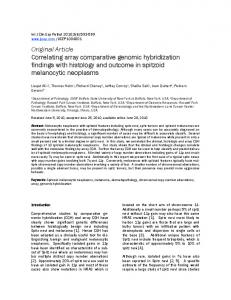
Figure 1. MA-plots of the average log-ratios (M-values) for each NB sample. Being R and G, the normalized and scaled red and green intensities for each spot, respectively, the expression log-ratio corresponding to a spot is M=log2R-log2G, whereas the log-intensity of a spot is defined as A=(log2R+log2G)/2, a measure of the overall brightness of the spot. Each point above the upper red line corresponds to a gain, whereas each point below the lower blue line corresponds to a loss. For each sample, upper red and lower blue M-axis intercepts correspond to the mean c+ji and the mean c–ji, respectively.
were hybridized in hybridization cassettes (Telechem International, Inc., Sunnyvale, CA, USA) with a mixture containing target DNAs, 30 Ìg of human cot-1 DNA and 100 Ìg of yeast tRNA (denatured by boiling for 5 min and pre-annealed at 37ÆC for 2 hrs) and submerged in a 42ÆC-waterbath for 16-20 h. After hybridization, the slides were gently washed with 2x SSC and 0.1% SDS at 42ÆC for 3 min and with 0.2x SSC and 0.1% SDS at room temperature for 5 min. Finally, the slides were washed at room temperature for 5 min with 0.2x SSC. Spot fluorescence was measured by the ScanArrayì4000XL scanning laser confocal fluorescence microscope (Perkin-Elmer Precisely). Quantification was performed by the fixed method (QuantArray® Analysis software, Perkin-Elmer Precisely), which constructs spot and background masks using spot and background inner/outer diameters. The mean signal intensity was calculated as the sum of the intensity values of each pixel inside the signal area divided by the total number of pixels in the signal region. The same
procedure was applied for the background intensity, with the exception that only pixels outside the signal area were considered. Spots showing abnormal hybridization signals were not included in any further analysis. Statistical methods. Spots with a signal-to-noise ratio lower than 2.1 were considered unreliable and were removed before the statistical analysis. Background-subtracted fluorescence log-ratios were normalized within each array by using print-tip loss normalization (39) available in the Bioconductor limma package (40, 41). Print-tip loss normalization was applied in order to correct the expression log-ratios both for sub-array spatial variation and for intensity-based trends. In practice, this is done by subtracting from each expression log-ratio the corresponding value of the tip-group loess curve, where the loess curve in each tip-group is constructed by performing a series of local regressions, one local regression for each point in the MA-plot
247
CANCER GENOMICS & PROTEOMICS 3: 245-252 (2006) (42). Only spots corresponding to the reference genes have been used in the construction of the tip-group loess curve. In order to make all technical replicates comparable, expression log-ratios of each replicate was scaled so as to have the same median-absolutedeviation (MAD) across all the arrays in each group of replicates. The minimum requirement was the homogeneity of MAD’s within replicates of the same sample. To scale the expression log-ratios, the algorithm proposed by Yang et al. (43) was adopted, in the implemented version by Smyth (44) available in the limma package. A threshold method for selecting genes with extreme logratios was then applied to automatically classify gene gains or losses. In each array, all the normalized expression log-ratios corresponding to the 67 reference genes were plotted to a normal quantile-quantile (QQ) plot to establish the threshold bounds for the gain/loss assessment. Based on the observation of the proportions of log-ratios which lay on the line which passes through the first and third quartiles in all the QQ plots, for each replicate j of each sample i, the two thresholds, c+ji and c–ji , were computed such that c+ji=meanji+sdji, where meanij and sdij are the mean and the standard deviation of control genes log-ratio distributions corresponding to the j replicate of the i sample, respectively. Then, for each sample i, those genes whose mean logratio according to the replicates of sample i was greater than the mean c+ji were scored as gain. Conversely, those genes whose mean log-ratio on the replicates of sample i was lower than the mean c–ji were scored as loss.
Results In this study, the ability of long oligonucleotide (55-mer) aCGH to detect and to map regions of gain and loss throughout the genome was investigated. To first test the quality of the assay and the intrinsic variability of the method, DNA obtained from pooled genomic DNAs extracted from peripheral blood lymphocytes of NB patients was used. Hybridizations with normal DNA on both channels were performed using the same batch of microarrays, with identical labelling and hybridization conditions applied to the tumour analyses. Three replicate aCGH experiments demonstrated good reproducibility and, as expected, no gene copy number changes were found (data not shown). Next, the copy number variations in 15 primary NB tumours were measured. Figure 1 shows the MA-plots of the normalized average log-ratios (Mvalues) for each NB sample. Upper and lower M-axis intercepts correspond to the mean c+ji and the mean c–ji, respectively. The red line corresponds to the threshold to be reached for a gene to be scored as amplified. Conversely, each point below the lower line represents a loss. In these microarrays the percentage of non-hybridizing oligonucleotides was high (~40%). Because of low signal-tonoise ratios, hybridization to some oligonucleotides was inadequate to allow precise analysis of that portion of the genome and to detect gains and losses with sufficient statistical certainty. To assess the accuracy of the imbalances detected by aCGH analysis, the aCGH results were compared to conventional
248
methods of copy number determination at selected loci. The aCGH results were verified with double-colour FISH on interphase nuclei and genotyping by PCR specific for the two major prognostic markers for NB (MYCN locus and chromosome 1p36 region) (Table I). According to the FISH analysis, MYCN amplification and 1p36 chromosome loss were observed in seven samples (#772, #802, #1123, #1243, #1307, #1363, #1486), while sample #1488 showed only 1p36 loss. Chromosome 1p FISH data were not available for sample #1187, though no evidence of 1p36 LOH was detected by PCR. There was complete concordance between the aCGH results and the MYCN locus genomic amplification detected by FISH. Altogether, genes mapping to chromosome band 2p24 were observed to be co-amplified with MYCN, including DDX1 and neuroblastoma amplified gene (NAG). This implies that in all seven MYCN-amplified samples the MYCN amplicon is a ~2 Mb region (www.ensembl.org). Furthermore, the sensitivity and the specificity of our aCGH platform in detecting gains and losses were estimated. For this purpose, FISH for the MYCN gene and chromosome 1p36 was used as a reference method to calculate the correctly identified ratios of gain/loss and of no gain/no loss. Table II shows that the mean sensitivity of aCGH in detecting a loss of the 1p36 chromosome region based on the 14 genes selected was 8.7%, with a specificity of 78.4%. Looking at each oligonucleotide mapping at the 1p36 chromosome region, p73 showed the highest sensitivity and four probes (TNFRSF1B, HBACH, KIAAA0444 and CDC2L1) were never classified as falsepositive (specificity 100%). MYCN amplification was correctly recognized by aCGH in all samples reported as positive by FISH analysis. Therefore, the sensitivity of aCGH in detecting MYCN amplification was found to be 100% and the specificity 87.5%, due to one false-positive value (sample #1361).
Discussion A number of reports of conventional chromosome-based CGH have described a wide variation of numerical aberrations in NB tumours (8-11, 13-19). However, the relatively low resolution of mCGH means that further experiments are necessary to provide detailed positional mapping of gained/lost sequences of interest. To overcome this limit, several authors performed aCGH on BACs, PACs, cosmids or cDNAs to detect unbalanced chromosomal aberrations with high resolution (25, 30, 31, 33, 35). Efforts have been made to improve the resolution and the sensitivity of our previous cDNA-based NB-specific platform (34). We have designed a 55-mer oligonucleotide microarray that covers several regions containing genes known to be involved in NB progression. It is noteworthy that the eligibility of the NB samples for this study was carefully checked, in order to avoid tumour/normal hybridization ratio bias due to tumour heterogeneity, the
Scaruffi et al: Array-CGH Analysis of Neuroblastoma Tumours
Table I. Evaluation of MYCN gene status and chromosome 1p36 loss with FISH in 15 NB samples.
Table II. Sensitivity and specificity of MYCN gain and chromosome 1p36 loss by aCGH (standard classification based on FISH/LOH PCR).
FISH Sample # 772 802 1084 1123 1187 1197 1243 1272 1307 1350 1361 1363 1398 1486 1488 apresence
True positives
MYCN gain
1p36 loss
Yes Yes No Yes No No Yes No Yes No No Yes No Yes No
Del Del No Del No LOHa n.d. Del No Del No No Del No Del Del
of PCR-based LOH; n.d.=not determined; Del=deletion.
presence of Schwann stromal cells, granulation, fibrous and lymphoid tissues in the sample. Histology was evaluated before DNA purification and only diploid DNA specimens containing more than 80% of malignant cells were included in the analysis. MYCN amplification remains a powerful predictor of poor survival probability in NB patients (45). According to the European Neuroblastoma Quality Assessment Group guidelines, Southern blot and PCR are not recommended for use as the only methods for MYCN evaluation without FISH analysis (35, 37). MYCN heterogeneous amplifications or gains cannot be reliably detected by Southern blot and PCR methods, unlike FISH, which is done at the single cell level. Our results showed that the allelic status of 2p24 (MYCN) was detected by aCGH, in complete concordance with the data obtained by FISH technique. MYCN amplification usually involves a large and variable number of DNA sequences flanking the MYCN region at chromosome 2p24. Our aCGH platform was able to characterize both the extent and the complexity of the amplified sequences associated with the MYCN amplicons that have been difficult to identify by cytogenetic methods. It was observed that genes mapping to chromosome band 2p24 were co-amplified with MYCN, including DDX1 (DEAD/H-BOX1) and the neuroblastoma amplified gene (NAG). NAG has previously been observed to be part of the MYCN amplicon, although its function is still unknown (46). The oncogene DDX1 belongs to a family of genes that encode DEAD box proteins, putative ATP-dependent RNA helicases (47). Amplification of DDX1 was observed to be associated with MYCN amplification in human NB cell lines and in
True negatives
N*
%
N*
%
MYCN
7/7
100
7/8
87.5
Chromosome 1p HSPG2 ID3 CASP9 NBL1 TNFRSF1B UBE4B HBACH ICMT KCNAB2 KIAA0444 NPHP4 RPL22 P73 CDC2L1
1/7 0/7 0/7 0/7 0/7 0/7 0/7 1/7 0/7 1/5 0/7 0/7 4/7 1/6
14 0 0 0 0 0 0 14 0 20 0 0 57 17
5/8 3/4 4/7 7/8 8/8 5/7 8/8 7/8 4/5 8/8 6/8 7/8 1/6 6/6
Gain Loss 62 75 57 87 100 71 100 87 80 100 75 87 17 100
*N: for each probe only spots with a signal-to-noise ratio higher than 2.1 were considered.
50-70% of primary tumours (48-53). Therefore, the utility of this oligonucleotide aCGH for characterizing gene amplifications was demonstrated. Deletions of the short arm of chromosome 1 are common chromosome alterations of NB cell lines and have been found in 19% to 36% of primary tumours (54-57). There is a correlation between 1p loss and high-risk features such as age, diagnosis over one year, metastatic disease and MYCN amplification. Thus, chromosome 1p analysis may identify patients who are more likely to suffer disease relapse (55, 56). Previous reports from Takeda et al. (58) and from our group (59) showed that interstitial and large deletions are detectable both in localized and disseminated tumours. This is an important issue because it has been postulated that tumours with large deletions generally also have MYCN amplification and a poor probability of survival, whereas those with smaller deletions are more likely to have a single copy of MYCN and a favourable clinical outcome (58). The oligonucleotide-based aCGH approach has the advantage of offer the possibility of detecting 1p loss at several loci in a single assay. In order to provide an extensive coverage of the 1p chromosome, thirty-four oligonucleotides were printed, spanning from 1p36.33 to 1p13.2 region. This also implies that losses are mapped by their gene position and that the analysis can directly provide a list of candidate NB-associated genes within the region of interest. One long-standing concern has been whether the high complexity of the full genome would undermine the accurate
249
CANCER GENOMICS & PROTEOMICS 3: 245-252 (2006) reporting potential of short DNA probes on a microarray. First, two types of oligo-microarrays have shown their usefulness in detecting genomic alterations (60-62). One platform uses photoprinted custom-designed 70-mer, whereas another is a single-nucleotide polymorphism array. In both cases, a PCR-based genomic representation is required to reduce the complexity of input genomic DNA by 98% as a means to improve the hybridization kinetics (60-63). Recently, Brennan et al. (64) provided evidence of the reliable detection of single copy number alterations in full-complexity genomic DNA, using a commercially available 60-mer platform. Our study highlighted that the PCR enrichment step is not necessary to reduce the genome complexity before hybridization to the microarray. Direct genome labelling and hybridization eliminate prevailing concerns about the impact of PCR amplification biases on the result. This study demonstrated that the 55-mer oligonucleotide probes, designed and validated for gene expression profiling, can reproducibly assess variable amplicons even using whole genomes as targets. On the contrary, these molecules are unreliable features for the detection of single-copy deletions with high sensitivity. Our findings imply that this microarray platform optimized for mRNA profiling achieves measurements of genomic DNA copy number changes with low accuracy. These probes, although unique in the transcriptome, could have homology with more than one site in the whole human genome. Moreover, in our experiments it was necessary to discard measurements on several clones because they did not provide valuable signals. These non-hybridizing oligos could be explained by the fact that they cross mRNA splice boundaries and, consequently, are not contiguous in the genome. We believe that the performance of our oligonucleotide platform could be improved by using a dedicated oligo library specifically designed for aCGH. Such a genomic array may provide representations of both gene-specific and unique intragenic sequences. The oligos targeted to noncoding DNAs may represent important regulatory regions, including regulatory elements and microRNAs. Moreover, the commercial availability of oligonucleotide libraries specifically dedicated to aCGH will guarantee standardization and reproducibility, two important issues especially in diagnosis. Finally, this perspective obviates the need for in-house microarray printing facilities and provides increased access to the scientific community. Each approach has its own advantages and disadvantages, with commercial sources undoubtedly costing more in comparison to in-house-printed arrays. In the future, the balance between costs and the robustness of the data will be assessed in order to choose the most suitable platform for each specific aCGH application.
Acknowledgements We are grateful to the surgeons, clinicians and pathologists of the Italian Cooperative Group for Neuroblastoma and to AIEOP
250
(Associazione Italiana di Ematologia e Oncologia Pediatrica) for providing the tumour samples. Special thanks to Claudio Gambini, Department of Pathology, Gaslini Children's Hospital, Genoa, Italy, for evaluation of the tumour cell content. This work was supported by the Italian Neuroblastoma Foundation, the Associazione Italiana per la Ricerca sul Cancro (AIRC) and the Ministero dell’Università e della Ricerca Scientifica e Tecnologica, Italy. K.M., R.D. and D.A. are fellows of the Italian Neuroblastoma Foundation.
References 1 Brodeur GM: Neuroblastoma: biological insights into a clinical enigma. Nat Rev Cancer 3: 203-216, 2003. 2 Westermann F and Schwab M: Genetic parameters of neuroblastomas. Cancer Lett 184(2): 127-147, 2002. 3 Tonini GP and Romani M: Genetic and epigenetic alterations in neuroblastoma. Cancer Lett 197(1-2): 69-73, 2003. 4 Guo C, White PS, Weiss MJ, Hogarty MD, Thompson PM, Stram DO, Gerbing R, Matthay KK, Seeger RC, Brodeur GM and Maris JM: Allelic deletion at 11q23 is common in MYCN single copy neuroblastomas. Oncogene 18: 4948-4957, 1999. 5 Maris JM, Weiss MJ, Guo C, Gerbing RB, Stram DO, White PS, Hogarty MD, Sulman EP, Thompson PM, Lukens JN, Matthay KK, Seeger RC and Brodeur GM: Loss of heterozygosity at 1p36 independently predicts for disease progression but not decreased overall survival probability in neuroblastoma patients: a Children's Cancer Group study. J Clin Oncol 18(9): 1888-1889, 2000. 6 Bown N, Cotterill S, Lastowska M, O'Neill S, Pearson AD, Plantaz D, Meddeb M, Danglot G, Brinkschmidt C, Christiansen H, Laureys G, Speleman F, Nicholson J, Bernheim A, Betts DR, Vandesompele J and Van Roy N: Gain of chromosome arm 17q and adverse outcome in patients with neuroblastoma. N Engl J Med 340(25): 1954-1961, 1999. 7 Maris JM and Matthay KK: Molecular biology of neuroblastoma. J Clin Oncol 17(7): 2264-2279, 1999. 8 Kallioniemi A, Kallioniemi OP, Sudar D, Rutovitz D, Gray JW, Waldman F and Pinkel D: Comparative genomic hybridization for molecular cytogenetic analysis of solid tumors. Science 258(5083): 818-821, 1992. 9 Van Gele M, Van Roy N, Jauch A, Laureys G, Benoit Y, Schelfhout V, De Potter CR, Brock P, Uyttebroeck A, Sciot R, Schuuring E, Versteeg R and Speleman F: Sensitive and reliable detection of genomic imbalances in human neuroblastomas using comparative genomic hybridisation analysis. Eur J Cancer 33(12): 1979-1982, 1997. 10 Vandesompele J, Van Roy N, Van Gele M, Laureys G, Ambros P, Heimann P, Devalck C, Schuuring E, Brock P, Otten J, Gyselinck J, De Paepe A and Speleman F: Genetic heterogeneity of neuroblastoma studied by comparative genomic hybridization. Genes Chromosomes Cancer 23(2): 141-152, 1998. 11 Brinkschmidt C, Poremba C, Christiansen H, Simon R, Schafer KL, Terpe HJ, Lampert F, Boecker W and Dockhorn-Dworniczak B: Comparative genomic hybridization and telomerase activity analysis identify two biologically different groups of 4s neuroblastomas. Br J Cancer 77(12): 2223-2229, 1998. 12 Cunsolo CL, Bicocchi MP, Petti AR and Tonini GP: Numerical and structural aberrations in advanced neuroblastoma tumours by CGH analysis; survival correlates with chromosome 17 status. Br J Cancer 83(10): 1295-1300, 2000.
Scaruffi et al: Array-CGH Analysis of Neuroblastoma Tumours
13 Breen CJ, O'Meara A, McDermott M, Mullarkey M and Stallings RL: Coordinate deletion of chromosome 3p and 11q in neuroblastoma detected by comparative genomic hybridization. Cancer Genet Cytogenet 120(1): 44-49, 2000. 14 Vandesompele J, Speleman F, Van Roy N, Laureys G, Brinskchmidt C, Christiansen H, Lampert F, Lastowska M, Bown N, Pearson A, Nicholson JC, Ross F, Combaret V, Delattre O, Feuerstein BG and Plantaz D: Multicentre analysis of patterns of DNA gains and losses in 204 neuroblastoma tumors: how many genetic subgroups are there? Med Pediatr Oncol 36(1): 5-10, 2001 15 Plantaz D, Vandesompele J, Van Roy N, Lastowska M, Bown N, Combaret V, Favrot MC, Delattre O, Michon J, Benard J, Hartmann O, Nicholson JC, Ross FM, Brinkschmidt C, Laureys G, Caron H, Matthay KK, Feuerstein BG and Speleman F: Comparative genomic hybridization (CGH) analysis of stage 4 neuroblastoma reveals high frequency of 11q deletion in tumors lacking MYCN amplification. Int J Cancer 91(5): 680-686, 2001. 16 Brodeur GM, Azar C, Brother M, Hiemstra J, Kaufman B, Marshall H, Moley J, Nakagawara A, Saylors R, Scavarda N et al: Neuroblastoma. Effect of genetic factors on prognosis and treatment. Cancer 70: 1685-1694, 1992. 17 Brinkschmidt C, Christiansen H, Terpe HJ, Simon R, Boecker W, Lampert F and Stoerkel S: Comparative genomic hybridization (CGH) analysis of neuroblastomas – an important methodological approach in paediatric tumour pathology. J Pathol 181(4): 394400, 1997. 18 Cohen N, Betts DR, Trakhtenbrot L, Niggli FK, Amariglio N, Brok-Simoni F, Rechavi G and Meitar D: Detection of unidentified chromosome abnormalities in human neuroblastoma by spectral karyotyping (SKY). Genes Chromosomes Cancer 31(3): 201-208, 2001 19 Schleiermacher G, Janoueix-Lerosey I, Combaret V, Derre J, Couturier J, Aurias A and Delattre O: Combined 24-color karyotyping and comparative genomic hybridization analysis indicates predominant rearrangements of early replicating chromosome regions in neuroblastoma. Cancer Genet Cytogenet 141(1): 32-42, 2003. 20 Parente F, Gaudray P, Carle GF and Turc-Carel C: Experimental assessment of the detection limit of genomic amplification by comparative genomic hybridization CGH. Cytogenet Cell Genet 78(1): 65-68, 1997. 21 Solinas-Toldo S, Lampel S, Stilgenbauer S, Nickolenko J, Benner A, Dohner H, Cremer T and Lichter P: Matrix-based comparative genomic hybridization: biochips to screen for genomic imbalances. Genes Chromosomes Cancer 20(4): 399-407, 1997. 22 Pinkel D, Segraves R, Sudar D, Clark S, Poole I, Kowbel D, Collins C, Kuo WL, Chen C, Zhai Y, Dairkee SH, Ljung BM, Gray JW and Albertson DG: High resolution analysis of DNA copy number variation using comparative genomic hybridization to microarrays. Nat Genet 20(2): 207-211, 1998. 23 Snijders AM, Nowak N, Segraves R, Blackwood S, Brown N, Conroy J, Hamilton G, Hindle AK, Huey B, Kimura K, Law S, Myambo K, Palmer J, Ylstra B, Yue JP, Gray JW, Jain AN, Pinkel D and Albertson DG: Assembly of microarrays for genome-wide measurement of DNA copy number. Nat Genet 29(3): 263-264, 2001. 24 Pollack JR, Perou CM, Alizadeh AA, Eisen MB, Pergamenschikov A, Williams CF, Jeffrey SS, Botstein D and Brown PO: Genome-wide analysis of DNA copy-number changes using cDNA microarrays. Nat Genet 23(1): 41-46, 1999.
25 Chen QR, Bilke S, Wei JS, Whiteford CC, Cenacchi N, Krasnoselsky AL, Greer BT, Son CG, Westermann F, Berthold F, Schwab M, Catchpoole D and Khan J: cDNA array-CGH profiling identifies genomic alterations specific to stage and MYCN-amplification in neuroblastoma. BMC Genomics 5(1): 70, 2004. 26 Bilke S, Chen QR, Whiteford CC and Khan J: Detection of low level genomic alterations by comparative genomic hybridization based on cDNA micro-arrays. Bioinformatics 21(7): 1138-1145, 2005. 27 Pollack JR, Sorlie T, Perou CM, Rees CA, Jeffrey SS, Lonning PE, Tibshirani R, Botstein D, Borresen-Dale AL and Brown PO: Microarray analysis reveals a major direct role of DNA copy number alteration in the transcriptional program of human breast tumors. Proc Natl Acad Sci USA 99(20): 12963-12968, 2002. 28 Hyman E, Kauraniemi P, Hautaniemi S, Wolf M, Mousses S, Rozenblum E, Ringner M, Sauter G, Monni O, Elkahloun A, Kallioniemi OP and Kallioniemi A: Impact of DNA amplification on gene expression patterns in breast cancer. Cancer Res 62(21): 6240-6245, 2002. 29 Selzer RR, Richmond TA, Pofahl NJ, Green RD, Eis PS, Nair P, Brothman AR and Stallings RL: Analysis of chromosome breakpoints in neuroblastoma at sub-kilobase resolution using fine-tiling oligo nucleotide array CGH. Genes Chromosomes Cancer 44(3): 305-319, 2005. 30 Scaruffi P, Valent A, Schramm A, Astrahantseff K, Eggert A and Tonini GP: Application of microarray-based technology to neuroblastoma. Cancer Lett 228(1-2): 13-20, 2005. 31 Beheshti B, Braude I, Marrano P, Thorner P, Zielenska M and Squire JA: Chromosomal localization of DNA amplifications in neuroblastoma tumors using cDNA microarray comparative genomic hybridization. Neoplasia 5(1): 53-62, 2003. 32 De Preter K, Pattyn F, Berx G, Strumane K, Menten B, Van Roy F, De Paepe A, Speleman F and Vandesompele J: Combined subtractive cDNA cloning and array CGH: an efficient approach for identification of overexpressed genes in DNA amplicons. BMC Genomics 5(1): 11, 2004. 33 Mosse YP, Greshock J, Margolin A, Naylor T, Cole K, Khazi D, Hii G, Winter C, Shahzad S, Asziz MU, Biegel JA, Weber BL and Maris JM: High-resolution detection and mapping of genomic DNA alterations in neuroblastoma. Genes Chromosomes Cancer 43(4): 390-403, 2005. 34 Scaruffi P, Parodi S, Mazzocco K, Defferrari R, Fontana V, Bonassi S and Tonini GP: Detection of MYCN amplification and chromosome 1p36 loss in neuroblastoma by cDNA microarray comparative genomic hybridization. Mol Diagn 8(2): 93-100, 2004. 35 Ambros PF and Ambros IM: SIOP Europe Neuroblastoma Pathology, Biology, and Bone Marrow Group. Pathology and biology guidelines for resectable and unresectable neuroblastic tumors and bone marrow examination guidelines. Med Pediatr Oncol 37(6): 492-504, 2001. 36 Shimada H: The International Neuroblastoma Pathology Classification. Pathologica 95(5): 240-241, 2003. 37 Ambros IM, Benard J, Boavida M et al: Quality assessment of genetic markers used for therapy stratification. J Clin Oncol 21: 2077-2084, 2003. 38 Sambrook J, Fritsch EF and Maniatis T: Molecular Cloning. A Laboratory Manual. Second edition. Cold Spring Harbor Laboratory Press, 1989.
251
CANCER GENOMICS & PROTEOMICS 3: 245-252 (2006) 39 Smyth GK and Speed TP: Normalization of cDNA microarray data. Methods 31(4): 265-273, 2003. 40 Smyth GK, Michaud J and Scott HS: Use of within-array replicate spots for assessing differential expression in microarray experiments. Bioinformatics 21(9): 2067-2075, 2005. 41 Gentleman RC, Carey VJ, Bates DM, Bolstad B, Dettling M, Dudoit S, Ellis B, Gautier L, Ge Y, Gentry J, Hornik K, Hothorn T, Huber W, Iacus S, Irizarry R, Leisch F, Li C, Maechler M, Rossini AJ, Sawitzki G, Smith C, Smyth G, Tierney L, Yang JYH and Zhang J: Bioconductor: open software development for computational biology and bioinformatics. Genome Biol 5: 80, 2004. 42 Dudoit S, Yang YH, Callow MJ and Speed TP: Statistical methods for identifying differentially expressed genes in replicated cDNA microarray experiments. Statistica Sinica 12: 111-140, 2002. 43 Yang YH, Dudoit S, Luu P and Speed TP: Normalization for cDNA microarray data. In: Microarrays: Optical Technologies and Informatics. Bittner ML, Chen Y, Dorsel AN, Dougherty ER (eds.). Proceedings of SPIE, pp. 141-152, 2001. 44 Smyth GK: Limma: linear models for microarray data. In: Bioinformatics and Computational Biology Solutions using R and Bioconductor. Gentleman R, Carey V, Dudoit S, Irizarry R, Huber W (eds.). Springer, New York, pp. 397-420, 2005. 45 Schmidt ML, Lukens JN, Seeger RC, Brodeur GM, Shimada H, Gerbing RB, Stram DO, Perez C, Haase GM and Matthay KK: Biologic factors determine prognosis in infants with stage IV neuroblastoma: a prospective Children's Cancer Group study. J Clin Oncol 18(6): 1260-1268, 2000. 46 Wimmer K, Zhu XX, Lamb BJ, Kuick R, Ambros PF, Kovar H, Thoraval D, Motyka S, Alberts JR and Hanash SM: Coamplification of a novel gene, NAG, with the N-myc gene in neuroblastoma. Oncogene 18(1): 233-238, 1999. 47 Goodabout R and Squire J: Amplification of a DEAD box protein gene in retinoblastoma cell lines. Proc Natl Acad Sci USA 90: 7578-7582, 1993. 48 Squire JA, Thorner PS, Weitzman S, Maggi JD, Dirks P, Doyle J, Hale M and Goodabout R: Co-amplification of MYCN and a DEAD box gene (DDX1) in primary neuroblastoma. Oncogene 10: 1417-1422, 1995. 49 Manohar CF, Salwen HR, Brodeur GM and Cohn SL: Coamplification and concomitant high levels of expression of a DEAD box gene with MYCN in human neuroblastoma. Genes Chromosomes Cancer 14: 196-203, 1995. 50 Amler LC, Schurmann J and Schwab M: The DDX1 gene maps within 400 kbp 5' to MYCN and is frequently coamplified in human neuroblastoma. Genes Chromosomes Cancer 15: 134-137, 1996. 51 George RE, Kenyon R, McGuckin AG, Kohl N, Kogner P, Christiansen H, Pearson AD and Lunec J: Analysis of candidate gene co-amplification with MYCN in neuroblastoma. Eur J Cancer 33: 2037-2042, 1997. 52 Pandita A, Goodabout R, Zielenska M, Thorner P, Bayani J and Squire JA: Relational mapping of MYCN and DDXI in band 2p24 and analysis of amplicon arrays in double minute chromosomes and homogeneously staining regions by use of free chromatin FISH. Genes Chromosomes Cancer 20: 243-252, 1997. 53 De Preter K, Speleman F , Combaret V, Lunec J, Laureys G, Eussen BH, Francott N, Board J, Pearson AD, De Paepe A, Van Roy N and Vandesompele J: Quantification of MYCN, DDX1, and NAG gene copy number in neuroblastoma using a real-time quantitative PCR assay. Mod Pathol 15: 159-166, 2002.
252
54 Fong CT, Dracopoli NC, White PS, Merrill PT, Griffith RC, Housman DE and Brodeur GM: Loss of heterozygosity for the short arm of chromosome 1 in human neuroblastomas: correlation with N-myc amplification. Proc Natl Acad Sci USA 86(10): 3753-3757, 1989. 55 Maris JM, White PS, Beltinger CP, Sulman EP, Castleberry RP, Shuster JJ, Look AT and Brodeur GM: Significance of chromosome 1p loss of heterozygosity in neuroblastoma. Cancer Res 55(20): 4664-4669, 1995. 56 Caron H, van Sluis P, de Kraker J, Bokkerink J, Egeler M, Laureys G, Slater R, Westerveld A, Voute PA and Versteeg R: Allelic loss of chromosome 1p as a predictor of unfavorable outcome in patients with neuroblastoma. N Engl J Med 334(4): 225-230, 1996. 57 Martinsson T, Sjoberg RM, Hedborg F and Kogner P: Deletion of chromosome 1p loci and microsatellite instability in neuroblastomas analyzed with short-tandem repeat polymorphisms. Cancer Res 55(23): 5681-5686, 1995. 58 Takeda O, Homma C, Maseki N, Sakurai M, Kanda N, Schwab M, Nakamura Y and Kaneko Y: There may be two tumor suppressor genes on chromosome arm 1p closely associated with biologically distinct subtypes of neuroblastoma. Genes Chromosomes Cancer 10(1): 30-39, 1994. 59 Iolascon A, Lo Cunsolo C, Giordani L, Cusano R, Mazzocco K, Boumgartner M, Ghisellini P, Faienza MF, Boni L, De Bernardi B, Conte M, Romeo G and Tonini GP: Interstitial and large chromosome 1p deletion occurs in localized and disseminated neuroblastomas and predicts an unfavourable outcome. Cancer Lett 130(1-2): 83-92, 1998. 60 Lucito R, Healy J, Alexander J, Reiner A, Esposito D, Chi M, Rodgers L, Brady A, Sebat J, Troge J, West JA, Rostan S, Nguyen KC, Powers S, Ye KQ, Olshen A, Venkatraman E, Norton L and Wigler M: Representational oligonucleotide microarray analysis: a high-resolution method to detect genome copy number variation. Genome Res 13(10): 2291-2305, 2003. 61 Bignell GR, Huang J, Greshock J, Watt S, Butler A, West S, Grigorova M, Jones KW, Wei W, Stratton MR, Futreal PA, Weber B, Shapero MH and Wooster R: High-resolution analysis of DNA copy number using oligonucleotide microarrays. Genome Res 14(2): 287-295, 2004. 62 Zhao X, Li C, Paez JG, Chin K, Janne PA, Chen TH, Girard L, Minna J, Christiani D, Leo C, Gray JW, Sellers WR and Meyerson M: An integrated view of copy number and allelic alterations in the cancer genome using single nucleotide polymorphism arrays. Cancer Res 64(9): 3060-3071, 2004. 63 Lucito R, Nakimura M, West JA, Han Y, Chin K, Jensen K, McCombie R, Gray JW and Wigler M: Genetic analysis using genomic representations. Proc Natl Acad Sci USA 95(8): 44874492, 1998. 64 Brennan C, Zhang Y, Leo C, Feng B, Cauwels C, Aguirre AJ, Kim M, Protopopov A and Chin L: High-resolution global profiling of genomic alterations with long oligonucleotide microarray. Cancer Res 64(14): 4744-4748, 2004.
Received April 7, 2006 Accepted April 14, 2006