BIOINFORMATICS
Vol. 15 nos 7/8 1999 Pages 631-643
Oligonucleotide frequency matrices addressed to recognizing functional DNA sites Mikhail P. Ponomarenko 1, Julia V. Ponomarenko 1, Anatoly S. Frolov 1, Olga A. Podkolodnaya 1, Denis G. Vorobyev 1, Nikolay A. Kolchanov 1 and G. Christian Overton 2 1Laboratory
of Theoretical Genetics, Institute of Cytology & Genetics, 10 Lavrentyeva Avenue, Novosibirsk, 630090, Russia and 2Center for Bioinformatics, University of Pennsylvania, 1312 Blockley Hall (6021), 418 Guardian Drive, Philadelphia, PA 19104Ć6145, USA Received on November 30, 1998; revised on April 1, 1999; accepted on April 14, 1999
Abstract Motivation: Recognition of functional sites remains a key event in the course of genomic DNA annotation. It is well known that a number of sites have their own specific oligonucleotide content. This pinpoints the fact that the preference of the site-specific nucleotide combinations at adjacent positions within an analyzed functional site could be informative for this site recognition. Hence, Web-available resources describing the site-specific oligonucleotide content of the functional DNA sites and applying the above approach for site recognition are needed. However, they have been poorly developed up to now. Results: To describe the specific oligonucleotide content of the functional DNA sites, we introduce the oligonucleotide alphabets, out of which the frequency matrix for a given site could be constructed in addition to a traditional nucleotide frequency matrix. Thus, site recognition accuracy increases. This approach was implemented in the activated MATRIX database accumulating oligonucleotide frequency matrices of the functional DNA sites. We have demonstrated that the false-positive error of the functional site recognition decreases if the oligonucleotide frequency matrixes are added to the nucleotide frequency matrixes commonly used. Availability: The MATRIX database is available on the Web, http://wwwmgs.bionet.nsc.ru/Dbases/MATRIX/ and the mirror site, http://www.cbil.upenn.edu/mgs/systems/consfreq/. Contact:
[email protected]. Introduction Recognition of functional sites is one of the key events in genomic DNA annotation (Haussler, 1998). A huge number of methods have been developed so far to address the problem (for a review, see Gelfand, 1995). The most widely used are the matrix methods (Bucher, 1990; Karlin and Brendel, 1992; Quandt et al., 1995; Uberbacher et al., 1996; Chen et al., 1997) based on the evolutionary conserved nucleotides of E Oxford University Press 1999
functional sites. Recent evaluations of the accuracy of these methods for annotation of long genomic DNA fragments (Fickett and Hatzigeorgiou, 1997; Roulet et al., 1998) have, on the one hand, demonstrated dramatic progress in the recognition of unknown genes and regulatory DNA regions and, on the other hand, a demand for a considerable increase in the accuracy of recognition procedures for functional sites for application in genomic DNA annotation (Haussler, 1998). It is well known that a number of functional sites have their specific oligonucleotide content describing the site-specific correlation between the types of nucleotides occupying the adjacent positions within the site. For example, an acceptor splice site has a poly(Y) tract, a 3′ cleavage pre-mRNA site has a G/U-reach downstream element, eukaryotic TATA boxes are often surrounded by CpG islands, etc. Nevertheless, Web-available resources describing the specific oligonucleotide content of the functional DNA and RNA sites, and applying these descriptions to the site recognition procedures, are needed, but have not been developed up to date. In our previous studies (Kel et al., 1993; Ponomarenko et al., 1997), we have used the oligonucleotide content denoted in terms of fuzzy logics and located in the neighborhood environment of the functional DNA or RNA site. In this paper, we have demonstrated that the external oligonucleotide content of a functional site was often useful for recognition of this site (Kel et al., 1993) and prediction of its activity (Ponomarenko et al., 1997). That is why, in the present work, we develop this site-specific oligonucleotide approach to analyze the internal oligonucleotide content of a functional DNA site. In this way, we construct the frequency matrix describing the internal nucleotide content of the functional DNA site and generalizing this commonly accepted approach to describe the internal oligonucleotide content. For this purpose, a number of oligonucleotide alphabets analogous to the canonical nucleotide alphabet {A, T, G, C} were introduced. For example, the W/S-dinucleotide alphabet {WW = (AA, AT, TA, TT), WS = (AG, AC, TG, TC), SW = {GA, GT, CA, CT}, SS = (GG, GC,
631
M.P.Ponomarenko et al.
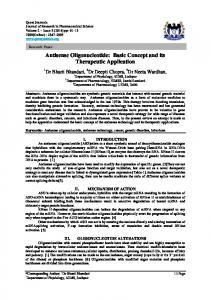
Fig. 1. Scheme of the MATRIX database. Box, data table or tools; arrow, input/output data pathway; solid line, ‘on line’ mode; broken line, ‘off line’ mode (encapsulated).
CG, CC)} includes four pseudoletters {WW, WS, SW, SS} that may be considered as analogues of the four canonical letters {A, T, G, C}. This W/S-dinucleotide alphabet is supposed to be informative for description of the thermodynamic pattern of functional DNA sites. The total number of such oligonucleotide alphabets introduced in this paper is 26. By using these novel alphabets, the frequency matrices of a number of transcription factor binding sites were calculated and accumulated within the MATRIX database. It was found that the false-positive error of the {A, T, G, C} frequency matrix recognition method has been often decreased by using additionally oligonucleotide frequency matrices. The MATRIX database also contains the sets of the site sequences multiply aligned and used to calculate the oligonucleotide frequency matrices. The programs implementing the matrices for site recognition are also contained in the MATRIX database. These programs are documented in the database by their control test results on independent data sets. These aligned site sequences, oligonucleotide frequency matrices and programs are freely available via http://wwwmgs.bionet.nsc.ru/Dbases/MATRIX/.
System and methods The basic scheme of the MATRIX database is shown in Figure 1. It is distributed between two WWW servers: the database server and the application server. The active application WWW server is IIS3.0, URL = . The MATRIX database applications have been implemented in the C language of the ANSI standard. It has
632
been successfully compiled on the Intel PC platform using the Borland C compiler, Version 4.5, under Windows95. The database server is NCSA/1.5, URL = . The MATRIX database tables have been implemented by using the Sequence Retrieval System (SRS) Version 5.1 with its internal version of the programming language ICARUS. It has been successfully compiled on the POWER CHALLENGE M platform (Silicon Graphics), under INIX64 Version 6.1. The MATRIX database has three main tables. First, the data table SAMPLE compiles the sequences of functional sites determined experimentally. Second, the data table ALIGNED lists the site sequences multiply aligned by the standard method maximizing the Gibbs potential score of these site sequences (Lawrence, 1994). Finally, the knowledge table MATRIX contains the oligonucleotide frequency matrices of the sites under study. The programs implementing these matrices for recognition of the sites activate this knowledge table. That is why these programs are documented within this knowledge table by the control test results on the independent experimental data. The MATRIX database is SRS formatted and, hence, commonly accepted through the WWW interface to SRS users (Etzold and Argos, 1993).
Oligonucleotide alphabets introduced The oligonucleotide alphabets introduced are listed in Table 1. The canonical nucleotide {A, T, G, C} is alphabet #1. Berg and von Hippel (1987) have demonstrated that the canonical alphabet frequency matrices of the protein binding sites within
Oligonucleotide frequency matrix
DNA reflect the evolution optimization of these sites in the course of DNA–protein affinity maximization. That is why the canonical frequency matrix is commonly accepted and widely used to recognize the protein binding sites in DNA. Earlier, Kondrakhin et al. (1994) have generalized this canonical alphabet to the trinucleotide {AAA, AAT, …, CCG, CCC} alphabet (Table 1; alphabet #3). It was demonstrated that the frequency matrix of alphabet #3 is informative to describe the site-specific nucleotide combinations located preferably in adjacent positions within the 3′ cleavage premRNA sites and, thus, especially useful to recognize this site
(Kondrakhin et al., 1994). In this paper, we are formally introducing the dinucleotide {AA, AT, …, CG, CC} alphabet #2, because it is naturally ordered as compared to both alphabets, #1 and #3, mentioned above. Since a number of the wellknown functional site consensuses contain the symbol ‘any nucleotide’ x = {A, T, G, C}, we have also inserted this symbol between the canonical nucleotides of alphabets #2 and #3. This results in the appearance of two novel {AxA, AxT, …, CxG, CxC} and {AxAxA, AxAxT, …, CxCxG, CxCxC} alphabets, of the trinucleotide and pentanucleotides, with the holes (Table 1; alphabets #4 and #5).
Table 1. Oligonucleotide alphabets used in the MATRIX database
No.
Name
m
The alphabet {E1, …, Ej , …, Ek – 1, Ek} of the k pseudoletters Ej of m bp in length
K
The DNA–protein affinity optimized (Berg and von Hippel, 1988) 1
N1
1
A, T, G, C
4
Site-specific nucleotide preferences to be in adjacent positions (Kondrakhin et al., 1994) 2
N2
2
AA, AT, AG, AC, TA, TT, TG, TC, GA, …, GC, CA, CT, CG, CC
16
3
N3
3
AAA, AAT, AAG, AAC, ATA, …, CGC, CCA, CCT, CCG, CCC
64
4
N3x
3
AxA, AxT, AxG, AxC, TxA, TxT, …, GxC, CxA, CxT, CxG, CxC
16
5
N5x
5
AxAxA, AxAxT, AxAxG, AxAxC, …, CxCxA, CxCxT, CxCxG, CxCxC
64
The thermodynamic property of the functional DNA site (this work) 6
WS1
2
W, S
2
7
WS2
2
WW, WS, SW, SS
4
8
WS3
3
WWW, WWS, WSW, WSS, SWW, SWS, SSW, SSS
8
9
WS4
4
WWWW, WWWS, WWSW, WWSS, …, SSWS, SSSW, SSSS
16
10
WS3x
3
WxW, WxS, WxS, SxS
4
11
WS5x
5
WxWxW, WxWxS, WxSxW, WxSxS, …, SxWxS, SxSxW, SxSxS
8
12
WS7x
7
WxWxWxW, WxWxWxS, WxWxSxW, …, SxSxWxS, SxSxSxW, SxSxSxS
16
The conformation properties of the functional DNA site (this work) 13
RY1
1
R, Y
4
14
RY2
2
RR, RY, YR, YY
4
15
RY3
3
RRR, RRY, RYR, RYY, YRR, YRY, YYR, YYY
8
16
RY4
4
RRRR, RRRY, RRYR, RRYY, …, YYRR, YYRY, YYYR, YYYY
16
17
RY3x
3
RxR, RxY, YxR, YxY
4
18
RY5x
5
RxRxR, RxRxY, RxYxR, RxYxY, …, YxRxY, YxYxR, YxYxY
8
19
RY7x
5
RxRxRxR, RxRxRxY, RxRxYxR, …, YxYxRxY, YxYxYxR, YxYxYxY
8
The electrostatic properties of the functional DNA site (this work) 20
MK1
1
M, K
21
MK2
2
MM, MK, KM, KK
4 4
22
MK3
3
MMM, MMK, MKM, MKK, KMM, KMK, KKM, KKK
8
23
KM4
4
MMMM, MMMK, MMKM, MMKK, …, KKMK, KKKM, KKKK
16
24
MK3x
3
MxM, MxK, KxM, KxK
4
25
MK5x
5
MxMxM, MxMxK, MxKxM, MxKxK, …, KxKxM, KxKxK
8
26
MK7x
7
MxMxMxM, MxMxMxK, MxMxKxM, …, KxKxKxM, KxKxKxK
16
M = (A, C), K = (G, T), R = (A, G), Y = (T, C), W = (A, T), S = (G, C), x = (A, T, G, C).
633
M.P.Ponomarenko et al.
The dichotomy alphabets {W = (A, T), S = (G, C)}, {R = (A, G), Y = (T, C)} and {M = (A, C), K = (T, G)} are also commonly accepted to make interpretations of the site structures in terms of the thermodynamic, conformation and electrostatic features of the sites. These dichotomy alphabets are used in the present work too (Table 1; alphabets #6, #13 and #20). Similarly, as alphabets #2–#5 were designed from the canonical #1 alphabet, the rest of the oligonucleotide alphabets #7–#12, #14–#19 and #21–#26 were from the dichotomy alphabets #6, #13 and #20, respectively. Thus, the total number of oligonucleotide alphabets used in this work is 26.
Oligonucleotide frequency matrix
Score 0(S) +
For a functional DNA site analysis, the site set {S1 … Sn … SN } was used. It contains N nucleotide sequences Sn = s1n … sin … sLn of L bp in length determined experimentally (where s ∇ {A, T, G, C}). All these sequences are multiply aligned by the standard Gibbs potential method (Lawrence, 1994). The oligonucleotide alphabet {E1, …, Ej , …, Ek } of k pseudoletters Ej = {e1j e2j … emj } of m bp in length is fixed (where e ∇ {A, T, G, C, W = (A, T), S = (G, C), R = (A, G), Y = (T, C), M = (A, C), K = (T, G)}). In these definitions, the oligonucleotide frequency matrix FL – m + 1,k = {fij } is calculated as follows:
ȍ Ȋ d(s N
1) f ij +
m
i)z–1,n
Ů ezj)
n+1 z+1
(1)
N)k
where δ(true) = 1, δ(false) = 0. Formula (1) estimates the frequency value fij of the pseudoletter Ej occupying the ith position within the site sequences multiply aligned, in case the total number of these sequences N is much more than the total number of pseudoletters k in the oligonucleotide alphabets used. That is why, in this work, formula (1) was applied to alphabets #1, #6, #7, #9, #13, #14, #17, #20, #21 and #25 when N > 8, to alphabets #10, #15 and #22 when N > 25, to alphabets #2, #4, #16, #26 when N > 65 and, finally, to alphabet #5 when N > 200.
Partial recognition score For an oligonucleotide frequency matrix FL – m + 1,k = {fij } of length L and an arbitrary DNA sequence S = s1 … si … sL of the same length L, the simplest recognition score is calculated: Score # (S) +
ȍ ȍf
L–m)1
K
i+1
j+1
Ȋ d(s m
ij
i)z–1
Ů ezj)
(2)
z+1
Formula (2) calculates the Score# value, the scale range of which increases with the growth of the site length L, and decreases with the growth of the size k of the oligonucleotide alphabet {E1, …, Ej , …, Ek }. The MATRIX database com-
634
piles a huge number of oligonucleotide frequency matrices for a lot of functional DNA sites differing in length. That is why the user may be confused by the very large number of these oligonucleotide matrices’ Score# values differing by the scale ranges. In this case, according to Zadeh’s fuzzy sets (Zadeh, 1965), it is recommended to transform all the possible Score# scales within the unique normalized scale. Hence, in the present work, the Score values were calculated by formula (2) and then transformed into the normalized partial recognition scale: Score #(S)–
Mean site(Score #))Mean random(Score #)
2 Mean site(Score #)–Mean random(Score #)
(3)
2
where the partial recognition rule is as follows: IF {Score0(S) > 0} THEN {S is this site}, OTHERWISE {S is not this site}. Formula (3) gives the normalized Score0(S), the mean value of which averaged over all the known sequences of the site under study equals 1, whereas the mean value averaged over the random DNA sequences equals –1. This Score0 scale is common for all the oligonucleotide frequency matrices compiled by the MATRIX database for any functional DNA site expressed within any alphabet. We have especially introduced this Score0 scale, common for all recognition procedures, in order to eliminate any confusion concerning a Score0 value interpretation.
Mean recognition score Any functional DNA site may be formally characterized by a number of frequency matrices differing by the oligonucleotide alphabet (Table 1). That is why we have additionally designed the simplest procedure for the simultaneous application of all available matrices of a given functional DNA site to recognize this site within an arbitrary DNA sequence. For the fixed set {F1, …, Fq , …, FQ } of the Q frequency matrices having the Score0,q(S)s calculated from a sequence S, the simplest simultaneous recognition procedure recommended by decision making theory (Fishburn, 1970) is their arithmetically averaged recognition score:
ȍ Score Q
Score ȍ(S) + 1 Q
0,q
(S)
(4)
q+1
where the recognition rule is as follows: IF {ScoreΡ(S) > 0} THEN {S is this site}, OTHERWISE {S is not this site}. Formula (4) is the most clear computational procedure for the simultaneous application of the several recognition procedures available. For this reason, we have especially chosen this simplest procedure [formula (4)] to make the simultaneous recognition by a number of frequency matrices the
Oligonucleotide frequency matrix
most friendly for users who can, in this case, clearly understand how it works.
Table MATRIX of the database We compile all the oligonucleotide frequency matrices calculated for a given functional DNA site within the MATRIX table of the database described (Figure 1). Each of the MATRIX table entries compiles all the oligonucleotide frequency matrices of the fixed site and, in addition, the simplest procedure (4) for the simultaneous usage of these matrices for this site recognition. Figure 2 exemplifies the MATRIX table entry for the NF-1 transcription factor binding site. One can see that this entry is SRS formatted (Etzold and Argos, 1993). The line MI contains the unique identifier ‘NF-1’ of this entry within the whole MATRIX table. The line MN denotes the name of the functional DNA site, oligonucleotide frequency matrices of which are stored within this entry. The line DR links this MATRIX entry to the SRS-formatted databases. In the example given, there are two lines DR to link with databases SAMPLE and ALIGNED containing the experimental data used to calculate each oligonucleotide frequency matrix compiled within this MATRIX entry. We suppose that it is important to inform a user about the experimental data used to create suggested recognition procedures. The line C-CODE contains the program generated automatically in the ‘C’ language of the ANSI standard. This entry has two types of such programs recognizing the NF-1 transcription factor binding sites within an arbitrary DNA sequence. First, the program, the body of which contains the oligonucleotide frequency matrix of this site, calculates this matrix Score0 value [formula (2)] and then applies the partial recognition rule [formula (3)]. Second, the program applying simultaneously all these partial recognition procedures of the first type makes the simplest mean recognition [formula (4)] of the site in question. The lines DP, PV, ST, NT and FG additionally accompany each C-CODE line. The lines DP and PV describe the oligonucleotide alphabets used (Table 1). The remaining three lines contain the control results of the recognition program test on independent experimental data. The line ST provides the mean value of the program Score, the standard deviation of this mean value, and the I type error rate (‘false negative’), which have been determined on the independent control sequences of the site in question, not used yet. The line NT serves to list the same characteristics on the control test sample (mean Score, standard deviation and ‘false positive’) obtained on 1000 random DNA sequences. The line FG links to the histogram figure illustrating the control results of the described program tested on independent experimental data. We suppose that it is important to inform a user about the control test results of each of the recognition programs available through the MATRIX database.
Finally, the entry in question contains the line WW linking to the Web-based tools implementing each C program documented within this entry to recognize the site in question within arbitrary DNA sequences. The MENU window of the tools panel is shown in Figure 3. There is the field ‘Input DNA Sequence’ with three options, namely: ‘from Screen’, ‘from Database’ and ‘from File’. A user should input the DNA sequence of interest into the recognition tools through this special field. Next, each C program documented within the MATRIX entry has a check-box in the MENU windows. Clicking one of these buttons, a user may select a recognition program to use. Finally, a user may start the tools to work by clicking the button ‘Execute’. Figure 4 shows the tools output data, namely, the profile of the Score value under the sequence inputted. The positive peaks of this profile pinpoint the potential site recognized. Each MATRIX entry has the tools providing the use of C programs of this entry.
Algorithm We use the step-by-step algorithm to develop and update the MATRIX database (Figure 5).
Step 1 Any nucleotide sequence of a given functional DNA site is compiled with the relevant data from TRANSFAC (Heinemeyer et al., 1999) and TRRD (Kolchanov et al., 1999) databases and the current literature. In this way, the only experimentally detected site sequences are selected, and the site sequences detected ‘by homology’ and ‘by similarity’ are discarded. The resulting set of site sequences is SRS formatted and then added to the current release of the SAMPLE table by the respective SRS tools.
Step 2 The fixed site sequences available in the SAMPLE table are multiply aligned by using the standard method maximizing the Score value of the Gibbs potential function for the sequences multiply aligned (Lawrence, 1994). In this way, for each site sequence, both positively and negatively oriented DNA chains are considered to select the only one which is highly contributing into the Gibbs potential function Score of the site in question (Lawrence, 1994). The set of site sequences multiply aligned is SRS formatted and then added to the current release of the ALIGNED table by the SRS tools.
Step 3 The fixed set of site sequences available in the ALIGNED table is randomly divided into two non-overlapping 50% subsets: the training and control ones, respectively. This step is very important in the course of MATRIX database
635
M.P.Ponomarenko et al.
Fig. 2. An entry of the MATRIX table by an example of the oligonucleotide frequency matrices of the NF-1 transcription factor binding site.
636
Oligonucleotide frequency matrix
Fig. 3. The MENU window of the program recognizing the functional DNA site by their oligonucleotide frequency matrices (the NF-1 transcription factor binding site is taken as an example).
development and updating because it provides the independence between generating and testing of the oligonucleotide frequency matrices. We suppose that it is important to accompany each recognition program available from the MATRIX database by the control test results on independent experimental data.
Step 4 In this step, only the TRAINING 50% subset of the analyzed site sequences multiply aligned is used. All the possible oligonucleotide frequency matrices are calculated by formula (1) and then each of these frequency matrices is transformed into its C program recognizing this site by
formula (3) and, finally, it is stored in the field C-CODE of the respective MATRIX table entry. Analogously, the C program of the mean frequency recognition is also generated and accumulated.
Step 5 In this step, only the CONTROL 50% subset of the analyzed site sequences multiply aligned is used. Each C program recognizing the site in question is stored in the MATRIX table and those that are not documented yet are tested. The control results of the program testing on independent experimental data are stored in the fields ST, NT and FG accompanying the C program in the respective entry of the MATRIX table. The
637
M.P.Ponomarenko et al.
Fig. 4. The RESULT window of the program recognizing the functional DNA site by their oligonucleotide frequency matrices. The sequence ‘cgatactttccattactaatccataacatg gctctttgccacaactctcttta ttggctatatgccaa tacactgtccttcagagactgacacggactct gtatttttac aggatggggt’ of the EMBL ID = HEHCMVCG in between positions –173438 and –173319 of the negative DNA chain was input. This sequence containing the NF-1 transcription factor binding site is in bold and capitalized. This known site of the sequence inputted was recognized correctly by the highest peak located in the center of the diagram.
flat file of generated, tested and documented recognition programs is SRS formatted and added to the current release of the MATRIX table.
Step 6 The above programs are compiled in the executable computer code and respective Web-based tools recognizing the functional site under study in an arbitrary DNA sequence. After that, the MATRIX database becomes ready to use.
638
Implementation and results Currently, the MATRIX database contains >600 oligonucleotide frequency matrices calculated for >40 types of functional DNA sites. Each entry of this database corresponds to the fixed functional DNA sites type. For example, the SRS-formatted entry containing the oligonucleotide frequency matrices of the NF-1 transcription factor binding site is described in detail in System and methods (Figure 2). The Web-based tools activating this MATRIX entry for recognition of NF-1 transcription factor binding sites is also shown
Oligonucleotide frequency matrix
Fig. 5. Algorithm for developing and updating the MATRIX database.
in Figure 3 (MENU window) and in Figure 4 (RESULT window). In this section, we focus our attention on the recognition accuracy of the oligonucleotide frequency matrices introduced here. In this way, the detailed data on the control testing of the oligonucleotide frequency matrices of NF-1 transcription factor binding site are shown in Table 2. One can see that the canonical {A, T, G, C} frequency matrix was found to be one of the best partial recognition procedures according to its accuracy. Since the canonical {A, T, G, C} frequency matrices are, indeed, commonly accepted, this result seems naturally expected. It follows that the other oligonucleotide frequency matrices have, indeed, missed some es-
sential information on the internal structure of the site in question. In the last line of Table 2, the mean recognition ScoreΡ averaging all these oligonucleotide frequency matrices Score0s [formula (4)] is described. Unexpectedly, this mean recognition was found to be better than the canonical frequency matrix by recognition accuracy. Moreover, Table 3 demonstrates that, for mean recognition approach, the ‘falsepositive’ error for a number of transcription factor binding sites is essentially less. By using independent data to check this effect, we have varied a recognition threshold and constructed the diagram showing the dependence between ‘false-positive’ and ‘false-
639
M.P.Ponomarenko et al.
negative’ errors (Figure 6). As a result, the decrease in ‘falsepositive’ errors for arbitrarily chosen ‘false-negative’ errors was observed for GATA-1 transcription factor binding site (Figure 6a). In Figure 6b, this result is independently confirmed for C/EBP transcription factor binding site. All the above is evidence for the fact that non-canonical oligonucleotide frequency matrices contain some novel information on the internal structure of the functional DNA sites, which was lost by applying only the canonical frequency matrix. This could be explained by the effect that several nucleotide combinations may occupy fixed site-specific positions. Besides, it seems probable that W/S-, R/Y- and K/Mbased oligonucleotide frequency matrices may reflect site specifically some thermodynamic, conformation and electrostatic details of site functioning. It should also be stated that the false-positive error rate is 1.4% on the control set shown in Table 2 for the NF-1 site mean recognition considered as an example. By testing 10 random 10 kbp DNA sequences, we have additionally observed that the total number of NF-1 transcription factor binding sites recognized for each randomly generated DNA equals a mean value of 127.1. One can see that this observed value (127.1) of the false-positive occurrence is consistent with the statistically expected estimation of the total number of ‘false positives’: 140 = 10 000 × 1.4/100. As shown in Table 3, false-positive errors within the range from 0.8% to 9.8% with mean and median values equaling 2.9% and 2.5%, respectively, were observed in this work. Hence, ∼250 false positives per 10 kbp of DNA should be expected. For
comparison, in the commonly accepted and earlier documented MatInspector (Quandt et al., 1995), the false positives occur in the range 7.5–156.5/10 kbp of DNA. For random 10 kbp inputted into the MatInspector’s URL = with the predefined threshold values, >2500 false sites were recognized by >140 matrices, i.e. the false positives were observed in the range from 1 to 136. Thus, the several percentages level of the false-positive error rate can be a realistic expectation for a fixed matrix-based ‘signal sensor’ applied individually. This false-positive error rate seems reasonable from the biological viewpoint because no natural transcription factor binding site can function independently from the others (Heinemeyer et al., 1999; Kolchanov et al., 1999). In the course of genomic DNA annotation, several signal sensors are often combined into the so-called ‘content sensors’ recognizing the enhancer and promoter regions by checking their regulatory potential peaks (Kondrakhin et al., 1995), by non-random clustering of the transcription factor binding sites recognized upstream/in-between very extended open reading frames (Wagner, 1997), by the fixed transcription factor binding site pairs with definite mutual location, composed elements (French et al., 1998; Zhang, 1998). According to transcription regulatory specificity, the MATRIX-like representation of the recognition rules, in welldocumented, Web-proved and directly embeddable into the user’s programs C-codes, are applicable for design of a number of promoter/enhancer recognition tools.
Table 2. Oligonucleotide frequency matrices of the NF-1 transcription factor binding site, available in the current release of the MATRIX database Alphabet Name
Pseudoletters
Size
N1 N2 N3x KM2 KM3 KM4 KM3x KM5x RY2 RY3 RY4 RY3x RY5x WS2 WS3 WS4 WS3x WS5x
A, T, G, C AA, AT, …, CC AxA, AxT, …, CxC MM, MK, KM, KK MMM, …, KKK MMMM, …, KKKK MxM, …, KxK MxMxM, …, KxKxK RR, RY, YR, YY RRR, …, YYY RRRR, …, YYYY RxR, …, YxY RxRxR, …, YxYxY WW, WS, SW, SS WWW, …, SSS WWWW, …, SSSS WxW, …, SxS WxWxW, …, SxSxS Mean Recognition
4 16 16 4 8 16 4 8 4 8 16 4 8 4 8 16 4 8
aThe
640
Control tests: Score mean ± SD (error)
50% subset size
results for the control 1000 random sequences.
Training
49
Control
50
SITE
RANDOMa
0.833 ± 0.531 (8.0%) 0.825 ± 0.614 (8.0%) 0.791 ± 0.488 (2.0%) 0.790 ± 0.634 (8.0%) 0.788 ± 0.613 (8.0%) 0.728 ± 0.631 (10.0%) 0.848 ± 0.569 (10.0%) 0.753 ± 0.618 (12.0%) 0.869 ± 0.688 (8.0%) 0.838 ± 0.846 (14.0%) 0.820 ± 0.729 (14.0%) 0.862 ± 0.781 (8.5%) 0.821 ± 0.751 (14.0%) 0.804 ± 0.641 (14.0%) 0.787 ± 0.590 (12.0%) 0.712 ± 0.670 (16.0%) 0.770 ± 0.566 (8.0%) 0.689 ± 0.645 (12.0%) 0.796 ± 0.526 (6.0%)
–1.061 ± 0.539 (2.8%) –1.074 ± 0.319 (1.0%) –0.941 ± 0.346 (12.5%) –1.085 ± 0.713 (7.2%) –0.978 ± 0.560 (6.6%) –0.973 ± 0.479 (5.9%) –1.085 ± 0.807 (9.5%) –1.100 ± 0.759 (8.5%) –0.866 ± 0.645 (9.6%) –1.260 ± 0.672 (5.4%) –0.872 ± 0.488 (6.5%) –1.134 ± 0.795 (3.4%) –0.931 ± 0.648 (9.1%) –0.971 ± 0.731 (9.6%) –0.809 ± 0.554 (8.0%) –0.911 ± 0.493 (6.3%) –0.860 ± 0.701 (11.5%) –0.938 ± 0.652 (9.3%) –0.991 ± 0.366 (1.4%)
Oligonucleotide frequency matrix
Table 3. Comparison between the canonical and mean frequency matrices of transcription factor binding sites available in the current release of the MATRIX database Factor
Canonical frequency: Score mean ± SD (error)
Mean frequency: Score mean ± SD (error)
name
SITEa
RANDOMb
SITEa
RANDOMb
NF-1 AP-1 ATF C/EBP C-fos C-myb COUP CP-1 CRE-BP1 CREB E2 ER GAL4 GATA-1 GR HNF1 MyoD NF-IL6 NF-κB OCT PR RAR RXR Sp-1 SRF T3R USF YY1
0.833 ± 0.531 (8.0%) 0.762 ± 0.384 (2.9%) 0.826 ± 0.258 (0.0%) 0.934 ± 0.467 (4.8%) 0.696 ± 0.208 (0.0%) 0.164 ± 0.380 (0.0%) 0.820 ± 0.443 (0.0%) 0.928 ± 0.210 (0.0%) 0.827 ± 0.305 (0.0%) 0.765 ± 0.284 (0.0%) 0.766 ± 0.426 (0.0%) 0.843 ± 0.281 (0.0%) 0.376 ± 0.670 (12.5%) 0.850 ± 0.332 (2.5%) 1.031 ± 0.453 (0.0%) 1.014 ± 0.520 (5.3%) 0.841 ± 0.249 (0.0%) 0.647 ± 0.353 (0.0%) 0.806 ± 0.372 (5.6%) 0.871 ± 0.677 (12.9%) 0.674 ± 0.298 (0.0%) 0.613 ± 0.346 (0.0%) 0.775 ± 0.397 (0.0%) 1.075 ± 0.320 (1.2%) 0.819 ± 0.425 (6.7%) 0.920 ± 0.277 (0.0%) 0.916 ± 0.524 (0.0%) 0.841 ± 0.412 (0.0%)
–1.061 ± 0.539 (2.8%) –0.853 ± 0.462 (5.3%) –1.121 ± 0.496 (3.5%) –0.989 ± 0.558 (5.1%) –1.064 ± 0.548 (6.7%) –1.332 ± 0.624 (11.6%) –1.021 ± 0.423 (2.0%) –1.151 ± 0.529 (2.9%) –0.773 ± 0.404 (3.2%) –0.961 ± 0.452 (4.1%) –0.967 ± 0.417 (2.9%) –0.911 ± 0.441 (2.6%) –1.273 ± 0.596 (9.9%) –1.069 ± 0.523 (4.3%) –0.937 ± 0.565 (4.9%) –0.958 ± 0.443 (1.9%) –0.924 ± 0.434 (3.2%) –1.056 ± 0.493(4.9%) –1.096 ± 0.442 (2.3%) –1.153 ± 0.500 (3.6%) –0.966 ± 0.453 (3.8%) –0.823 ± 0.417 (6.2%) –1.154 ± 0.515 (4.7%) –1.026 ± 0.486 (1.5%) –0.847 ± 0.411 (2.2%) –0.735 ± 0.437 (3.3%) –1.139 ± 0.527 (3.9%) –1.044 ± 0.514 (3.8%)
0.796 ± 0.526 (6.0%) 0.716 ± 0.464 (2.9 %) 0.823 ± 0.231 (0.0%) 0.901 ± 0.492 (4.8%) 0.713 ± 0.185 (0.0%) 0.320 ± 0.317 (0.0%) 0.802 ± 0.450 (0.0%) 0.936 ± 0.210 (0.0%) 0.765 ± 0.333 (0.0%) 0.770 ± 0.294 (0.0%) 0.760 ± 0.441 (0.0%) 0.806 ± 0.295 (0.0%) 0.395 ± 0.580 (12.5%) 0.842 ± 0.389 (2.5%) 1.066 ± 0.511 (0.0%) 1.020 ± 0.588 (5.3%) 0.855 ± 0.226 (0.0%) 0.614 ± 0.393 (0.0%) 0.817 ± 0.367 (5.6%) 0.953 ± 0.707 (12.9%) 0.684 ± 0.310 (0.0%) 0.681 ± 0.374 (0.0%) 0.801 ± 0.407 (0.0%) 1.067 ± 0.397 (1.2%) 0.824 ± 0.468 (6.7%) 0.884 ± 0.291 (0.0%) 0.919 ± 0.509 (0.0%) 0.855 ± 0.446 (0.0%)
–0.991 ± 0.366 (1.4%) –0.961 ± 0.380 (3.3%) –0.885 ± 0.371 (2.4%) –0.989 ± 0.427 (2.5%) –0.926 ± 0.442 (5.2%) –0.936 ± 0.462 (9.8%) –1.139 ± 0.398 (1.2%) –1.033 ± 0.435 (2.5%) –0.956 ± 0.374 (2.3%) –0.974 ± 0.395 (3.1%) –0.969 ± 0.370 (2.4%) –1.097 ± 0.410 (1.7%) –0.928 ± 0.437 (8.0%) –1.005 ± 0.408 (2.6 %) –0.885 ± 0.451 (2.7%) –0.997 ± 0.401 (1.0%) –0.875 ± 0.365 (2.1%) –0.988 ± 0.439 (4.1%) –0.914 ± 0.357 (1.8%) –1.036 ± 0.374 (1.4%) –1.027 ± 0.402 (2.5%) –0.772 ± 0.371 (4.2%) –1.032 ± 0.425 (3.2%) –0.968 ± 0.318 (0.8%) –0.874 ± 0.375 (1.9%) –0.789 ± 0.395 (2.6%) –0.924 ± 0.410 (2.5%) –0.955 ± 0.425 (3.2%)
aThe bThe
control 50% subset. control 1000 random sequences.
Discussion and conclusion At present, it is common knowledge that only ‘a variety of computational tools can help to isolate the “signals" from the noise’ in the process of human genome annotation (Haussler, 1998). So, for successful genome annotation, it is necessary to recognize hundreds of various signals, each possibly using dozens of ‘signal sensors’ (consensus, weight matrices, neural nets, hidden Markov models, etc.). This means that DNA annotator should interactively manipulate by different computational tools recognizing the signals in accordance with the sequence considered. Obviously, nobody can ‘embed in memory’ even the most necessary information about such a huge variety of computational tools addressed to isolate the ‘signals’ from the ‘noise’ (availability of these tools, their thresholds, accuracy estimates, training and control data, limitations for usage, mathematical criterion optimized, etc.). From our viewpoint, there are two additional requirements for computational tools recognizing the signals: they should be (i)
well documented and (ii) navigable. In this work, we have tried to demonstrate how these two additional requirements can be satisfied by using the SRS-formatted MATRIX database, the current version of which accumulates 483 oligonucleotide frequency matrices recognizing 42 transcription factor binding sites. At present, such databases accumulating signal sensors in terms of ‘weight matrices’ form a novel field of intense research. Among the better known are the following databases: TRANSFAC (Heinemeyer et al., 1999) with MatInspector (Quandt et al., 1995), PromFD (Chen et al., 1997), RegulonDB (Salgado et al., 1999), DPInteract (Robison et al., 1998) and EpoDB with TESS (Stoeckert et al., 1999). For prokaryotic and eukaryotic transcription factor binding sites, these databases are generally compiling the nucleotide occurrence matrices which are used by computational tools recognizing these sites. For example, MatInspector (Quandt et al., 1995) uses the TRANSFAC-based occurrence matrices to recognize the
641
M.P.Ponomarenko et al.
Fig. 6. The comparison between the mean recognition (‘Mean’) and the canonical frequency matrix recognition (‘Traditional’) in terms of relationships between their ‘false-negative’ α1 and ‘false-positive’ α2 errors: (a) the GATA-1 and (b) C/EBP transcription factor binding sites.
eukaryotic transcription factor binding sites by using the Matrix Similarity (Quandt et al., 1995). Generally, a fixed occurrence matrix can be applied by the different tools optimized by different scoring criteria, namely, Homology Score (Mulligan et al., 1984), Information Content (Schneider et al., 1986), Discrimination Energy (Berg and von Hippel, 1987), Parameterized Logarithmic Scales (Bucher, 1990) and Matrix Similarity (Quandt et al., 1995). Recent evaluation of computer tools for transcription factor binding site recognition within genomic DNA (Roulet et al., 1998) indicated that several mathematically different tools may, however, correlate better with each other than with relevant DNA–protein affinity magnitudes independently identified. Thus, separating the nucleotide occurrence matrices from the tools applying them may provide difficulties both for the application of these tools and for interpreting the results of site recognition. To simplify this complicated situation, we devote the first release of the MATRIX database to generalize the Homology Score formalism (Mulligan et al., 1984) to usage of the oligonucleotide frequency matrix. In this work, Homology Score was normalized by formulae (1–3), {Mean(ScoreSITE) = +1; Mean(ScoreRAND) = –1; Threshold(Score) = 0}. Our decision was reasoned by the following two facts: first, Homology Score is the very first recognition score (Mulligan et al., 1984), and second, Homology Score correlates to RNA polymerase selectivity magnitudes (Mulligan et al., 1984). Because of these reasons, the first release of the MATRIX database is the earliest and simplest approximation among all the possible matrix recognition Scores. In turn, we plan to devote the subsequent releases of the MATRIX database to a variety of logarithmic approximations (Schneider et al., 1986; Berg and von Hippel, 1987; Bucher, 1990; Quandt et al., 1995) that appeared later and were better reasoned probabilistically. Strictly following the common rule of database ‘impartiality’, we plan to accumulate different variants of
642
recognition Score approximations without preference. This provides the user with the possibility to select by himself an approximation that will most suit a particular biological problem. For example, the user recognizing basal promoters prefers the matrix with the lowest ‘false-positive’ error; herewith, another dealing with composed elements prefers the matrix with the lowest ‘false negatives’. If a matrix fits both ‘false positives and negatives’ criteria, a user can select this matrix; otherwise it should be possible to select two matrices according to the user’s criteria, this being the so-called ‘impartiality’ principle. In the current version of the MATRIX database, we simulated this impartiality principle by the variety of oligonucleotide frequency matrices. This is the novelty. The second novelty of the present paper is that we have tried to simulate how ‘a variety of computational tools can help to isolate the signals from the noise’ (Haussler, 1998). For this purpose, we have applied the simplest procedure of the simultaneous usage of all the tools recognizing a fixed functional site documented within the MATRIX database. This simplest procedure is the arithmetical averaging of the site recognition Scores within the common normalized scale, formula (4). This averaging has no additionally optimized parameters and, hence, no additional contribution of the training data noise to the accuracy of several recognitions applied simultaneously, which is very important according to the recent evaluation of the tools recognizing the transcription factor binding sites within genomic DNA (Roulet et al., 1998). Although no theory guarantees that the recognition Score averaged arithmetically can increase the discrimination between the signal and noise, this increase was surprisingly observed in silico on a large variety of transcription factor binding sites, as well as being heuristically expected in the tutorial (Haussler, 1998). This is, indeed, the novelty too. As the problem of decreasing the ‘false-positive’ error remains pivotal to progress in genomic DNA annotation (Fickett and Hatzigeorgiou, 1997; Haussler, 1998), the mean
Oligonucleotide frequency matrix
recognition abilities and limitations could serve as a separate detailed investigation. In this respect, we try to compile a large number of oligonucleotide frequency matrices, having different variants of recognition scores for the sites and possibly differing functionally, within the next issue of the MATRIX database. This will be the starting point for detailed analysis and identification of both abilities and limitations of the mean recognition approach. The results obtained and discussed permit us to conclude that the MATRIX database includes a number of well-documented and navigable recognition programs applicable directly by the user to analyze DNA sequences of interest. In addition, C-programs contained in the database could be directly used to construct the user’s software. Information on the oligonucleotide frequencies stored in the database may be useful for studying an internal structure of functional sites.
Acknowledgements The work was supported by the Russian Foundation for Basic Research, the Russian Human Genome Program, Russian State Committee on Science and Technology, Integrated Program of Siberian Department of Russian Academy of Sciences and grant NIH 5-R01-RR04026-08. The authors are grateful to Dr G.Orlova for assistance in translation from Russian into English.
References Berg,O.G. and von Hippel,P.H. (1987) Selection of DNA binding sites by regulatory proteins. Statistical-mechanical theory and application to operators and promoters. J. Mol. Biol., 193, 723–750. Bucher,P. (1990) Weight matrix descriptions of four eukaryotic RNA polymerase II promoter elements derived from 502 unrelated promoter sequences. J. Mol. Biol., 212, 563–578. Chen,Q.K., Hertz,G.Z. and Stormo,G.D. (1997) PromFD 1.0: a computer program that predicts eukaryotic pol II promoters using strings and IMD matrices. Comput. Appl. Biosci., 13, 29–35. Etzold,T. and Argos,P (1993) SRS—an indexing and retrieval tool for flat file data libraries. Comput. Appl. Biosci., 9, 49–57. Fickett,J.W. and Hatzigeorgiou,A.G. (1997) Eukaryotic promoter recognition. Genome Res., 7, 861–878. Fishburn,P.C. (1970) Utility Theory for Decision Making. New York, John Wiley & Sons. French,K., Quandt,K. and Werner,T. (1998) Muscle actin genes: a first step towards computational classification of tissue specific promoters. In Silico Biol., 1, 29–38. Gelfand,M. (1995) Prediction of function in DNA sequence analysis. J. Comput. Biol., 2, 87–115. Haussler,D. (1998) Computational genefinding. Trends Guide Bioinf., 1, 12–15.
Heinemeyer,T. et al. (1999) Expanding the TRANSFAC database towards an expert system of regulatory molecular mechanisms. Nucleic Acids Res., 27, 318–322. Karlin,S. and Brendel,V. (1992) Chance and statistical significance in protein and DNA sequence analysis. Science, 257, 39–49. Kel,A.E., Ponomarenko,M.P., Likhachev,E.A., Orlov,Y.L., Ischenko,I.V., Milanesi,L. and Kolchanov,N.A. (1993) SITEVIDEO: a computer system for functional site analysis and recognition. Investigation of the human splice sites. Comput. Appl. Biosci., 9, 617–627. Kolchanov,N.A. et al. (1999) Transcription Regulatory Regions Database (TRRD): its status in 1999. Nucleic Acids Res., 27, 303–306. Kondrakhin,Y.V., Shamin,V.V. and Kolchanov,N.A. (1994) Construction of a generalized consensus matrix for recognition of vertebrate pre-mRNA 3′-terminal processing sites. Comput. Appl. Biosci., 10, 597–603. Kondrakhin,Y.V., Kel,A.E., Kolchanov,N.A., Romashchenko,A.G. and Milanesi,L. (1995) Eukaryotic promoter recognition by binding sites for transcription factors. Comput. Appl. Biosci., 11, 477–488. Lawrence,C. (1994) Toward the unification of sequence and structural data for identification of structural and functional constraints. Comput. Chem., 18, 255–258. Mulligan,M.E., Hawley,D.K., Entriken,R. and McClure,W.R. (1984) Escherichia coli promoter sequences predict in vitro RNA polymerase selectivity. Nucleic Acids Res., 12, 789–800. Ponomarenko,M.P., Kolchanova,A.N. and Kolchanov,N.A. (1997) Generating programs for predicting the activity of functional sites. J. Comput. Biol., 4, 83–90. Quandt,K., Frech,K., Karas,H., Wingender,E. and Werner,T. (1995) MatInd and MatInspector—New fast and sensitive tools for detection of consensus matches in nucleotide sequence data. Nucleic Acids Res., 23, 4878–4884. Robison,K., McGuire,A.M. and Church,G.M. (1998) A comprehensive library of DNA-binding site matrices for 55 proteins applied to the complete Escherichia coli K-12 genome. J. Mol. Biol., 284, 241–254. Roulet,E., Fisch,I., Bucher,P. and Mermod,N. (1998) Evaluation of computer tools for prediction of transcription factor binding sites on genomic DNA. In Silico Biol., 1, 21–28. Salgado,H., Santos,A., Garza-Ramos,U., van Helden,J., Diaz,E. and Collado-Vides,J. (1999) RegulonDB (version 2.0): a database on transcriptional regulation in Escherichia coli. Nucleic Acids Res., 27, 59–60. Schneider,T.D., Stormo,G.D., Gold,L. and Ehrenfeucht,A. (1986) Information content of binding sites on nucleotide sequences. J. Mol. Biol., 188, 415–431. Stoeckert,C.J.,Jr, Salas,F., Brunk,B. and Overton,G.C. (1999) EpoDB: a prototype database for the analysis of genes expressed during vertebrate erythropoiesis. Nucleic Acids Res., 27, 200–203. Wagner,A. (1997) A computational genomics approach to the identification of gene networks. Nucleic Acids Res., 25, 3594–3604. Uberbacher,E.C., Xu,Y. and Mural,R.J. (1996) Discovering and understanding genes in human DNA sequence using GRAIL. Methods Enzymol., 266, 259–281. Zadeh,L.A. (1965) Fuzzi sets. Inf. Control, 8, 338–353. Zhang,M. (1998) A discrimination study of human core-promoters. Pac. Symp. Biocomput., 240–251.
643