OMCAT: Optimal Maintenance of Continuous Queries’ Answers for Trajectories Hui Ding, Goce Trajcevski∗, Peter Scheuermann† Department of EECS Northwestern University Evanston, IL 60208 hdi117,goce,
[email protected] Time
ABSTRACT
te
We present our prototype system, OMCAT, which optimizes the reevaluation of a set of pending continuous spatio-temporal queries on trajectory data, when some of the trajectories are affected by traffic abnormalities reported. The key observation that motivates OMCAT is that an abnormality in a given geographical region may cause changes to the answers of queries pertaining to future portions of affected trajectories. We investigate the sources of contextswitching costs at various levels and propose solutions that utilize the correlation of several context dimensions to orchestrate the reevaluation of the queries. OMCAT, fully implemented on top of an existing Object Relational Database Management System – Oracle 9i, demonstrates that our techniques can substantially reduce the response time during query answer update.
NN-Q
Tr3’ RQ1
Tr2’ te
Tr1’ RQ2
tb
tb
RQ3
t2 TAR
t1
Tr5 Tr4 Tr1
Tr2
Tr3 Y
t = t0 Traffic Abnormality
X
Categories and Subject Descriptors H.2.4 [Database Management]: Systems—query processing
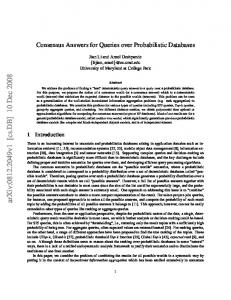
Figure 1: Trajectories, Queries and Traffic Abnormalities
Keywords The algorithms used to maintain the correctness of the answers to the continuous queries are tightly associated with the model adopted for representing the motion of the objects in a given MOD. Three models that are often used in existing works are: 1. A sequence of (location,time) updates are periodically transmitted to the MOD by the moving objects [5]. Under this model, the continuous queries have to be reevaluated rather frequently; as a consequence, their answer updates will have to be sent to the users, incurring a huge processing/communication overhead. 2. A sequence of (location,time, velocity) updates are reported only when an object deviates more than a predefined threshold from its planed location, or when the velocity vector changes [7]. This model implies less frequent reevaluation of the continuous queries than the first one. However, since updates of the moving objects may pertain to longer time intervals, the correlation between the objects’ whereabouts and the properties of the efficient algorithms that manage the continuous queries is different [4]. 3. A trajectory, which is a sequence of three dimensional points (2D geography + time) like (x1 , y1 ,t1 ), (x2 , y2 ,t2 ) . . . (xn , yn ,tn ) [8], represents vertices of a polyline. Between two vertices, an object is assumed to move along a straight line with constant speed, as illustrated in Figure 1. Using electronic maps augmented with the information about the distribution of the traffic patterns along the
Moving Objects Databases, Continuous Queries, Triggers
1. INTRODUCTION Moving Objects Databases (MOD) [3] is an essential component of any system enabling Location Based Services (LBS) [6], in which the management of the transient (location,time) information for a large amount of moving objects is paramount. One of the important properties of this problem domain is that the majority of the queries of interest to the users are continuous [7], i.e., they pertain to future time intervals and their answers may have to be frequently reevaluated due to the dynamics of the entities involved. ∗ Research supported by the Northrop Grumman Corp. grant PO 8200082518 † Research partially supported by NSF grant IIS-0325144
Permission to make digital or hard copies of all or part of this work for personal or classroom use is granted without fee provided that copies are not made or distributed for profit or commercial advantage and that copies bear this notice and the full citation on the first page. To copy otherwise, to republish, to post on servers or to redistribute to lists, requires prior specific permission and/or a fee. SIGMOD 2006, June 27–29, 2006, Chicago, Illinois, USA. Copyright 2006 ACM 1-59593-256-9/06/0006 ...$5.00.
748
Traffic Abnormality
road segments, a trajectory between a given origin and destination can be constructed using a time-dependent extension of the Dijkstra’s algorithm [8]. An advantage of this model is that the MOD has full knowledge of the more distant future. However, it comes at a price when certain abnormalities occur. Namely, one of the key parameters used in constructing the trajectories is the traffic pattern distribution along the road segments. However, when a given traffic abnormality, e.g., a road work or an accident, changes the traffic patterns of some road segments used in trajectories’ construction, it may also affect the future portions of all the trajectories that are along the impacted segment(s) throughout the duration of that abnormality by a certain percentage of slowdown. Since the future portions of the affected trajectories may have been part of the answers to various pending continuous queries, these queries will have to be reevaluated, once the trajectories are updated. OMCAT investigates the problem of query maintenance upon such traffic abnormality under the settings of the trajectory model. The main aspects of the problems addressed in our system are illustrated in Figure 1. It shows a scenario in which there are five trajectories Tr1, . . . , Tr5 in solid polylines, and the system needs to manage three range queries RQ1, RQ2 and RQ3, and one nearestneighbor query NN − Q which is interested in the moving object trajectory that is closest to Tr4 (in thick polyline) between tb and te . Assuming that all the queries were posted before the time t1 , when a traffic abnormality occurs at t1 in a given region denoted as TAR and persists until t2 , it will affect all the trajectories passing through TAR between t1 and t2 . The effect of the abnormality on the trajectories is that portions of the trajectories inside TAR will be slowed down and the future portions of these trajectories will be shifted down in time accordingly. These effects are depicted with the dashed line segments in each of the affected trajectories, illustrating their new shapes. Apparently, these modification will affect the answers of the pending continuous queries. For example: • Tr1 was originally part of the answer of RQ3, but the modified trajectory Tr10 is no longer part of it. However, it becomes part of the answer to RQ2, which was not the case before the abnormality; • Although Tr4, the nearest neighbor query, was not affected by the abnormality, its answer has changed. Namely, due to the slow down effect, Tr30 is no longer the closest trajectory to Tr4 between tb and te but Tr20 becomes the new answer to the query. Observe that the original Tr2 was part of the answer to RQ2, which is no longer the case after the traffic abnormality.
Answers and Answer Updates
Post Query
User Interface
Context Parser and Extraction
Moving Object Table Traj ID
...
Traj. Shape
...
...
...
Pending Query
...
SDO_GEOMETRY type
Triggers Index Engine Query Operators
Geometry Engine
Query Table Query ID
Query Database Current ... Region Answer
Linear Referencing System
Traffic Abnormality Table Zone ID
Dist. Database Time ... Duration Zone
Database Query Optimizer
Stored Procedures
Cache Table Main Memory
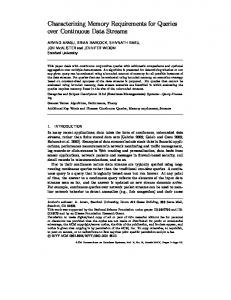
Figure 2: OMCAT Architecture
- k Nearest Neighbor Query (kNN); - Within Distance Query (spatio-temporal join [5]); Once a particular query is submitted to the system, it is evaluated and its initial answer is sent to the user. However, along with that, a trigger is automatically set up to monitor the modifications of the trajectories due to abnormalities and appropriately react to them, in order to ensure that the answer to the query is consistent with the actual state of the real world. Our approach is reducing the context-switching cost during query reevaluation. We note that context-aware issues arise at all levels of query processing: at the operating system process level, due to the needs to execute multiple triggers in order to complete the reevaluation; during the reevaluation of a single query, where unnecessary database table accesses and computation can be avoided by utilizing the spatial and temporal correlation among the pending queries and the MOD content; and among the reevaluation of a group of mixed types of queries, where different stored procedure code modules may need to be invoked to process reevaluation requests. Our contributions can be summarized as follows: • We investigated the impact of the values of various semantic dimensions of individual triggers on the penalties of context-switching; • We utilized the spatial-temporal correlation between the queries and the (updated) trajectories in order to limit the search space and to generate an ordering among the triggers’ execution; • We presented a unified algorithm for efficient reevaluation of a group of mixed type of pending queries, which further reduces the volume of computation by combining the sweep-plain approach with the grid-based spatial join approach. In addition, OMCAT is the first work that formally presents a complete set of algorithms for the (evaluation and) reevaluation of three common types of queries on the trajectories of moving objects to the best of the authors knowledge.
2. OMCAT ARCHITECTURE The main goal of OMCAT is to optimize the response time needed for reevaluating the answers to a given set of pending continuous queries, once an abnormality of a particular type has been reported to the MOD. Clearly, bringing the answers of the continuous queries up-to-date is preceded by the work needed to detect and properly update the trajectories affected by the given abnormality. Figure 2 shows the architecture of OMCAT. The user interacts with the system via an interface that is implemented using Oracle MapViewer’s API [2]. It allows the user to submit continuous queries of three different types:
3.
DEMO SPECIFICATIONS
Throughout the demonstration, users will be able to test the system on a set of 5000 trajectories generated based on the electronic
- Range Query;
749
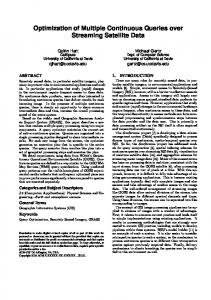
Figure 3: OMCAT User Interface Screenshot date answers to the pending queries using our optimization methods or the naive approach. This allows the users to have a “hands-on” experience of the advantages offered by our approach.
maps of Chicago, extending the set of 1000 used in the DOMINO project [8]. Figure 3 illustrates the GUI of OMCAT, for the settings in which there is one range query, one nearest neighbor query and one withindistance query. The region for the range query is visually represented by a purple rectangle in the upper left portion. The thicker purple routes depict the querying trajectories for the nearest neighbor query (upper route) and within distance (lower route) queries, respectively. The right portion of the interface provides the fields where the users enter the rest of the parameters for a particular query, e.g., begin time and end time values. Finally, the red circle indicates the area of the disturbance/traffic abnormality. Again, its temporal parameters and its slow down effect on the affected objects are entered using separate textboxes. More detailed presentation of the features is available at the author’s web page [1]. The demonstration of OMCAT consists of four basic stages: 1. Specification of continuous queries: User can request the system to process and monitor several queries. He can select the type of the query (range, kNN, join) and is prompted to enter the parameters of the query, such as begin time, end time, etc. The user has the option to use the GUI in order to draw the geographical regions of interest (range query) or select the querying trajectory (kNN and join). 2. Answer Generation: Upon completion of the specifications, the system calculates the answers to the queries and presents them to the user. 3. Specification of the abnormality: Using the GUI, the user can select an area in which an abnormality has occurred. Subsequently, the user is prompted to enter the parameters of the abnormality such as begin time, end time, duration and the slow down effect, in terms of the percentage of the value of the actual traffic patterns along each segment in the affected region. 4. Update Answer Generation: As shown in Figure 3, the user has an option to choose whether he would like to generate the up-to-
4.
REFERENCES
[1] OMCAT project homepage. http://www.eecs.northwestern.edu/˜hdi117/omcat.htm. [2] Oracle 9i. http://www.oracle.com/technology/products/oracle9i. [3] Ralf Hartmut G¨uting and Markus Schneider. Moving Object Databases. Morgan Kaufmann Publishers, CA, 2005. [4] Glenn S. Iwerks, Hanan Samet, and Ken Smith. Continuous k-nearest neighbor queries for continuously moving points with updates. In VLDB, pages 512–523, 2003. [5] Mohamed F. Mokbel, Xiaopeng Xiong, and Walid G. Aref. SINA: Scalable incremental processing of continuous queries in spatio-temporal databases. In SIGMOD Conference, pages 623–634, 2004. [6] Jochen Schiller and Agn`es Voisard. Location-Based Services. Morgan Kaufmann Publishers, CA, 2004. [7] A. Prasad Sistla, Ouri Wolfson, Sam Chamberlain, and Son Dao. Modeling and querying moving objects. In ICDE, pages 422–432, 1997. [8] Ouri Wolfson, Hu Cao, Hai Lin, Goce Trajcevski, Fengli Zhang, and Naphtali Rishe. Management of dynamic location information in domino. In EDBT, pages 769–771, 2002.
750