On building maps of web pages with a cellular automata H. Azzag1 , D. Ratsimba3 , D. Da Costa1 , C. Guinot1,2 , and G. Venturini1 1
3
Laboratoire d’Informatique de l’Universit´e de Tours, ´ Ecole Polytechnique de l’Universit´e de Tours - D´epartement Informatique 64, Avenue Jean Portalis, 37200 Tours, France. Phone: +33 2 47 36 14 14, Fax: +33 2 47 36 14 22 {hanene.azzag,venturini}@univ-tours.fr
[email protected] 2 C.E.R.I.E.S., 20 rue Victor Noir, 92521 Neuilly sur Seine Cedex.
[email protected] Laboratoire ERIC, Universit´e de Lyon2, Bat. L, 5 avenue Pierre Mend´es-France 69676 Bron Cedex
[email protected] Abstract. We present in this paper a clustering algorithm which is based on a cellular automata and which aims at displaying a map of web pages. We describe the main principles of methods that build such maps, and the main principles of cellular automata. We show how these principles can be applied to the problem of web pages clustering: the cells, which are organized in a 2D grid, can be either empty or may contain a page. The local transition function of cells favors the creation of groups of similar states (web pages) in neighbouring cells. We then present the visual results obtained with our method on standard data as well as on sets of documents. These documents are thus organized into a visual map which eases the browsing of these pages.
1 Introduction The aim of web pages visualization is to present in a very informative and interactive way a set of web documents to the user in order to let him or her navigate through these documents. In the web context, this may correspond to several user’s tasks: displaying the results of a search engine, or visualizing a graph of pages such as a hypertext or a surf map. In addition to web pages visualization, web pages clustering also greatly improves the amount of information presented to the user by highlighting the similarities between the documents [18]. These similarities take into account the content of the pages. Several systems have been designed with the double aim of creating groups among web pages and of visualizing such groups. If one considers the visual models of topic maps [11][17], and compared to graph displaying models such as (Kartoo, Mapstan, TouchGraph, GoogleBrowser) and to other plot based
2
H. Azzag, D. Ratsimba, D. Da Costa, C. Guinot, and G. Venturini
visualization [4], then the advantages of topic maps are the following : they may represent an important number of documents and of created clusters, they may provide a global view which can be easily zoomed, and most importantly, they use a cartographic metaphor which manipulation is easily learned by the user. We consider in this work a set of n web pages that we would like to represent as a topic map in order to let the user browse these pages. This problem can be instantiated in several ways: the automatic construction of a hypertext, the visual presentation of search engines results, the automatic creation of web sites maps. The map must represent these pages in such a way that thematic clusters will clearly appear. To build such a map, one must be able to measure the similarity between pages, to detect groups among the pages, to visualize such groups and the neighbourhood relationships between the pages (similar pages must be displayed together on the map). By reaching this goal, one overcomes the traditional limitations of text-based interfaces: in the case of search engines, a greater number of results can be explored. In the case of hypertext construction, the discovered neighbourhood relationships will naturally act as hyperlinks. In the remaining of this paper, section 2 describes the main principles of the methods that visually cluster web pages, as well as the main properties of cellular automata. Section 3 present our algorithm, a new method for visual clustering with cellular automata. In section 4, we present the results obtained by our method on benchmark data and on web pages. We conclude by presenting the limits of our method as well as the perspectives which can be derived from this work.
2 Principle of documents maps and cellular automata 2.1 Documents visual clustering and maps In order to solve the problem at hand, we must study the methods that cluster documents into a visual map [11][17]. Kohonen maps are one of the most well known examples [15][3]. Other similar methods have been recently applied to the generation of documents maps: it is the case for instance of a biomimetic approach which uses artificial ants to sort objects (i.e. documents) on a 2D grid [9]. The main characteristics of these visual representations are the following: the map is built from the set of documents by calling a clustering algorithm which results can be directly visualized. These results are organized in a 2D plan. Documents which are close to each others on the plan should be similar from their content point of view (thus a correlation should appear between the location of the documents on the grid, and their textual similarity). Documents represented on the map can be annotated with text labels in order to let the user better understand the clusters which have been found. These labels can be the title of documents, or keywords extracted from the documents, and also
On building maps of web pages with a cellular automata
3
colours which indicate the density of documents in a given area of the map. In conclusion, these maps must achieve the following properties: to create groups of documents (with informative neighbourhood relationships that is representative of the textual similarity between documents), to inform the user on the size of groups, the thematic content of a group (by displaying for instance common keywords in documents that belong to this group), to zoom and provide additional details about a document (title, opening of the document). 2.2 Principles of cellular automata and application in visual clustering Among all the methods related to clustering [10], researchers have developped models which are inspired by biological systems. As far as we know, no clustering algorithm making use of cellular automata has been defined yet. However, the cellular automata model is known since many years and has many interesting properties such as those which can be found in the popular game of life [6]: the emergence of complex behaviours that result from local and simple interactions. We show in the following that this model, which has been used in numerous domains [5], can make valuable contributions to the visual clustering problem and to the building of web pages maps. We remind here the reader with basic principles used in cellular automata (CA). A CA is defined by a 4-uple denoted by (C, S, V, δ). C = {c1 , , cN Cell } represents the set of cells where N Cell remains constant over time. S = {s1 , , sk } is the finite set of states that each cell will be able to take. The state of a cell ci is denoted by ci (t). V denotes the neighbourhood between cells which gives a spatial structure to the cells. For each cell ci , we denote by V (ci ) its set of neighbouring cells. In this work, we are interested in a 2D structuration of the cells which are thus placed on a N × N matrix or grid (as a consequence the number of cells is N Cell = N 2 ). The neighbourhood of a given cell is a square with an edge of size v and which is centered on the cell. This neighbourhood is such that the grid is toroidal (top connected to bottom, left side connected to right side). The neighbourhood of a cell is thus a set of v 2 cells. The local transition function denoted by δ determines the next state of a given cell as a function of its neighbouring cells. Finally, we call configuration of the CA at time t the state vector CA(t) = (c1 (t), ..., cN Cell (t)). A CA evolves from CA(t) to CA(t + 1) by applying δ to each cell, either in a synchronous way (parallel mode) or in an asynchronous way (parallel or sequential mode). The main principle of our method is to consider that the states of the CA can be the documents themselves. Then the next step is to adapt the local transition function in such a way that states representing similar documents appear in close location on the grid. Once a stable configuration has been obtained in which similar documents become located close to each other, it is straightforward to create a map from this grid, and we will show in section 4.3 that these results check the desired properties mentioned in the previous section.
4
H. Azzag, D. Ratsimba, D. Da Costa, C. Guinot, and G. Venturini
3 A CA model for documents visual clustering In the following, the n documents (or data) to be clustered are denoted by d1 , ..., dn and Sim(i, j) ∈ [0, 1] denotes the similarity between two documents di and dj . We have considered a 2D CA where the N Cell cells are structured on a squared grid. The set of possible cells states is equal to S = {empty, d1 , ..., dn }. In other words, each cell will be either empty or may contain one (and only one) document or data. At each simulation step, the states of cells will be possibly modified according to local transition rules which will aim at letting similar states (documents) appear at close locations on the grid. The size of the grid has been√empirically determined as in [12] and is computed with the function N = E( 3n) + 1. This size is supposed to give enough space (N 2 cells but n data only) to the spatial organization of the clusters. The size of the neighbourhood described in the previous section is the edge v of the square centered on each cell and is empirically determined by the following formula: v = E(N/10) + 1. We use the following definition in our algorithm: a cell is isolated if its immediate (v = 1) neighbourhood contains less than 3 non empty cells. We have decided to obtain non overlapping clusters: thus a state di may appear in one cell at a time. Therefore, we use a list of states denoted by L which represents the list of documents which do not appear on the grid and that remain to be placed. Initially, L contains all the documents and the states of cells are all empty. The local rules for evolving the states of cells are the following, firstly for an empty cell Cij : – R1 : If Cij is isolated Then (with probability 1 − P ′ = 0.25) Cij (t + 1) ← dk , where dk is a randomly selected document of L (and provided that Simd′k ∈V (cij ) (dk , d′k ) > T hreshold(t)) – R2 : If Cij is not isolated Then Cij (t + 1) ← dk , where dk is either a randomly selected document of L (with probability P = 0.032), or (with probability 1 − P ) the document of L which is the most similar to the document represented by Cij neighborhood, (and provided that, in both cases, Simd′k ∈V (cij ) (dk , d′k ) > T hreshold(t)). For a cell Cij that contains a document dk (i.e. Cij (t) = dk ), the transition rules are the following: – R3 : If Cij is isolated, Then Cij (t + 1) ← empty with a probability P ′ = 0.75 (dk is placed back in L). – R4 : Else if Simd′k ∈V (cij ) (dk , d′k ) < T hreshold(t), Then Cij(t + 1) ← empty and dk placed back in L In all other cases, the cell state remains unchanged (Cij (t + 1) ← Cij (t)). One can notice that the values of P and P ′ thresholds have been obtained experimentally.
On building maps of web pages with a cellular automata
5
In order to apply these rules to cells and in order to avoid conflicts when assigning on the grid the data of L, we have considered that one cell will evolve at a time (sequential evolution of the CA). We have tested several ways of selecting the cell to which the rules are applied at the current time step: we have kept a randomly selected order, once for each run of the algorithm (a permutation of the N 2 cells is randomly generated at the beginning of the algorithm). In the rules, we mention a threshold T hreshold(t) which evolves over the simulation steps t. This threshold is initialized to the maximum similarity value observed in the data set, and then slowly decreases through the run. Initially, the documents located close to each others on the grid are thus very similar to each others, thus forming highly similar ”seeds” for the future clusters. At each time step, T hreshold(t) is decreased of a constant quantity (equal to 1/200 of the standard deviation observed in the similarity values). This decreasing is also such that the algorithm converges because documents will be very unlikely to be removed from the grid once T hreshold(t) becomes low.
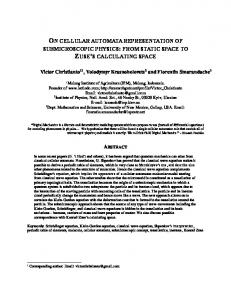
4 Results 4.1 Standard data In order to validate the clustering abilities of our algorithm, we have applied it first on standard benchmark databases from the Machine Learning Repository [2]. The similarity measure that we have used is based on an Euclidean distance. We have used the same set of parameters for all tested databases. Our first experiments have consisted in performing numerous tests in order to determine an average and satisfying set of parameters. We have run our algorithm on the 13 mentioned databases. Each parameters set has been tested over 20 runs. More than 1500 parameters sets have been tested. The obtained conclusions are the detection of correlations between parameters and the obtaining of a satisfying set of parameters with a low error rate (Rand measure), a high purity and a good number of found clusters (close to the real number of clusters). The visual results presented in figure 1 illustrate the clusters found for some databases (see table 1 for the complete results). One must notice that the layout of the clusters corresponds to known properties of the databases, like for instance in the cases of the Iris and Wine. The execution times were measured on a PC AMD Athlon64 792MHz with 500Mo of RAM, and an implementation in a Java Applet (the execution is therefore slower than in a C implementation for instance). A quantitative analysis of the results is presented in table 1. The performances of our CA are quite correct compared to the ascending hierarchical clustering (AHC) which is a widely used clustering algorithm.
6
H. Azzag, D. Ratsimba, D. Da Costa, C. Guinot, and G. Venturini
Iris
Soybea n
Wine
Thyroid
Fig. 1. Visual results obtained (the colors indicate the real classes) Table 1. Results obtained on standard databases (CF represent the number of found clusters, PR the purity , EC the error measure and TExe the execution time Databases
Cellular automata PR EC
CF Art1 Art2 Art3 Art4 Art5 Art6 CE.R.I.E.S. Glass Iris Pima Soybean Thyrod Wine
6.25 [1.26] 6.35 [1.39] 7.70 [1.38] 6.25 [1.04] 8.65 [1.31] 4.75 [0.62] 5.80 [1.2] 5.50 [0.92] 4.75 [1.18] 5.50 [1.48] 3.95 [0.28] 4.80 [0.6] 4.70 [0.66]
0.87 [0.09] 0.97 [0.04] 0.92 [0.06] 1.00 [0.00] 0.63 [0.19] 1.00 [0.002] 0.75 [0.18] 0.56 [0.16] 0.95 [1.00] 0.67 [0.08] 0.96 [0.11] 0.85 [0.12] 0.90 [0.1]
0.15 0.20 0.20 0.29 0.14 0.02 0.18 0.36 0.15 0.47 0.02 0.33 0.13
AHC TExe CF PR EC TExe
[0.03] [0.09] [0.05] [0.04] [0.03] [0.01] [0.02] [0.05] [0.05] [0.03] [0.05] [0.07] [0.04]
4.3s 5 0.84 0.15 0.92s 28s 3 0.98 0.14 23.73s 59s 3 0.89 0.16 32.34s 1.2s 3 1.00 0.13 0.11s 7.5s 10 0.78 0.08 14.25s 8.0s 5 1.00 0.03 0.91s 3.5s 3 0.56 0.24 0.25s 3.7s 3 0.49 0.43 0.14s 0.8s 3 0.88 0.13 0.05s 70s 3 0.48 0.48 9.52s 0.4s 6 1.00 0.08 0.00s 2.2s 5 0.84 0.35 0.14s 2.6s 6 0.84 0.20 0.06s
Table 2. Textual databases tested Databases
Size (# of documents) Size (Mb) # of real classes 259 332 185 2340
CE.R.I.E.S. AntSearch WebAce1 WebAce2
3.65 13.2 3.89 19
17 4 10 6
Table 3. Results obtained on textual databases Databases AntSearch CERIES WebAce1 WebAce2
Cellular automata EC CF PR 0.35 0.62 0.48 0.15
[0.06] [0.12] [0.10] [0.07]
4.2 3.6 3.8 8.0
[0.6] [0.9] [0.9] [0.6]
0.59 0.27 0.36 0.81
[0.21] [0.10] [0.21] [0.27]
AHC EC CF PR 0.17 0.36 0.28 0.29
6,00 3,00 4,00 3,00
0.79 0.29 0.27 0.79
On building maps of web pages with a cellular automata
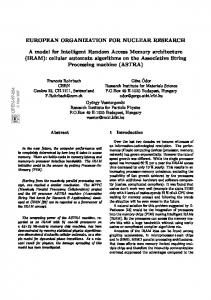
CE.R.I. E.S.
AntSea rch
Web Ace2
7
Web Ace1
Fig. 2. Results on the textual data bases
4.2 Textual data We have applied our algorithm on textual databases (see table 2). In this case, the similarity measure is computed with specific algorithms. The CE.R.I.E.S. database contains 258 texts dealing with healthy human skin [7]. The AntSearch database contains scientific documents dealing with several different subjects (73 documents about scheduling problems, 84 about image processing and pattern recognition, 81 about network and Tcp-Ip, and finally 94 about 3D and VRML courses). We have used a search engine to extract these documents from the web. The WebAce databases contain web pages extracted from Yahoo! categories [8]. We use the cosinus measure in order to compute the similarity between documents. Each document is represented as a vector of word count but weighted according to the tf-idf scheme [16]. The resulting clusters are analysed with the same methodology as the previous numeric databases. We present in figure 2 the obtained clusters (see table 3 for the complete results). We a priori know that the Webace1 and CE.R.I.E.S. databases are rather difficult for many clustering algorithms because the similarity is not very informative. So the poor results are not surprising. However, we wish to check if the generated map makes sense (because the found clusters are representative of the similarities, but the similarities are not representative of the expert a priori clustering). With the Webace2 and Antsearch databases, the obtained maps look now much better and one may clearly distinguish the original clusters on the obtained 2D grid. 4.3 Map generation From the previously created grid, we have generated a ” browsable ” map in the following way: the 2D positions of the documents are respected and the grid is converted into an HTML table. Each cell of the table contains one document and is annotated using the beginning of the document’s title. Then, with JavaScript commands, we may add interactions to the map. Clicking on a cell opens the corresponding document. Zooming the map is possible directly with the browser using the mouse wheel. The resulting map thus represents the similarities between documents, the title of documents and the possibility
8
H. Azzag, D. Ratsimba, D. Da Costa, C. Guinot, and G. Venturini
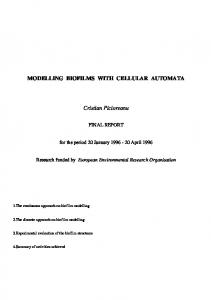
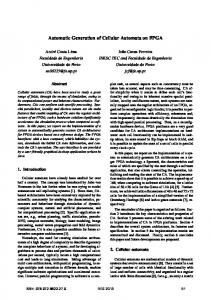
to zoom and open documents. It is possible to visually evaluate the size of clusters, and also to perform an information retrieval task by exploring the set of documents by their content. We present in figures 3 and 4 a complete map generated from the Antsearch database and a specific zoom on figure 4. Generating the keywords is very simple (and fast) but gives a basic explanation about the clusters. The beginnings of titles are complementary to each others and provide a good idea of the topic a given area of the map deals with. When one observes the titles, one may notice that these titles have many significant keywords in common. A simple and straightforward extension of this work would consist in extracting the keywords commonly found in every group of 9 cells (the considered cell to be annotated and its 8 neighboors) and to use these keywords for annotation.
Fig. 3. Example of a map generated on the Antsearch databases (319 documents) with annotations
5 Conclusion We have presented in this paper a new algorithm for visual clustering which makes use of cellular automata. We have experimentally shown that this algorithm is able to cluster in a relevant way standard numeric and textual databases. The main limitations of our method are the followings: 1) the annotation of cells is simple, 2) zooming on the map makes the user loose the global context of the map which is confusing when dealing with several thousands of documents, 3) some clustering errors remain. For keywords extraction, we have mentioned in the previous section a method which consists in extracting common keywords to groups of 9 cells. In order to avoid the loss of context, we propose to use a semantic zooming which establishes several hierarchical levels in the map: starting from the initial grid, one may easily group together the cells (by groups
On building maps of web pages with a cellular automata
9
Fig. 4. Zoom on a part of the Antsearch map
of 3 × 3 cells) and thus make several levels in the visualization. The annotations provided at an upper level could be derived from the previous lower level. This semantic zoom would allow the user to easily go from one level to the other and to keep a good perception of the global context of the map. Finally, as far as visualization is concerned, we could represent each document using visual attributes that are more informative than a colored cell: one could use for instance thumbnail views of the documents, or other visual attributes indicating the size, type, etc, of documents. From the clustering point of view, we think that our algorithm can be further improved with respect to clustering errors but also to its complexity. In the first case, we wish to use a local threshold for each data, rather than a global one. This will avoid that some data get too easily placed on the grid at the end of runs. For improving the algorithm complexity, one may consider that after a given number of time steps, some cells do not evolve anymore and that they should not be considered anymore. The number of cells to processed would thus decrease with time. Finally, we also want to prepare a comparison between our method and similar visual clustering algorithm like the SOM [11].
References 1. Azzag H, Picarougne F, Guinot C, Venturini G (2004). Un survol des algorithmes biomim´etiques pour la classification Classification et Fouille de Donn´ees, pages 13-24, RNTI-C-1, C´epadu`es. 2. Blake CL, Merz, CJ (1998). UCI Repository of machine learning databases http://wwwicsuciedu/mlearn/MLRepositoryhtml] Irvine, CA: University of California, Department of Information and Computer Science.
10
H. Azzag, D. Ratsimba, D. Da Costa, C. Guinot, and G. Venturini
3. Chen H, Schuffels C, Orwig R (1996). Internet categorization and search: a selforganizing approach In: Journal of visual communication and image representation, p 88-102. 4. Cugini, J (2000). Presenting Search Results: Design, Visualization and Evaluation In: Workshop: Information Doors - Where Information Search and Hypertext Link. San Antonio, TX, May 30. 5. Ganguly N, Sikdar BK, Deutsch A, Canright G, Chaudhuri P (2003). A Survey on Cellular Automata Technical Report Centre for High Performance Computing, Dresden University of Technology, December. 6. Gardner M (1970). Mathematical Games: The fantastic combinations of John Conway’s new solitaire game ’life’ Scientific American, pages 120-123, Octobre. 7. Guinot C, Malvy DJM, Morizot F, Tenenhaus M, Latreille J, Lopez S, Tschachler E, et Dubertret L (2003). Classification of healthy human facial skin Textbook of Cosmetic Dermatology Third edition. 8. Han Eui-Hong, Boley Daniel, Gini Maria, Gross Robert, Hastings Kyle, Karypis George, Kumar ipin, Mobasher Bamshad, Moore J (1998). Webace : a web agent for document categorization and exploration In AGENTS ’98 : Proceedings of the second international conference on Autonomous agents, pages 408-415, New York, NY, USA, ACM Press. 9. Handl Julia, Bernd Meyer. Improved ant-based clustering and sorting in a document retrieval interface. In Proceedings of the Seventh International Conference on Parallel Problem Solving from Nature, Vol. 2439 of Lecture Notes in Computer Science (pp. 913-923). Berlin, Germany: Springer-Verlag. 10. Jain AK, Murty MN, Flynn PJ (1999). Data clustering: a review, ACM Computing Surveys, 31(3), pages 264-323. 11. Kohonen T (1998). Self-organization of very large document collections: State of the art In: Niklasson, Lars; Bod´en, Mikael; Ziemke, Tom (Eds): Proceedings of ICANN98, the 8th International Conference on Artificial Neural Networks Conference: Sk¨ ovde, Sweden, September 2-4 Springer (London) 1998 p 65-74. 12. Lumer E, Faieta B (1994). Diversity and adaption in populations of clustering ants In Proceedings of the Third International Conference on Simulation of Adaptive Behaviour: From Animals to Animats 3, pages 501-508 MIT Press, Cambridge. 13. Mokaddem F,Picarougne F, Azzag H, Guinot G, Venturini G (2004). Techniques visuelles de recherche d’informations sur le Web, ` a paraˆıtre dans Revue des Nouvelles Technologies de l’Information, num´ero sp´ecial Visualisation en Extraction des Connaissances, Pascale Kuntz et Franois Poulet r´edacteurs invit´es, C´epadu`es. 14. Von Neumann J (1966). Theory of Self Reproducing Automata, University of Illinois Press, Urbana Champaign, Illinois. 15. Roussinov D, Tolle K, Ramsey M, McQuaid M, and Chen H (1999). Visualizing Internet Search Results with Adaptive Self-Organizing Maps. Proceedings of ACM SIGIR, August 15- 19, Berkeley, CA. 16. Salton G, Yang CS, Yu CT (1975).A theory of term importance in automatic text analysis Journal of the American Society for Information Scienc, 26(1):33-44. 17. Wise, J. A: The Ecological Approach to Text Visualization In: Journal of the American Society for Information Science (JASIS), 50 (1999) 13, p 1224-1233. 18. Zamir O, Etzioni O (1999). Grouper : a dynamic clustering interface to Web search results Computer Networks (Amsterdam, Netherlands : 1999), 31(11-16) :1361-1374.