On Client-Side Bottleneck Identification in HTTP Servers Ricardo Filipe, Serhiy Boychenko, and Filipe Araujo CISUC, Dept. of Informatics Engineering, University of Coimbra, Portugal {rafilipe, serhiy}@dei.uc.pt,
[email protected]
Abstract. Standing on virtualization techniques, low maintenance costs and economies of scale, cloud computing emerged in the last few years as a major trend in the industry. Since cloud resources grow and shrink as needed, providers and users of the cloud must carefully determine the exact amount of such resources they need. For this reason, getting accurate and timely information from the system is of paramount importance to properly adjust the means serving a given application. However, previous attempts to detect bottlenecks have resulted in complex, heavy and customized frameworks that lack any sort of standardization and may change widely from provider to provider. Improved monitoring mechanisms should be independent from the server technology, should require little to no configuration and should provide information of the real quality of service offered to clients. To reach these goals, we intend to observe the server infrastructure from the outside and gather the smallest possible number of metrics from the inside. We undertook several experiments in a controlled server, to identify the patterns that correspond to bottlenecks. These experiments clearly show that one can actually diagnose different bottlenecks, by analyzing response times on browsers. These results pave the way to future monitoring mechanisms, mostly based on quality of service evidence, supported by user data.
1
Introduction
In the last few years, cloud computing assumed a role of growing importance in computer systems. Licensing costs, energy, staff wages, the pay-as-you need billing contract, elasticity and the focus on business core rather than infrastructure are some aspects that make cloud computing so appealing. In fact, cloud computing services deliver different types of facilities, with minimal management effort or interaction with the service provider. This interaction occurs via networking and provides access to a shared pool of resources of virtual machines, load balancer, data management facilities, development platforms or even finished software products, depending on the cloud model, which is usually classified as one of three: Infrastructure-as-a-Service (IaaS), Platform-as-a-Service (PaaS) and Software-as-a-Service (SaaS). Despite being already quite successful, this new paradigm also raises concerns related to trustworthiness and dependability [1, 2]. Since resources are pooled
and shared among many clients, providers might be tempted to under-provide for the services they host, thus causing a poor experience for users, with low performance, excessive delays or even service outages. To prevent service disruption, the cloud provider or the owner of the service must promptly identify and remove bottlenecks, by launching extra resources, such as more bandwidth, CPUs or disk space. Unfortunately, this is not so simple in practice, because the providing side lacks a perfect picture of the service as seen by the client, from mouse clicking to downloading the last byte. Additionally, having precise metrics of a running system is expensive and causes a lot of interference with the system itself. To properly acquire or release cloud resources, service owners need a clear picture of system performance. This applies to the IaaS model, but may help controlling the quality of a PaaS deployment as well. In both cases, we assume that the client has limited access to the infrastructure or is unwilling to deploy an extensive monitoring solution, but still needs extremely accurate and timely information to control the power of elasticity. In Section 2, we focus on this exact problem: detecting bottlenecks using the minimum and simplest possible metrics. We aim to perform this bottleneck detection in three-tier web sites using client-side data, because clients have a better perspective of the offered quality of service than providers. To evaluate this possibility, we perform batch submission of requests to the service and collect timing responses on the client. This is not unlike the current paradigm of HTTP performance tools, like HTTPerf [3] or JMeter [4]. With one of these tools, the system administrator controls the invocation of large numbers of requests to observe the response of the system, usually for the sake of fine-tuning performance. However, since these tools impose a heavy load to the service (and thus are usually ran offline), we aim to perform a similar evaluation online, while standard users are running the service. Instead of generating artificial requests, our goal is to use real requests for the same purpose, by collecting and uploading browser data to the system administrators. Our long-term goal is to identify as many problems as possible. In this paper, we restrict our effort to the three resources that are more important for performance: CPU, server I/O access and client-server bandwidth. This paper describes our initial efforts to take these client-side measurements: our technological approach, the experiments and the differences we get from measuring everything from JMeter. Interestingly, while in theory we could use JMeter in a controlled environment to distinguish the source of the bottleneck (bandwidth, I/O, or CPU) from one metric alone (total time to obtain the answer), in a real uncontrolled environment we need to split this metric into other two (time to get the first byte, and time to get the entire response) and add one more metric: the query time of the request (or the CPU usage time, which will provide us the same result). The main contribution of this paper is precisely to demonstrate the feasibility of identifying specific bottlenecks (CPU, I/O or network) using browser
metrics plus an internal server metric. We describe this process and our main contribution in Section 3. We review the current literature in Section 4. We discuss the current status of our work and future perspectives in Section 5.
2
The Client-Side Tool
We follow a very simple approach to detect possible bottleneck causes of 3-tier Web systems. We only consider three possible causes: processing, database or bandwidth bottlenecks. Processing bottlenecks are related to CPU limitations, which may be due to HTTP thread pool limitations of the Web Server (specially the front-end machines), or CPU machine exhaustion, e.g., due to bad code design that causes unnecessary processing. Database bottlenecks are related to Input/Output operations, which clearly depend on query complexity, database configuration and database access patterns. Bandwidth bottlenecks are related to network congestion, significantly affecting client-server communication times. We assume the point of the view of an IaaS cloud, although our method can also partly apply to a PaaS or a mixed scheme. The client does not own the resources, but has some control on the source code of a site he or she wants to make publicly available. However, the client may have limited access to the cloud infrastructure configuration. I.e, the client can deploy, but may not be able or willing to change cloud configuration. Hence, we want to avoid capturing a large set of internal system metrics, but we can collect timestamps during the HTTP processing, doing only slight modifications to the application source code. Table 1. Measured metrics Metric
Description
Request Time
Time between connection initialization and first response byte received from server Response Time Time between first and last response byte received from server Latency Time delay experienced in clientserver communication Query processing Time that an HTTP request spends time on the database Total Time Request + Response Time
We initially considered a number of metrics that should allow us to understand if the system has some bottleneck and where. These metrics contain a mix of network and database times. We do not need the CPU time, because we can infer this time based on the query processing time. In Table 1 we list these metrics and their corresponding description. In an ideal closed setting, we only
Table 2. Metrics Required to Detect Bottleneck (Theoretical Results) Bandwidth Database Threads Request Time Response Time
F T
T F
T F
needed the Total Time (request time plus the response time) to distinguish the aforementioned three bottlenecks, if they occur separately. In a bandwidth bottleneck between client and server, the difference between request and response time will tend to grow with the load of the system (specially if the HTTP answer is considerably bigger than the request). In a database bottleneck, the time to get the first byte of response will tend to grow with the load of the database. A processing bottleneck will have a similar effect. To distinguish these two cases, we can submit multiple equal jobs at once using more jobs than threads available to run them: responses will come in groups. To give an example, assume that the server has a pool of 5 threads. If we submit 20 jobs at once that take around 0.5 seconds of CPU time each, every 0.5 seconds (plus a few other delays) we will get 5 different responses. This is a clear indication of a CPU bottleneck. In reality getting such a clearly defined pattern is not so easy, because requests will not occur in clearly defined batches. Hence, we need one additional measurement to distinguish between a CPU and a database bottleneck. We use the query processing time. Unlike the previous metrics of Table 1, this one is internal to the server. We could also consider the processing time, but this is reciprocal to the former. Fortunately, we may eliminate the latency, because this is constant and should not grow on a server bottleneck. In Table 2, we display the relation between the bottlenecks that we are observing and the variables necessary to detect them. We use a “T” (true) and “F” (false) to express the necessity or lack of it to use a variable to observe a given bottleneck. These relations are ideal. A practical setting may be more complex, as we show in Section 3. A simple way to take measurements from the client side is to use a performance evaluation tool, like Apache’s JMeter. The inconvenience of this approach is that it may only work if the client machine is powerful enough to stress the server and the server is disconnected from real users in a testbed. We intend to follow a different approach. Since it is our goal to tackle more generic settings, we want to use data from real clients. For this we collect the required metrics directly from the user’s browser, using the JavaScript Navigation Timing API1 . This JavaScript library can read the request and the response times of a given HTTP interaction. When the requested resource loading finishes, we send performance indicators (via AJAX) to a small web service, which stores timing data on a database. The remaining times of the process might be kept directly on the server side2 . Putting in simple terms, a final implementa1
2
https://dvcs.w3.org/hg/webperf/raw-file/tip/specs/NavigationTiming/ Overview.html Nevertheless, for the sake of simplicity, in the tests we performed, we first sent the server data to the client, which then uploads all the metrics in a single operation.
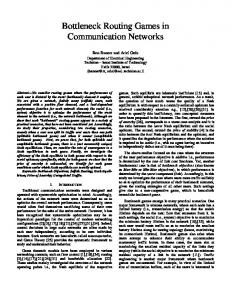
Server 1 HTTP Requests
tc Load balancer
Server 2
Database
Server 3 Fig. 1. Experimental setup
tion should works like this: the owner of the site should add a few JavaScript lines to the web page, to instruct the browser to collect the necessary metrics. After collecting these metrics, the browser should send them to the server. This will enable the owners of the site to analyze performance results as seen by the clients. This analysis, however, might be more complex than with JMeter, because it is full of real life noisy data. In the next section, we observe and tackle this precise problem.
3
Experimental evaluation
The goal of our experiments was to observe the feasibility of taking client-side measurements to detect performance bottlenecks. For this, in this Section, we first describe the setup, before detailing the experimental results. 3.1
Experimental Setup
To run our experiments, we deployed the “Java Petstore” [5] application, including the Petstore schematic tables. In the front-end of the server, we have a load balancer that directs user requests to a group of GlassFish Application Servers [6] running in different VMs. These Application Servers take care of the presentation (first) and business (second) tiers. The business tier is stateless, because the Java application keeps all its data in the back-end database (the third tier). This architecture is illustrated on Figure 1. The load balancer machine runs an Apache HTTP Server and an AJP Connector for the load balancing. We also installed a Traffic Control tool (tc)3 on the system entry point to simulate a congested network. To ensure that some page requests took longer and 3
http://www.tldp.org/HOWTO/html_single/Traffic-Control-HOWTO/.
Table 3. Software used and distribution Component
Observations
Version
Load Balancer HTTPD with AJP Connector 2.2 Cluster VMs with GlassFish 3.1.2 Database MySQL 5.1.69
to avoid cache utilization that would change the bottlenecks, we increased the contents of the database tables, relatively to the original petstore. Table 3 summarizes the most important software components of this experiment. We evaluate the performance of this system using two different methods. The first injects requests through a standard performance evaluation tool (Apache JMeter). This approach enables us to run a finely controlled experience, although limitations of the client machine running the Apache JMeter may cause requests to slide in time. To simulate an intensive utilization of the web site by browsers, in the second method, we submitted requests to our infrastructure using the Firefox web browser from 15 machines. The requests were submitted using a script that started the browser on every machine. The purpose of this experience is to analyze the difference between a tool like JMeter and a simulation that is closer to the real-life Internet utilization with different browsers accessing the same infrastructure. We injected three different bottlenecks on the server: a database bottleneck, a network bottleneck and a CPU bottleneck. The first one corresponds to requests that read a large amount of data from the database, to inject the second one we use the traffic control tool and, to delay the responses in the CPU, we reduce the overall number of threads in the cluster to 5 and put them to sleep 1 second. 3.2
Results
We show the results of our experiments in Figures 2, 3, and 4. On the left-side of the figures we have the response to the JMeter tool. On the right-side, we have the response to the browsers. The x-axis shows the number of the request, from 1 to 50 with JMeter, and from 1 to 15 with the browsers, whereas the y-axis shows the time of each response in milliseconds. Using JMeter, we managed to minimize the number of external factors interfering with our measurements. For example, network latency is almost always the same, because all the clients are run from the same node, in the same local area network as the server. Furthermore, the tool will spawn multiple threads at once that will send the same request to the server within the shortest possible time frame. This will contribute to a nearly simultaneous arrival of all the requests. In the case of the browsers test, due to the distributed nature of the simulation environment, the results are much noisier. We noticed that the delay of starting a new browser sometimes goes to several hundreds of milliseconds, making it very hard to perform simultaneous requests, not to mention the differences in the local clocks, as each machine decides when to launch the browser. Unlike
������������������
������������������
������
����� �����
�����
�����������
�����������
����� �����
�����
����� �����
�����
��
������������� ������������ ������������������� ����������
���� ������������ ��
��
���
���
��� ��� ��� ��������������
���
���
��
���
��
��
��
��
�� ��� ��������������
���
���
���
Fig. 2. CPU bottleneck �������������������
������������������� �����
������
����� ����� �����������
�����������
����� �����
�����
�����
�����
��
������������� ������������ ��������������������� ����������
�����
����� ������������ ��
��
���
���
��� ��� ��� ��������������
���
���
��
���
��
��
��
��
�� ��� ��������������
���
���
���
Fig. 3. Database (I/O) bottleneck ������������������
������������������
�����
������
�����
������ ������
�����
�����������
�����������
�����
����� �����
������������� ������������ ��������������������� ����������
������ ������
����� ������
���� ��
������������� ��
��
���
���
��� ��� ��� ��������������
���
���
���
��
��
��
��
��
�� ��� ��������������
���
���
Fig. 4. Network bottleneck
this, in the JMeter case, the delay of the requests was within the few milliseconds range. The browser experiment is therefore more akin to a possible real utilization of the site, but, as we shall see, results become harder to interpret. After plotting the results, we identified several patterns resulting from Request and Response Times. Firstly, for the JMeter tests, we noticed the laddertype behavior, when the server reaches its HTTP thread pool limit (in our case, the GlassFish cluster was limited to serve 5 simultaneous requests). Since all clients were launched almost simultaneously and given the significant processing time, the steps of the ladder are easily identifiable on the left side of Figure 2.
���
We repeated the tests, changing the number of threads in the HTTP thread pool of cluster instances and were always able to observe this behavior. When a database bottleneck is present in the system, the time taken to generate the page is dominant in the overall process. This behavior turns Request Time into the largest factor in communication, because the time it takes for the server to send the first byte of the response is mostly consumed on the database query. When the bandwidth is the source of the performance problem, the time taken to transfer the page from the server becomes dominant in the total communication time. We can ignore the time it takes to transfer the data from the client to the server, because in most cases the client request size is very small in comparison to the server response. The Response Time is therefore crucial to identify a bandwidth bottleneck in the infrastructure. Additionally, we expect the pattern of bandwidth bottlenecks to be less regular, because the request and response packets have to go through a congested channel. We can see these differences on the left sides of Figures 3 and 4. One should notice that these plots display different metrics. In the case of the network bottleneck, we display the Response Time, whereas in the other two cases we display the Request Time (both metrics are easily available in JMeter and browsers). This observation agrees with Table 2, i.e., these times suffice to identify different types of bottlenecks. Most of the patterns we observed on the previous experiment occur again in the browsers experiment, but it is harder to distinguish between different bottlenecks using only client-side measurements. For example, the CPU bottleneck loses its ladder-like aspect that is so characteristic in a very controlled environment (refer to the right side of Figure 2). Despite still being there, the effect is much less visible in the browsers experiment, and, we believe that, in general, one might be completely unable to identify this specific kind of bottleneck from the Request Time alone. A clear separation requires an extra variable to distinguish the time the request spends on the CPU from the time it spends on the database. We show the CPU processing time (Figure 2 right) and query processing time for this (Figure 3 right). With these metrics, the component responsible for the delay is immediately identified. In fact, although the difference in patterns between the Request Times of Figures 2 and 3 (which are nearly the same as the Total time) might be unclear, the query processing time is negligible in the case of the CPU bottleneck, whereas the CPU processing time is negligible in the other case. Furthermore, the query processing time we measured includes the waiting time to access the database and thus makes the evaluation simpler, when compared to the CPU processing time, which we can see as a constant in Figure 2 right. In fact, this difference in behavior could be eliminated, if one includes the waiting time for the CPU in the CPU processing time, and, therefore, we can consider the query processing time and the CPU processing time to be pretty much equivalent for our needs. In light of these results, we are now able to review Table 2, to consider the evaluation of bottlenecks under more realistic settings. As a result, we created
Table 4. Metrics Required to Detect Bottleneck(Practical Results) Bandwidth Database Threads Request Time Response Time Database Query Time
F T F
T F T
T F T
Table 4, which adds the database query time. This table is a step towards identifying bottlenecks using timing measurements from real web clients.
4
Related Work
We divide the related work regarding bottleneck detection into three main areas: first, we go through academic studies that use data from inside the system to detect bottlenecks; then, we review academic studies that collect information from the client’s point-of-view; and, finally, we analyze industrial tools. 4.1
Academic Studies Using Inside System Methodologies
In the literature, we can find a large body of work aiming to detect, predict and even change system configuration, usually in n-tier HTTP server systems, similar to the one we evaluated in this paper [7–12]. For comprehensive purposes, we divided these papers into two main categories: (i) analytic models that collect system metrics, to ensure detection or prediction of bottlenecks; (ii) rule-based methodologies that scale up or down system resources. Concerning analytic models (i), Malkowski et al. [13] aim to ensure low service response times. Authors collect many system metrics, like CPU or memory utilization, and correlate them with system performance. This should expose the metrics that best identify the bottlenecks. However, this form of analysis collects more than two hundred system and application metrics. In [14], Malkowski et al. studied bottlenecks in n-tier systems even further, to expose the phenomenon of multi-bottlenecks, due to multiple resources reaching saturation. The main conclusion from this work is that lightly loaded resources may be responsible for multi-bottlenecks causing a chain reaction in the n-tier system. The framework used is very similar to their previous work, requiring again full access to the infrastructure. Wang et al. followed this approach in [12], with in-depth analysis of metrics in each component of the system. The goal was to detect transient bottlenecks with durations as low as 50 milliseconds. The problem with these approaches is that acquiring such finely-grained data is very hard to transpose to different hardware and software architectures. [15] presents an approach that uses a queuing model for each tier of the system, to predict the server capacity for a given workload. Authors focused mainly on web server performance and stateless applications. [7] uses DAG-based data flow programs running on cloud infrastructures, to detect CPU and I/O bottlenecks. In [11], authors presented a statistical machine learning framework to
predict bottlenecks and achieve elasticity in terms of VMs. [10] presents a dynamic allocation of VMs based on SLA restrictions. The framework consists of a continuous system introspection that monitors the cloud system and their components. This, however, requires continuous resource consumption (paid by the user) and scalability to large cloud providers. A different approach was followed by [16], where the main goal is not bottleneck detection, but optimal resource utilization using heuristic models. Regarding rule-based methodologies (ii), Iqbal et al. [8, 17] propose an algorithm that processes proxy logs and, at a second phase, all CPU metrics of web servers. The purpose is to achieve elasticity concerning the number of instances of the saturated component. [18] uses static performance-based rules. In this approach, if a component resource saturation is observed, then, the user will be migrated to a new virtual machine through IP dynamic configuration. We can also find many papers that are more closely related to benchmarking and performance analysis than to bottleneck detection. For example, [19], presents the “C-Meter” cloud benchmark framework. It gathers lower level metrics, such as the time spent on resource acquisition, or the wait time in queue for a workload job to be processed. However, these metrics are only accessible to the cloud administrators. [20] benchmarks the Amazon EC2 cloud infrastructure. The main conclusion is the fact that applications in cloud environments will have some performance degradation, when compared to similar application running in Linux clusters and other physical machines. This degradation is strongly associated with the network traffic generated by the application. In other words, applications with higher network requirements will have a higher performance degradation in cloud environments. 4.2
Academic Studies Using Outside System Methodologies
This section reviews solutions that try to detect bottlenecks without having access to the observed infrastructure. In [21], authors propose a client-based collaborative approach. They use a web browser plug-in on each client that monitors all client Internet activity and gathers several network metrics. The plug-in focus is mainly the HTML initial page. It discards page resources from third-party providers, such as CDN objects, and sends all information of the main site to a central point, for processing. The impact of this approach on network bandwidth and client data security is unclear. Additionally, [21] only handles network connectivity bottlenecks. In [22], authors present Netalyzr, a Java applet for browsers that clients can use to understand why some connection is slow. This tool is mostly used when clients experience some problem. When a client wants to diagnose why some URL is slow, the tool makes several HTTP requests from distinct locations, to gather several network metrics. Although very powerful for connectivity issues, it does not analyze system or performance bottlenecks. [23] uses a different approach, implementing a Web crawler that gathers HTTP, DNS and TCP connection data from different locations. The main goal is to understand in what network layer do mostly of the user-visible page failures
occur. Dasu [24] is a client-based software. It has more than 90,000 installations, allowing the collection of metrics from different end users. As mentioned by the authors, it is limited by the number of hosts that are online and, consequently, cannot run continuous measurements. It only collects metrics associated with the client network point-of-view, discarding application measurements, such as HTML objects from third-party resources. In [25], Flach et al. present a browser plugin that collects information and analyzes sites based on rules. Again, this paper focuses on network metrics and connectivity issues. Another similar approach is presented in [26], where a Firefox extension based on javascript was created to gather client information, to diagnose network problems. Firelog [27] is another plugin for the Firefox browser. It gathers network metrics for later evaluation of networking issues. Unlike the previous work, the collected data is not processed in real time, but transferred to a PostgreSQL database. Besides connectivity issues, authors also look at client performance problems occurring during page rendering. In [28], Padmanabhan et al. use the PlanetLab [29] infrastructure, to gather network information from 80 sites and analyze the source of the problems. Despite not requiring any browser extension, and thus being able to run out-of-the box (provided that an infrastructure is available), recent studies showed that this pattern of concurrent accesses can significantly change the results observed [30]. 4.3
Industrial Tools to Detect and Prevent Bottlenecks
We classify industrial tools for bottleneck prevention into three major groups: (i) monitoring applications that have access to the infrastructure. This group requires heavy configuration and administration, because it is quite similar to the group of applications presented in Section 4.1; (ii) access only to URLs. In this case, the tool allows the client to configure the URLs to monitor and the SMS or email to notify, when something is wrong (according to the tool rules). As in the work we mentioned in Section 4.2, these tools can only detect network bottlenecks or a “slow” server, thus falling short of a deep evaluation; (iii) hybrid tools that collect information from inside and outside of the system. Although very powerful, they need constant maintenance, to ensure the system is correctly monitored [31]. Table 5 illustrates the kind of resource problem detected by some of the aforementioned literature. The second column concerns the need to increase CPU resources or VM instances. The third column is associated to I/O, normally an access to a database. The bandwidth column represents delays inside the cloud network or to the client — normally browser or web services. It is relevant to mention that several papers [7, 14, 32] only consider CPU (or instantiated VM) and I/O bottlenecks, thus not considering internal (between the server components) or external (client-server connection) bandwidth. A different set of work does exactly the opposite, focusing mostly on network issues. In fact, we can clearly see that papers presented in Section 4.1 tend to handle server bottlenecks, whereas papers presented in Section 4.2 tend to cover network bottlenecks.
Table 5. Bottlenecks detection in related work Article CPU/Threads/VM I/O Connectivity issues [7] [8] [13] [9] [12] [14] [18] [21] [22] [23] [24] [25] [27] [28] [26]
X X X X X X X
X X X X
Internal Internal X External External External External External External External External
We are looking for bridging this gap. We are not tied to any specific architecture, as we try to evaluate the bottlenecks from the client side, while, at the same time, we aim to identify precise server bottlenecks. To stay independent from the architecture, we use internal times of the application performing a monitoring task, instead of reading system metrics, like CPU or disk occupation. Furthermore, we try to reduce the collection of the internal times to the smallest number of points, to create a simple system. The fact that we use the standard Navigation Timing API, instead of implementing a full browser plugin also makes things simpler. Additionally, by taking measurements from the perspective of the client, we can have a better insight on the quality of the response. This approach seems preferable to taking a large number of measurements from the distributed architectures involving multiple vendors that compose cloud systems.
5
Conclusion
The allocation of virtualized resources poses a challenge to system architects and administrators as they need to properly provision cloud resources for applications. To achieve this goal, we proposed to detect three types of bottlenecks: processor, bandwidth and I/O. Unlike previous work, we mostly aim to use client-side metrics for detailed observation of the server. The point is to strongly reduce the intrusiveness of monitoring. While other approaches analyze dozens or hundreds of server-side metrics, so far, our evaluation suggests that we need only one such metric, to distinguish CPU time from database query times. Our initial results show that it is possible to interpret the provider infrastructure as a “black box” and still detect bottlenecks. We recognize that our work is still in an early phase. While this paper demonstrates that we can identify the source of a bottleneck with only a handful of
metrics, the great challenge is to do such detection in real time with actual client requests distributed over time, instead of using a single burst of requests over an offline system. The ability to do so might turn out to be an excellent way of improving the existing monitoring tools, by introducing the client perspective of performance and still distinguishing different types of bottlenecks.
References 1. B.P. Rimal, Eunmi Choi, and I. Lumb. A taxonomy and survey of cloud computing systems. In INC, IMS and IDC, 2009. NCM 09. Fifth International Joint Conference on, pages 44–51, 2009. 2. James Hamilton. Internet-scale service infrastructure efficiency. SIGARCH Comput. Archit. News, 37(3):232–232, June 2009. 3. Papers — HP Web Server Performance Tool. http://www.hpl.hp.com/research/ linux/httperf/. Retrieved August 20, 2013. 4. Performance tools — Apache JMeterT M . http://jmeter.apache.org/. Retrieved August 20, 2013. 5. Technical white papers — Java Petstore 2.0. http://www.oracle.com/ technetwork/java/index-136650.html. Retrieved August 20, 2013. 6. Technical white papers — GlassFish Application Server. http://glassfish.java. net/. Retrieved August 20, 2013. 7. D. Battre, M. Hovestadt, B. Lohrmann, A. Stanik, and D. Warneke. Detecting bottlenecks in parallel dag-based data flow programs. In Many-Task Computing on Grids and Supercomputers (MTAGS), 2010 IEEE Workshop on, pages 1–10, 2010. 8. Waheed Iqbal, Matthew N Dailey, David Carrera, and Paul Janecek. Adaptive resource provisioning for read intensive multi-tier applications in the cloud. Future Generation Computer Systems, 27(6):871–879, 2011. 9. Y. Shoaib and O. Das. Using layered bottlenecks for virtual machine provisioning in the clouds. In Utility and Cloud Computing (UCC), 2012 IEEE Fifth International Conference on, pages 109–116, 2012. 10. Nikolaus Huber, Fabian Brosig, and Samuel Kounev. Model-based self-adaptive resource allocation in virtualized environments. In Proceedings of the 6th International Symposium on Software Engineering for Adaptive and Self-Managing Systems, SEAMS ’11, pages 90–99, New York, NY, USA, 2011. ACM. 11. Peter Bod´ık, Rean Griffith, Charles Sutton, Armando Fox, Michael Jordan, and David Patterson. Statistical machine learning makes automatic control practical for internet datacenters. In Proceedings of the 2009 conference on Hot topics in cloud computing, HotCloud’09, Berkeley, CA, USA, 2009. USENIX Association. 12. Qingyang Wang, Yasuhiko Kanemasa, Jack Li, Deepal Jayasinghe, Toshihiro Shimizu, Masazumi Matsubara, Motoyuki Kawaba, and Calton Pu. Detecting transient bottlenecks in n-tier applications through fine-grained analysis. ICDCS13. 13. Simon Malkowski, Markus Hedwig, Jason Parekh, Calton Pu, and Akhil Sahai. Bottleneck detection using statistical intervention analysis. In Managing Virtualization of Networks and Services, pages 122–134. Springer, 2007. 14. Simon Malkowski, Markus Hedwig, and Calton Pu. Experimental evaluation of ntier systems: Observation and analysis of multi-bottlenecks. In Workload Characterization, 2009. IISWC 2009. IEEE International Symposium on, pages 118–127. IEEE, 2009.
15. Rahul Singh, Upendra Sharma, Emmanuel Cecchet, and Prashant Shenoy. Autonomic mix-aware provisioning for non-stationary data center workloads. In Proceedings of the 7th international conference on Autonomic computing, ICAC ’10, pages 21–30, New York, NY, USA, 2010. ACM. 16. Ruiqing Chi, Zhuzhong Qian, and Sanglu Lu. A heuristic approach for scalability of multi-tiers web application in clouds. In Innovative Mobile and Internet Services in Ubiquitous Computing (IMIS), 2011 Fifth International Conference on, pages 28–35, 2011. 17. Waheed Iqbal, Matthew N Dailey, David Carrera, and Paul Janecek. Sla-driven automatic bottleneck detection and resolution for read intensive multi-tier applications hosted on a cloud. In Advances in Grid and Pervasive Computing, pages 37–46. Springer, 2010. 18. Huan Liu and Sewook Wee. Web server farm in the cloud: Performance evaluation and dynamic architecture. In Proceedings of the 1st International Conference on Cloud Computing, CloudCom ’09, pages 369–380, Berlin, Heidelberg, 2009. Springer-Verlag. 19. N. Yigitbasi, A. Iosup, D. Epema, and S. Ostermann. C-meter: A framework for performance analysis of computing clouds. In Cluster Computing and the Grid, 2009. CCGRID ’09. 9th IEEE/ACM International Symposium on, pages 472–477, May 2009. 20. K.R. Jackson, L. Ramakrishnan, K. Muriki, S. Canon, S. Cholia, J. Shalf, Harvey J. Wasserman, and N.J. Wright. Performance analysis of high performance computing applications on the amazon web services cloud. In Cloud Computing Technology and Science (CloudCom), 2010 IEEE Second International Conference on, pages 159–168, Nov 2010. 21. S. Agarwal, N. Liogkas, P. Mohan, and V.N. Padmanabhan. Webprofiler: Cooperative diagnosis of web failures. In Communication Systems and Networks (COMSNETS), 2010 Second International Conference on, pages 1–11, Jan 2010. 22. Christian Kreibich, Nicholas Weaver, Boris Nechaev, and Vern Paxson. Netalyzr: Illuminating the edge network. In Proceedings of the 10th ACM SIGCOMM Conference on Internet Measurement, IMC ’10, pages 246–259, New York, NY, USA, 2010. ACM. 23. C.M. Vaz, L.M. Silva, and A. Dourado. Detecting user-visible failures in web-sites by using end-to-end fine-grained monitoring: An experimental study. In Network Computing and Applications (NCA), 2011 10th IEEE International Symposium on, pages 338–341, Aug 2011. 24. Mario A. S´ anchez, John S. Otto, Zachary S. Bischof, David R. Choffnes, Fabi´ an E. Bustamante, Balachander Krishnamurthy, and Walter Willinger. Dasu: Pushing experiments to the internet’s edge. In Presented as part of the 10th USENIX Symposium on Networked Systems Design and Implementation (NSDI 13), pages 487–499, Lombard, IL, 2013. USENIX. 25. Tobias Flach, Ethan Katz-Bassett, and Ramesh Govindan. Diagnosing slow web page access at the client side. In Proceedings of the 2013 Workshop on Student Workhop, CoNEXT Student Workhop ’13, pages 59–62, New York, NY, USA, 2013. ACM. 26. Mohan Dhawan, Justin Samuel, Renata Teixeira, Christian Kreibich, Mark Allman, Nicholas Weaver, and Vern Paxson. Fathom: A browser-based network measurement platform. In Proceedings of the 2012 ACM Conference on Internet Measurement Conference, IMC ’12, pages 73–86, New York, NY, USA, 2012. ACM.
27. Heng Cui and E. Biersack. Troubleshooting slow webpage downloads. In Computer Communications Workshops (INFOCOM WKSHPS), 2013 IEEE Conference on, pages 405–410, April 2013. 28. Venkata N. Padmanabhan, Sriram Ramabhadran, Sharad Agarwal, and Jitendra Padhye. A study of end-to-end web access failures. In Proceedings of CoNEXT, Lisboa, Portugal, December 2006. 29. Papers — Planet Lab. https://www.planet-lab.org/. Retrieved June 8, 2015. 30. Joel Sommers and Paul Barford. An active measurement system for shared environments. In Proceedings of the 7th ACM SIGCOMM Conference on Internet Measurement, IMC ’07, pages 303–314, New York, NY, USA, 2007. ACM. 31. Papers — External Site Monitoring Services. http://softwareqatest.com/ qatweb1.html#MONITORING. Retrieved June 8, 2015. 32. Balvinder Singh. Article: Bottleneck occurrence in cloud computing. IJCA Proceedings on National Conference on Advances in Computer Science and Applications (NCACSA 2012), NCACSA(5):1–4, May 2012. Published by Foundation of Computer Science, New York, USA.