The use of functional vectors has been an industry stan- dard for speed binning purposes of high performance ICs. This practice can be prohibitively expensive ...
On Correlating Structural Tests with Functional Tests for Speed Binning of High Performance Design J. Zeng1 , M. Abadir1 , G. Vandling2 , L. Wang3 , A. Kolhatkar1 , and J. Abraham4 1
Freescale Semiconductor Inc., Austin, TX 2 Cadence Design Systems, Endicott, NY 3 University of California, Santa Barbara, CA 4 University of Texas at Austin, Austin, TX
Abstract The use of functional vectors has been an industry standard for speed binning purposes of high performance ICs. This practice can be prohibitively expensive as the ICs become faster and more complex. In comparison, structural patterns can target performance related faults in a more systematic manner. To make structural testing an effective alternative to functional testing for speed binning, structural patterns need to correlate with functional test frequencies closely. In this paper, we investigate the correlation between functional test frequency and that of various types of structural patterns on MPC7455, �� 1 a Motorola instruction set processor executing to the PowerPC architecture.
1. Motivation Speed binning refers to the procedures which determine the maximum operating frequency of a chip. This maximum frequency determines the speed-grade at which the chip will be offered to customers. Speed binning is typically done with functional test patterns. Functional patterns are expensive to develop and require a significant effort by the design team. Furthermore, there is no formal measure of the patterns’ effectiveness in measuring the true speed of a complex design. Applying these functional patterns, at full system speed, requires an expensive, full-function tester that can provide a high degree of timing and edge accuracy. As designs become faster and more complex, the costs associated with development of functional patterns and those associated with functional testers are becoming prohibitive. 1 PowerPC is a trademark of the International Business Machines Corporation, used under license therefrom.
Structural tests can be generated automatically by ATPG tools. By selecting a transition fault model and/or a path delay fault model, the ATPG patterns can target the design’s overall performance. The fault coverage of the ATPG patterns provides a succinct measure of pattern quality. It is much easier to debug ATPG patterns. Scanbased structural tests can be applied by lower cost testers. While scan data may require large amount of tester memory, fewer tester channels are required and few, if any, high accuracy functional channels are required. Structural tests have been generally used for defect detection. In [5], delay testing techniques are described to characterize the delay-related defects. The authors show that reasonable defect level per million would not be achievable without delay testing. In another paper[4], pragmatic application of structural delay tests is described from early design to the post-silicon phase. In [7], structured delay tests for defect detection are applied at a wide variety of operating conditions to explore the relationship between test frequency and defect coverage. To utilize structural tests for speed binning purposes, previous results [2] have shown the correlation between frequencies defined by functional test, and those by atspeed memory test, transition fault tests which do not go through the arrays, and latch to latch path delay tests. There are coverage holes left by the lack of transition tests which go through arrays and timing critical paths other than the latch to latch paths. In another paper [3], a linear relationship between the frequency determined by the functional tests and latch to latch path delay tests is described. The authors use the functional tests to establish the coefficients of a linear relationship between the two frequencies. Using that linear relationship, latch to latch path delay vectors can be used for speed binning purposes during the production phase.
ITC INTERNATIONAL TEST CONFERENCE 0-7803-8580-2/04 $20.00 Copyright 2004 IEEE
Paper 2.2 31
At-speed AC scan tests were generated for transition faults. We used broad-side transition fault test generation, where the functional clock came from the on-chip PLL[8][6]. This setup was also used for transition fault tests going through arrays and path delay tests. Specific launch and capture clock sequences were given to an ATPG tool during test generation[9]. In order to detect a transition fault, an ATPG tool does not necessarily travel the longest path which limits the maximum operating frequency. So in general, a transition test may not always expose a small delay fault along a critical path. The detection of some transition faults requires going through embedded arrays, either for control or for propagation. As noted in [2], typical transition test sets do not provide high coverage in the logic associated with the 2. Structural Tests custom memory arrays. The difficulty of detecting tranWe use the similar overall DFT strategy which was de- sition faults that require going through arrays stems from scribed in [1][10]. the fact that: (a)it is generally hard to model memories to The following structural test patterns will be used for ATPG tools, (b)those faults require longer test sequences speed binning experiments later: and more complex clocking.
This paper investigates the correlations between functional test frequency and the frequencies measured using various types of structural patterns. These measurements were performed on a state of the art high performance microprocessor. In Section 2, we describe different types of structural tests used for experiments in this paper. In Section 3, we present our preliminary data which compares the frequencies defined by different types of structural tests to that of the functional tests. We also look into the possibility of using structural tests for speed binning purposes. In section 4, we present our conclusions and plans for follow-up work.
at-speed memory BIST tests: also called ABIST for A(array)BIST. We use the terms array and memory interchangeably in this paper.
2.3 Transition Fault Tests Going Through Arrays
A different set of transition fault patterns was generated that provided coverage in the logic associated with the custom memory arrays (as well as the rest of the logic). transition tests going through arrays: also referred It is important to note that many of the frequency limiting paths in most industrial microprocessors are associto as complex transition tests in this paper. ated with the custom memory arrays[2]. latch to latch path delay tests: also referred to as simple path tests in this paper. 2.4 Path Delay Tests memory and cycle-stealing path delay tests: also referred to as complex path tests in this paper. Static timing analysis (STA) can be used to generate a list transition tests w/o going through arrays: also referred as simple transition tests in this paper.
2.1 Memory BIST Test Memory BIST focuses exclusively on testing the logic inside the embedded memory arrays and signals that touch the BIST circuitry, such as BIST address/data muxes and fail/redundancy data collection downstream of the memories. Memory BIST running at functional speed can catch timing related faults inside the memories. This is especially important for high performance ICs in which the custom designed memories gate the frequency. 2.2 Transition Fault Tests w/o Going through Arrays Transition fault tests target slow to rise and slow to fall defects at the inputs and output of each logic gate. The number of transition faults in a design scales linearly with the size of the design.
Paper 2.2 32
of critical paths. A path delay ATPG engine can then be used to generate path delay tests for these critical paths. The advantage of this methodology is that the critical paths identified by STA are the best candidates to expose subtle timing issues. Note that the path delay fault universe is exponential with respect to the size of the circuit. This makes it impossible for all the paths to be tested completely. A limitation of path delay test based on critical paths is that the critical paths identified by STA do not always determine the IC’s speed. The accuracy of STA is affected by several physical factors such as temperature, clock skew, interconnect delays and crosstalk effects. To perform meaningful path delay tests, all the delay path types need to be included. This includes not only the latch to latch paths, but also memory and cycle stealing paths. This is especially important for speed binning high performance ICs.
2.4.1 Latch to Latch Path Delay Tests Latch to latch delay paths are launched from latch outputs and captured at latch inputs. This is the simplest type of delay path. 2.4.2 Memory Path Delay Tests
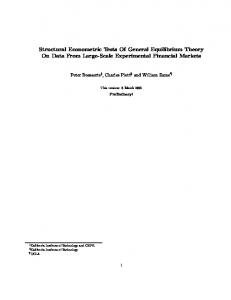
say, 0.8 cycles, then the data held in the middle (C1) latch will be valid before the fall of C1. This can be used to get an early start on P2 and thus close P2’s timing. When cycle stealing is used, testing the individual paths separately does not suffice to prove that the combined path will operate correctly at speed. An at-speed test for P1 proves that P1 meets full-cycle timing. A test would have to be applied at 20% beyond functional speed to validate the 0.8 cycle timing in this example. Testing the combined path at speed is a simpler way of validating the timing for these paths. 3 Preliminary Results
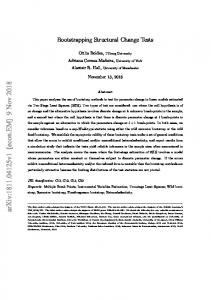
Figure 1: Memory Path Delay with Transition Launched from Data Output Port Memory paths are launched from the data output ports of the memories and captured at the latches, or they can be launched from outputs of the latches and captured at the data input ports, address ports or control ports of the memories. For example, Fig.1 shows��a rising ��� ��� transition is of a memory launched from the data output port with multiple read/write ports. The memory has a read-off value of 0 at its output ports. As an example, to generate a test for this path, an ATPG engine writes a to one of the � � � � � � � � ��������� ) at some address( � data ports ( ��� ��input � ), then performs� a��read � ����operation ��������� ��of� the data value �� ��� at � � the same address( � ). Since has a read-off value of 0, a rising transition is formed as the is read out. The ATPG engine also needs to propagate the transition at the data output through the combinational logic to the input of a latch. The complete test sequence obviously requires several clocks to perform the write, read and latch capture operations.
Our experiment targeted the MPC7455 microprocessor. Statistics are shown in Table 1. frequency 1Ghz+
transistor 6.8M
latch 123k
Stuck-at faults 6.2M
Table 1: Statistics for MPC7455 Different types of scan tests were generated by several ATPG tools. A simple set of transition test patterns which did not go through memories had a fault coverage of 70% with around 13k patterns. A second, complex set of transition test patterns which went through memories had a fault coverage of 78% with around 12k patterns. We also eliminated paths that go through test-only logic from these transition test patterns. The test-only paths do not need to operate at the maximum chip frequency.
2.4.3 Cycle Stealing Path Delay Tests Cycle stealing is a necessity in many high-speed ICs. As an example, consider a two-phase clock, latch-based design as shown in Fig.2. Here the transition on the delay path is launched on the rising edge of the first c2 pulse. Depending on the delay of the combinational logic in P1, the time at which the transition arrives at the first (C1) latch varies. Likewise, the delay along P2 affects the arrival time at the second (C2) latch. The combined path needs to meet a timing of three halfcycles. In the simple case, P1 is a full cycle path (rise of C2 through fall of C1) while P2 is a half-cycle path (must propagate during second C2 pulse). If P2 fails to meet half-cycle timing, we can steal time from P1 if P1 propagates in less than a full cycle. If P1 propagates in
Figure 2: A Cycle Stealing Path
Paper 2.2 33
We ran STA and selected the top 2490 critical timing paths. 1463 of them were core latch to latch delay paths, 91 of them were memory paths, 230 were cyclestealing paths. The rest of the 700 or so paths were miscellaneous paths including those in the clock regen or precharge logic, which were not suitable for delay test. The path delay test coverage numbers are shown in Table 2. The third column, path cov., was defined as the number of robustly and/or non-robustly detected paths over the total number of paths under consideration(PUC). The fourth column, Test eff., was defined as the number of detected or undetectable paths over the total number of PUC. Path types Latch to latch Memory Cycle stealing
Paths 1463 91 230
Path cov. 60% 95% 63%
Test eff. 96.7% 100% 100%
Table 2: Path delay coverage nums
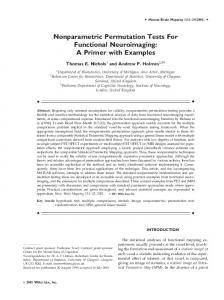
3.1 Initial, Module Results 14 production modules were used as an initial sample for this study. The maximum frequencies of the various test types (functional, transition, etc) were measured. The measurements of the frequencies were carried out through shmooing on an Agilent 93000 tester. The modules were tested at 1.3v under room temperature. We normalized all the frequencies using the corresponding functional frequencies of the modules. The normalized maximum frequencies of each module measured using different tests were plotted in Fig. 3 through Fig. 5. The averages(AVE) and standard deviations(STD DEV) of the normalized frequency data were calculated and shown in Fig.3 through Fig.5. The corresponding Gaussian distribution curves were drawn. The x axis of the Gaussian curves were divided into speed bins based on their standard deviations. Here we used 0.5 of STD DEV as the width of the speed bins. For example, in Fig.3, the complex transition tests showed a standard deviation of 1.80%. For these patterns, the bins would be 0.9% wide. We then plotted the histogram of the normalized frequency data of the modules. The numbers inside the boxes of the speed bin histogram were the module numbers in the respective bins. The complex transition tests which went through the memories provided the closest match to the functional frequencies, 99.91% on average with 1.8% standard deviation. The simple set of transition tests, which did not go through memories, on the other hand, provided speed
Paper 2.2 34
Figure 3: Transition Test Frequency Distribution
Figure 4: ABIST Frequency Distribution binning results 1.39% higher than the functional results. This is understandable since the memories were associated with the most speed limiting paths. Note that these results are somewhat improved over the earlier results reported in [2]. ABIST tests provided speed binning results slightly lower and wider spread than those provided by the transition tests. This validated the fact that the on-chip memories gate the frequency of the chip.
These are believed to be caused by delay defects (mostly gross-delay defects, a few small-delay defects). This underscores the need for AC testing in order to achieve acceptable quality levels. Data for these sites was discarded. Valid data was received for a total of 411 die. Due to a data collection error, complex path test data was only available for 207 of these 411 die. Distribution plots of different structural frequencies normalized to the functional frequencies were shown in Fig.6 to Fig.9.
Figure 5: Path Test Frequency Distribution The latch to latch path tests (Fig.5) ran about 20% faster than the functional tests. This is understandable in that most of the critical paths are associated with the custom memory blocks. Clearly, generating path delay tests through the custom memory blocks provided a better indicator of module performance. The complex path tests (memory paths plus cycle stealFigure 6: Transition Test Frequency Distribution ing paths) ran about 3% faster than the functional tests. The complex transition tests still provided the closGiven the limited number of complex paths tested (145), est match to the functional frequencies (99.01% on avthese results seem to match the static timing analysis reerage). At wafer probe, these patterns ran 0.9% slower sults. than the original 14 module sample (based on normalized averages). The results were more variable with a 3.06% standard deviation versus 1.80% from the module sam3.2 Wafer Probe Results ple. The simple transition tests ran an average of 1.9% A larger data sample was collected from various sites on slower than functional tests (98.10%). This differed from seven wafers from a recent manufacturing lot. The data the module results where these patterns ran 1.39% faster was collected from arbitrary sites during wafer test on a than the functional tests. The simple transition tests ran Teradyne J973 tester. The raw data from the tester showed 3.29% slower at wafer than at module. The ABIST tests averaged 3.83% slower than funca modest number of sites failing one or both sets of transition tests (the transition tests failed at the slowest speed tional test (compared with 1.88% from the module samapplied). A small number of modules showed transition ple). The simple path tests ran much slower at wafer test. test results far slower than their functional test results.
Paper 2.2 35
Figure 7: ABIST Frequency Distribution
Figure 9: Complex Path Test Frequency Distribution and module test. 3.3 Speed Binning Results
To assess the suitability of the various structural tests for use in speed binning, the wafer test data was used to speed bin the 411 die into one of two bins (fast or slow). The cut-off between slow and fast die was defined arbitrarily as the average of the measured Fmax of the dies. For example, if the average measured Fmax value was 1030 Mhz, parts at or above 1030 Mhz would be defined as fast while parts below 1030 Mhz would be defined as slow. In practice, parts right around 1030 Mhz could be offered for sale as operating at 1.0 Ghz - reserving a 3% guardband as a hedge against speed binning errors. Figure 8: Simple Path Test Frequency Distribution The following tables give the speed binning results for each of the test types. The 411 dies used yield 232 ”fast” Where the module results had Pmax/simple averaging parts and 179 ”slow” parts based on the functional test 19.44% faster than functional test, the wafer data shows and the 3% guard band. Table 3 uses the average Fmax Pmax/simple averaging 9.28% faster than functional. The values as the cut-off between slow and fast bins for all complex path tests also ran much slower at wafer test - av- the structural tests. Table 4 uses the linear regression to eraging 7.88% slower than functional tests (versus 3.36% assign a cut-off for each particular test type. faster in the module sample). Both types of path tests ran The Under column lists the percentage of the 411 parts over 10% slower at wafer probe than they had in the orig- incorrectly assigned to the ”slow” bin based on a particinal module sample. ular test type. (”fast” part errantly classified as ”slow”). It can be observed that all of the test types ran slower The Over column lists the percentage of the 411 parts in(compared with Fmax) at wafer probe compared to the correctly assigned to the ”fast” bin. The parts in the Under original 14 module sample. The complex transition tests column are sold for less money than what they would have were affected the least (losing less than 1%) while the path got, which resulted in loss in profit. The parts in the Over tests were hit the hardest (running 10% slower). Possi- column present potentially more serious problems of parts ble explanations for this include differences in hardware being returned by customers because they run at slower vintage, electrical environment, and thermal control. The than rated frequency. To avoid the more serious problem wafer data was collected from newer, faster lot than was of customer returns, it is unavoidable to have some parts used in the original module sample. The electrical envi- falling in the Under column. ronment is not as robust at wafer test as it is for module The GB column lists the guardband that would be retest. There are also differences in cooling between wafer quired in order for all of the parts in the Over column to
Paper 2.2 36
operate at their offered speed determined by the functional tests. Test Type Complex Transition Simple Transtion ABIST Simple Path Delay Complex Path
Under 7.5% 18.7% 34.8% 0% 55.6%
Over 5.4% 0.8% 0.5% 35.3% 0%
GB 1.8% 1.1% 1.8% 10.3% 0%
Table 3: Speed Binning Using the Average of the Measured Fmax
Test Type Complex Transition Simple Transition ABIST Simple Path Delay Complex Path Delay
Under 4.4% 3.2% 3.9% 5.8% 1.9%
Over 6.6% 6.1% 5.4% 7.3% 4.8%
GB 2.2% 2.2% 2.2% 6.4% 2.2%
Table 4: Speed Binning Using the Linear Regression
References [1] M. Abadir, R. Raina. “Design-For-Test Methodology for Motorola PowerPC Microprocessors”, in Proceedings of International Test Conference, pp.810819, 1999. [2] D. Belete, A. Razdan, W. Schwarz, R. Raina, C. Hawkins and J. Morehead. “Use of DFT Techniques In Speed Grading a 1GHz+ Microprocessor”, in Proceedings of International Test Conference, Oct. 2001. [3] B. Cory, R. Kapur and B. Underwood. ”Speed Binning with Path Delay Test in 150-nm Technology”, in IEEE Design & Test of Computers, pp.41-45, Sep-Oct 2003. [4] A. Crouch, J. Potter and J. Doege. “AC Scan Path Selection for Physical Debugging”, in IEEE Design & Test of Computers, pp.34-40, Sep-Oct 2003. [5] K. Kim, S. Mitra and P. Ryan. “Delay Defect Characteristics and Testing Strategies”, inIEEE Design & Test of Computers, pp.8-16, Sep-Oct 2003.
[6] X. Lin, R. Press, J. Rajski, P. Reuter, T. Rinderknecht, B. Swanson and N. Tamarapalli. “High-Frequency, It can be seen that several of the test types produced At-Speed Scan Testing”, in IEEE Design & Test of moderately good results (on the order of 5% each under Computers, pp.17-25, Sep-Oct 2003. and over with a 3% guardband sufficient to protect against errors). Only the complex transition tests produced ac- [7] B. Madge, B. Benware and R. Daasch. “Obtaining ceptable results without using a linear regression to pick High Defect Coverage for Frequency-Dependent Dethe frequency cut-off. The simple path tests were the only fects in Complex ASICs”, in IEEE Design & Test of tests that did not produce acceptable results even when Computers, pp.46-53, Sep-Oct 2003. linear regression was used. The complex path tests (with [8] N. Tendolkar, R. Molyneaux, C. Pyron and R. Raina. linear regression) produced the best results. “At-speed testing of delay faults for Motorola’s MPC7400, a PowerPC TM microprocessor”, in Pro4. Conclusions and Follow-up Work ceedings of VLSI Test Symposium, pp.3-8, 2000. We carried out our experiment during a final test for 14 [9] N. Tendolkar, R. Raina, R. Woltenberg, L. Xijiang, module sample and also a probe test for 411 parts. We B. Swanson and G. Aldrich . “Novel techniques for showed the distributions of various structural frequencies achieving high at-speed transition fault test covernormalized to the functional frequencies. We observed age for Motorola’s microprocessors based on Powthat transition tests going through the memory arrays gave erPC/spl trade/ instruction set architecture”, in Prothe best correlation with the functional frequencies on ceedings of VLSI Test Symposium, pp.3-8, 2002. average among all the tests and the best speed binning results when using the average Fmax values as the cut- [10] R. Raina, R. Bailey, D. Belete, V. Khosa, R. Molyneaux, J. Prado and A. Razdan. “DFT Advances off frequency. Complex path delay tests gave the best in Motorola’s Next Generation 74xx PowerPC Microspeed binning results when using the its linear regression. processor”, in Proceedings of International Test ConOur results showed the importance of structural testing ference, pp.131-140, 2000. through the memory arrays. For future work, we plan to package and investigate the parts with gross and subtle defects which ran much slower in structural tests compared to functional tests.
Paper 2.2 37