On Development of Intellidrive-based Red Light Running Collision Avoidance System Lanjun Wang California PATH Program,University of California, Berkeley Department of Electronic Engineering, Tsinghua University 1357 S. 46th Street, Richmond, California 94804 Telephone:(510)665-3659;Fax:(510)665-3537 Email:
[email protected]
April 3, 2009
Lanjun Wang: On Development of Intellidrive-based RLR Collision Avoidance System
1
ABSTRACT Intellidrive offers great potential for various new safety and mobility applications. This paper reports on an Intellidrive application for signalized intersection safety, where signals can dynamically adapt to hazardous conditions in order to avoid Red-Light-Running (RLR) related collision. As an important portion of the intersection collision avoidance system, a model for the RLR prediction based on Intellidrive vehicle-toinfrastructure communications is proposed. Both the isolated vehicle motion and car-following status are used for the road-side unit to predict signal violation. The prediction is an improvement to a previous RLR detection means reported to-date. Issues related to such a dynamic system with integration of infrastructure (signal controller) and Intellidrive communications are discussed. The system performance is then emulated using data collected from infrastructure-based sensor as an alternative source to Intellidrive data which is not widely available yet. Moreover, from a field experiment, we show the accurate and timely RLR prediction potential that will be provided by Intellidrive-equipped vehicles. INTRODUCTION Traffic crashes are the most significant cause of preventable death and injury in North America. The National Highway Traffic Safety Administration (NHTSA) reports that in 2005 alone, nearly 9,200 people were killed and approximately one million people were injured in intersection-related crashes. These intersection-related crashes account for about 40%-45% of all crashes. According to 2005 data from NHTSA’s Fatality Analysis Reporting System, crashes caused by red light running (RLR) resulted in an estimated 805 fatalities (1 ). The national initiative of Vehicle Infrastructure Integration (VII; recently re-named as Intellidrive) reveals great potential in intersection safety applications (2 , 3 ). Important national projects include the Cooperative Intersection Collision Avoidance System (CICAS)-Violations (CICAS-V) , developed by various manufacturers, CICAS-Stop Sign Assist (CICAS-SSA), conducted by Minnesota DOT and University of Minnesota, CICAS-Signalized Left-Turn Assist (CICAS-SLTA) and Traffic Signal Adaptation (CICAS TSA), being developed by a partnership between Caltrans and California PATH at the University of California, Berkeley (4 , 5 ). The research in this paper is supported by CICAS-SLTA and TSA, conducted at California PATH. The CICAS TSA system intends to dynamically adapt the traffic signal in the form of extending an all-red period by a few seconds to avoid collisions due to signal violations. A dynamic TSA system comprises several elements, including Intellidrive-based state-map building, signal violation (hazardous situation) prediction and countermeasures. While these elements are all critical and interrelated, the RLR prediction is the most critical challenging element, as reliable detection of RLR behavior is the prerequisite for successfully executing safety countermeasures.
Lanjun Wang: On Development of Intellidrive-based RLR Collision Avoidance System
2
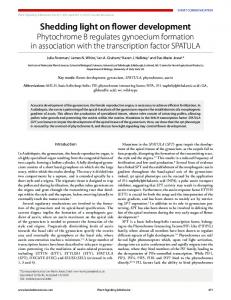
Researchers have proposed various models for vehicle motion prediction at signalized intersections (6 , 7 , 8 ). Sheffi and Manhamassani (6 ) assumed that a "critical time" is normally distributed among drivers, and developed a statistical model of driver behavior at a high speed isolated intersection after the onset of the yellow light. California PATH recently proposed an extended probabilistic model to address vehicle speed and acceleration, and to address two different kinds of errors when optimizing system performance (8 ). This paper focuses on an Intellidrive-based violation prediction algorithm which is specially designed for all-red extension for Intellidrive-enabled vehicles in order to improve RLR prediction performance for the CICAS TSA system. This work is a continuation of the algorithm reported in (8 ) in the sense that an elaborate model which takes into account both the isolated vehicle motion as well as the car-following status to form a prediction algorithm which works for Intellidrive-enabled vehicles. The study introduces another dimension of information, which is the car-following status measured by the speed difference of the leading vehicle and the following vehicle at a certain time (relative to red-onset). From the field observations (9 ), it is found that over 60% of the vehicles were in a platoon (in the sense that headways were less than 3 seconds). It is important to note that the driver’s decision making procedure is not only impacted by the signal phase, but by the leading vehicle as well. This additional piece of information helps to better understand driver reaction to the signal phase change, especially for the cases when drivers do not decelerate very hard after the onset of the yellow light and thus whose stop-go decisions are not easily predicted. This paper is organized as follows. Section 2 presents a brief description of the system, contains a conceptual diagram of the whole CICAS TSA system and how the RLR prediction algorithm works, and especially discusses the performance of Intellidrive. Section 3 verifies the improved prediction method with data from an infrastructure-based sensor, and proves the Intellidrive’s advantages. Finally, section 4 offers conclusions to this paper. INTELLIDRIVE BASED RLR PREDICTION FOR CICAS TSA When an Intellidrive-equipped vehicle is approaching a signalized intersection, the on-board equipment (OBE) sends vehicle information to the road-side equipment (RSE). Typical vehicle data includes vehicle trajectory data (speed, position, time stamp, etc). Together with such data, the RSE also has information about the infrastructure, such as geometrical intersection description (GID), and signal phase and timing (SPAT). A processor in the RSE will determine whether a violation will occur and request an all-red extension for impending violations. The conceptual structure of the Intellidrive-based TSA system is shown in Fig. 1. For each approaching vehicle i , we have a series of speeds: {vi (1) , vi (2) , ..., vi (K)}
Lanjun Wang: On Development of Intellidrive-based RLR Collision Avoidance System
3
All-red Extension Request
Vehicle OBE
GID Vehicle Information
Signal Controller GPS
Road-side Equipment Predictor
Sensor
SPAT
FIGURE 1 : The conceptual structure of the Intellidrive-based TAS system. The dash lines in the figure represent the Intellidrive communication; the solid lines represent the serial cable; and the bold dot lines represent the in-vehicle data communication. and time stamps: {ti (1) , ti (2) , ..., ti (K)} at the following distances to the intersection: {di (1) , di (2) , ..., di (K)} where K is the total number to consider. At an intersection, together with RLR, we can observe another two interesting maneuvers after the onset of the yellow light, to include the "go-through-in-yellow" and the "first-to-stop". Every few hundred milliseconds (or equivalently, about every few meters) speed and location of each subject vehicle will be received by the road-side processor. Not all of the whole trajectory will help in discriminating the movement of the vehicle, or in another words, the decision of the driver to proceed or not. From our previous observation, it is clear that the later into the onset of the yellow light and the closer to the intersection, the more distinguishable the stop-and-go maneuvers. So the data from the continuous trajectories of the subject vehicles (SV) are reduced to a minimum set of speed and distance-to-intersection for purpose of prediction. While with an infrastructure-based sensor only, we can use the speeds of SVs at certain locations, whose distances are determined by the average distribution of time-into-red multiplied by the running speed of the violators. While for the Intellidrive-based prediction, we have the advantage of doing a "last second" prediction, that is to predict the SV movement "right before" the termination of the all-red phase (after which it would be too late to request an all-red extension). The Intellidrive-based system for the traffic signal adaptation has the following advantages: (1) we could more easily track a vehicle and learn the inter-vehicle motions, which is an important factor incorporated in this new model; (2) we could distinguish more agile maneuvers when closing up the intersection than
Lanjun Wang: On Development of Intellidrive-based RLR Collision Avoidance System
4
with discrete sensors; and (3) we could obtain the speed of the vehicles at certain times ("last second"), which is more closely related to the driver reaction than data at certain fixed locations. All of these advantages can be verified through experiments. A predictor will be formed with the last two measurements obtained from the SV before the "last second". The parameter set X contains the average speed, acceleration and speed difference with its leading vehicle (if there is any). The definition of the first two variables are the same as the previous work (8 ), depicted as vF (k) + vF (k + 1) 2 vF (k) − vF (k + 1) a= tF (k) − tF (k + 1) v¯ =
(1) (2)
The third one represents the car-following status of the SV, defined as the difference between the SV and the leading vehicle’s (if there is any) speed at the time t, depicted as ∆v = vˆL (t) − vF (t)
(3)
where vˆL (t) is the estimation of leading vehicle speed at t, which we select as tF (k) in our algorithm implementation. The RLR predictor is a combination of a stop-versus-go predictor D (X) with an Neyman-Person optimized decision region, and an arrival time estimator, which generates estimated arrival time at intersection tˆI of the "going-through" vehicles. So a vehicle which is predicted to be "going-through" and with an estimated arrival time at the intersection later than red onset will be predicted RLR. This RLR prediction algorithm is shown in Fig. 2. EXPERIMENTAL STUDY OF INTELLIDRIVE BASED TSA RLR PREDICTION ALGORITHM Two experiments were designed for verification purposes. The first one is at the intersection of Page Mill Road and El Camino Real on the peninsula region of the San Francisco Bay Area. This experiment aims to verify the better RLR prediction performance after the incorporation of the car-following status. Infrastructurebased sensors were used due to the lack of objective observations from Intellidrive-equipped vehicles when the market penetration rate of Intellidrive is still low. The infrastructure-based sensors can provide data at certain fixed locations. So we use the sensor data at a series of locations to emulate what the Intellidrive would provide by interpolating the sensor data. The second experiment is a case study in test field with an Intellidrive-equipped intersection and two Intellidrive-enabled vehicles. From this experiment, we can show the benefits of an Intellidrive-based system.
Lanjun Wang: On Development of Intellidrive-based RLR Collision Avoidance System
Signal Controller SPAT
Following Vehicle Trajectory
Time to Intersection
tˆI
Average Speed v
5
Leading Vehicle Trajectory
Accelerator
Speed Difference
a
Dv
D ( v , a, Dv ) tˆI > Time to red onset
Go Stop
Yes
No First-to-stop
Red-Light-Running
Go-through-in-yellow
FIGURE 2 : The dataflow of RLR prediction algorithm Infrastructure-based Sensor Data were collected by Autoscope cameras. Nine cameras were installed at three approaches to the arterial intersection. The engineering data from virtual speed loops of Autoscope include the speed, time stamp (accuracy up to 33ms) as well as the SPAT. After calibration and data processing, the full trajectory of each vehicle was built. Data were collected from May 14th, 2008 to June 21st, 2008. The dataset contains 20 RLR, 292 "first-to-stop" and 1,477 "go-through-in-yellow" samples. The sample trajectories are shown in Fig. 3, which also illustrates the configuration of the virtual speed loops. Interesting samples were selected from East Bound for comparison purpose. We selected these samples with the following criteria: 1. Both the SV and its leading vehicle keep in the same lane; 2. The leading vehicle keeps directly ahead of the SV through all virtual speed loops; 3. At the advanced rear detector (195 feet from intersection), the headway of the SV is less than a given threshold (5s). As the previous work (8 ), system operating characteristic (SOC) is used to verify RLR predictor performance. The SOC shows the relationship between the false alarm rate and detection rate of RLR. In Fig. 4, the SOCs with and without using car-following status are compared. It is found that by incorporating the car-following status, prediction performance significantly overall improved in the sense that at given a false alarm rate, the system achieves a higher detection rate. For example, at false alarm rate 0.032, the
Lanjun Wang: On Development of Intellidrive-based RLR Collision Avoidance System
6
Distance to the intersection (ft)
195
120
90
60
30
0
0
1
2
3
4
5
6
7
Time (s)
FIGURE 3 : These are sample vehicle trajectories collected using infrastructure-based sensor. The crosses are for the SV; and the diamonds are for its leading vehicle. detection rate of the improved method is approximately 40% higher than the previous one. The contribution to this detection rate enhancement is the threshold of ∆v ≤ 0, which suggests that the following vehicle often moves faster than the leading one for violation. Field Test Experiment This experiment is in the Intellidrive-equipped intersection is at the Richmond Field Station, University of California, Berkeley, which is shown in Fig. 5. The Fig. 6 shows the recorded trajectories of vehicles and status of the traffic signal. In Fig. 6, the diamonds are for the leading vehicle; and the crosses are for the following vehicle. The upper subplot describes speed vs. time, and the SPAT is also shown; and the lower subplot is the time-space diagram. Based on the high quality of data, the advantages of Intellidrive is very obvious compared with infrastructure-based sensors in the RLR prediction. The data in Fig. 6 are when the driver did a "stop-thengo" maneuver. RLR with this kind of maneuver would not have been successfully detected with sparsely spaced discrete sensors only. However, with Intellidrive data, the last second acceleration can be observed and thus a correct prediction can be achieved. Another purpose of using an Intellidrive-based test is to determine critical parameters for the prediction algorithm, one of which is the exact time point for the "last-second" the prediction needs to be made in order to successfully execute countermeasures. This time would be related to the communication latency,
Lanjun Wang: On Development of Intellidrive-based RLR Collision Avoidance System
7
0.9 0.8
Detection rate for RLR
0.7 0.6 0.5 0.4 0.3 0.2 0.1 0
Simulated SOC with {v,a} Simulated SOC with {v,a,∆ v} 0
0.01
0.02 0.03 0.04 False alarm rate for RLR
0.05
0.06
FIGURE 4 : This is the SOC curve of RLR prediction. The vehicle maneuvers at 90ft and 60ft detector position were chosen for prediction.
FIGURE 5 : The intersection in the circle is the test intersection, and the red line shows the experiment route.
Lanjun Wang: On Development of Intellidrive-based RLR Collision Avoidance System
8
Speed(m/s)
15
10
5
Yellow Onset
0
1
2
3
Red Onset
4
5
6
7
4
5
6
7
Distance to intersection (ft)
Time (s) 200 150 100 50 0
0
1
2
3 Time(s)
FIGURE 6 : These are sample vehicle trajectories collected using Intellidrive. processing time and the time for the signal controller to react to an all-red extension request. From our field test experiments, the average of communication latency is around 100ms, which is not prominently influenced by the choice of prediction time. As a result, the vehicle behavior prediction that we make is related more to the driver reaction than data at a fixed location. CONCLUSION This paper investigates an Intellidrive application at a signalized intersection, which aims to avoid a collision caused by RLR. The probabilistic model for the RLR predictor based on Intellidrive communication has been improved. Speed difference, which represents the inter-vehicle motion, acts as a parameter in the predictor, as well as speed and acceleration which are included in the previous work (8 ). The previous prediction algorithm is also implemented here. Several advantages of the Intellidrive application are illustrated. In the experiment of actual road test, we use an infrastructure-based sensor, which can be treated as an emulation case of Intellidrive, to collect empirical data. The result shows the enhancement of the RLR detection rate after the extension of the parameter set. Moreover, a field experiment is also conducted using an Intellidrive-equipped intersection and vehicles. The purposes are two-fold: The first is to derive critical parameters related to the proactive safety system, such as communication delay, which in turn determines the latest time for an all-red extension
Lanjun Wang: On Development of Intellidrive-based RLR Collision Avoidance System
9
request. The second is to qualitatively validate the benefits of using Intellidrive for various real-world scenarios which can take place in field. The designed tests showed that Intellidrive supports more reliable RLR prediction. Before Intellidrive technology reaches a high market penetration, the deployment of the Intellidrive based RLR countermeasures will provide limited benefits. We anticipate that a combination of infrastructurebased sensors with Intellidrive technology would fill the gap before Intellidrive becomes widespread. The proposed RLR prediction algorithm is designed to work with discrete infrastructure-based sensors as well. ACKNOWLEDGEMENT The author would like to thank colleagues Wei-bin Zhang, Liping Zhang, and Mark Miller for their suggestions and comments which significantly improve the quality of this paper, and Kun Zhou for the help in test field experiment. And the author also would like to thank China Scholarship Council for supporting her study in U.S. REFERENCES 1. NHTSA, Traffic Safety Facts 2005, DOT HS 810 631, U.S. Department of Transportation, Washington, D.C., 2005. 2. Heft, R., VII System Architecture, 2005. 3. Schagrin, M., National VII Architecture - Data Perspective, 2008. 4. Holfelder, W., Communications for Vehicle Safety and Vehicle Safety Communication in the U.S., 2006. 5. McHale, G., CICAS Program Overview, 2008. 6. Sheffi, Y. and H. Mahmassani, A Model of Driver Behavior at High Speed Signalized Intersections. Transportation Science, Vol. 15, No. 1, 1981, p. 50. 7. Bonneson, J. and H. Son, Prediction of Expected Red-Light-Running Frequency at Urban Intersections. Transportation Research Record, Vol. 1830, 2003, pp. 38–47. 8. Zhang, L., K. Zhou, W. Zhang, and J. Misener, Prediction of Red-Light Running Based on Statistics of Discrete Point Sensors, 2009, presented in the 88th TRB annual meeting and to appear on Transportation Research Record. 9. Zhang, L., K. Zhou, W. Zhang, and J. Misener, Empirical Observations of Red Light Running at Arterial Signalized Intersection, California PATH Tech Note 2008-01, California PATH Program, University of California, Berkeley, 2008.